Microsoft SQL Server 2014
Business Intelligence
Development Beginner's Guide
Get to grips with Microsoft Business Intelligence and data
warehousing technologies using this practical guide
Reza Rad
Development Beginner's Guide
Copyright © 2014 Packt Publishing
All rights reserved. No part of this book may be reproduced, stored in a retrieval system, or transmitted in any form or by any means, without the prior written permission of the publisher, except in the case of brief quotations embedded in critical articles or reviews. Every effort has been made in the preparation of this book to ensure the accuracy of the information presented. However, the information contained in this book is sold without warranty, either express or implied. Neither the author, nor Packt Publishing, and its dealers and distributors will be held liable for any damages caused or alleged to be caused directly or indirectly by this book.
Packt Publishing has endeavored to provide trademark information about all of the companies and products mentioned in this book by the appropriate use of capitals. However, Packt Publishing cannot guarantee the accuracy of this information.
First published: May 2014
Production Reference: 2220514
Published by Packt Publishing Ltd. Livery Place
35 Livery Street
Birmingham B3 2PB, UK.
ISBN 978-1-84968-888-8
www.packtpub.com
About the Author
Reza Rad has more than 10 years of experience in databases and software applications.
Most of his work experience is in data warehousing and business intelligence. He has worked with Microsoft technologies from SQL Server 7 and Visual Basic 6 to the latest versions of SQL Server and .NET. He has a Bachelor's degree in Computer Engineering. Reza is a DW/BI architect and consultant. He has worked with large enterprises around the world and delivered high-quality data warehousing and BI solutions for them. He has worked with industries in different sectors, such as Health, Finance, Logistics, Sales, Order Management, Manufacturing, Telecommunication, and so on.Reza has been awarded the Microsoft Most Valuable Professional in SQL Server from 2011 to 2014. He is an international speaker in SQL Server, BI, and DW conferences around the world. He speaks in SQL PASS Summits, Microsoft TechEd, SQL Saturdays, SQL Server user groups, and code camps.
Reza has written books on SQL Server and databases. One of his most recent books is SQL
Server 2012 Integration Services: An Expert Cookbook, Packt Publishing.
Reza is a big fan of data-related technologies, his expertise is in EIM, ETL, Data governance, big data, data warehousing, BI, data visualization, Master Data Management, OLAP, and so on. He is the author of Webcast series on the RADACAD website (http://www.radacad.com). He
About the Reviewers
John Heaton graduated top of his class with a Diploma in Information Technology from
Technikon Witwatersrand in South Africa (equivalent to a Bachelor's degree in Computer Science). He has worked for more than 10 years with Oracle Corporation and has held various positions, including that of a Practice Manager. He had been co-running the North Business Intelligence and Warehouse Consulting practice, delivering business intelligence solutions to Fortune 500 clients. During this time, he steadily added business skills and business training to his technical background.In 2005, John decided to leave Oracle and become a founding member in a small business named iSeerix. This allowed him to focus on strategic partnerships with clients to design and build Business Intelligence and data warehouse solutions.
John's strengths include the ability to communicate the benefits of introducing a Business Intelligence solution to a client's architecture. He has gradually become a trusted advisor to his clients. His philosophy is based on responsibility and mutual respect. He relies on the unique abilities of individuals to ensure success in different areas and strives to foster a team environment of creativity and achievement.
Today, John specializes as a Solution / Technical Architect assisting customers in designing large complex data warehouses. Through the years, he has worked in numerous industries with differing technologies. This broad experience base allows him to bring a unique perspective and understanding when designing and developing a data warehouse. The strong business background, coupled with technical expertise, and his certification in Project Management makes him a valued asset to any data warehouse project.
in Singapore. He is a Microsoft Certified Trainer and a Certified Novell Instructor. Some of the courses that he is authorized to deliver and has delivered include Microsoft SQL Server Business Intelligence, Microsoft Windows Server, Microsoft SharePoint, Microsoft Exchange Server, and Suse Linux Enterprise Server. Throughout his training, he has consistently maintained a Metrics that Matter score exceeding 8 out of 10. He has also been instrumental in customizing and reviewing his training center's training for its clients. When imparting knowledge, his objective has been to make technologies easy and simple for everyone to learn. His no-frills approach to training has gained him recognition over the years from both clients and employers, where his clinching of the Best Instructor Award, an accolade conferred by his employer, bore testimonial. He has been in the training industry for five years, and prior to that, he was associated with a Japanese MNC in Singapore as a Systems Analyst, specializing in data warehousing on Microsoft SQL Server, RPG programming on the IBM iSeries, and BPCS ERP. Over the years, he has chosen to focus his work and specialization on Microsoft SQL Server and is currently in full-time employment with a Fortune 500 company in Singapore, taking up the specialist, consultancy, developer, and management roles.
Raunak T. Jhawar is a graduate in Computer Science from the University of Pune and has
more than five years of experience working as a software professional working with BI, data visualization, and Hadoop.Raunak is presently working with Aditi Technologies in Bangalore as a Technical Leader, working with clients and consulting them for their BI and analytics engagements.
James Serra is an independent consultant with the title of Data Warehouse/Business
Intelligence Architect. He is a Microsoft SQL Server MVP with over 25 years of IT experience. He started his career as a software developer, and then he was a DBA for 12 years. For the last seven years, he has been working extensively with Business Intelligence using the SQL Server BI stack. He has been a permanent employee, consultant, contractor, and owner of his own business. All these experiences, along with continuous learning, have helped him to develop many successful data warehouse and BI projects. He is a noted blogger and speaker, having presented at the PASS summit and the PASS Business Analytics Conference.James has earned the MSCE: SQL Server 2012 Business Intelligence, MSCE: SQL Server 2012 Data Platform, MCITP: SQL Server 2008 Business Intelligence Developer, MCITP: SQL Server 2008 Database Administrator, and MCITP: SQL Server 2008 Database certificates. He has a Bachelor of Science degree in Computer Engineering from UNLV.
James resides in Houston, TX with his wife Mary and three children, Lauren, RaeAnn, and James.
www.PacktPub.com
Support files, eBooks, discount offers, and more
You might want to visit www.PacktPub.com for support files and downloads related to your book.
Did you know that Packt offers eBook versions of every book published, with PDF and ePub files available? You can upgrade to the eBook version at www.PacktPub.com and as a print book customer, you are entitled to a discount on the eBook copy. Get in touch with us at service@ packtpub.com for more details.
At www.PacktPub.com, you can also read a collection of free technical articles, sign up for a range of free newsletters and receive exclusive discounts and offers on Packt books and eBooks.
TM
http://PacktLib.PacktPub.com
Do you need instant solutions to your IT questions? PacktLib is Packt's online digital book library. Here, you can access, read and search across Packt's entire library of books.
Why subscribe?
Fully searchable across every book published by Packt Copy and paste, print and bookmark content
On demand and accessible via web browser
Free access for Packt account holders
If you have an account with Packt at www.PacktPub.com, you can use this to access PacktLib today and view nine entirely free books. Simply use your login credentials for immediate access.
Table of Contents
Preface 1
Chapter 1: Data Warehouse Design
7
Understanding Business Intelligence 7
The architecture and components of a BI system 9
The data warehouse 9
Extract Transform Load 10
Data model – BISM 10
Data visualization 12
Master Data Management 12
Data Quality Services 12
Building the data warehouse 13
Dimensional modeling 14
Fact or measure 15
Dimension 15
The Fact table 15
Grain 15
The star schema 16
An example of Internet sales 16
FactSales 18
The customer dimension 19
DimDate 20
DimProduct 22
DimStore 22
Types of facts 22
The Factless Fact table – The Bridge table 23
Chapter 2: SQL Server Analysis Services Multidimensional Cube
Development
27
Why is OLAP required? 27
Understanding the SQL Server Analysis Services engine 29
Developing your first cube 31
Time for action – creating an Analysis Services project 31
Time for action – creating the first cube 33
Time for action – viewing the cube in the browser 37
Dimensions and measures 39
Time for action – using the Dimension Designer 39
Time for action – change the order of the Month attribute 42
Time for action – modifying the measure properties 43
Data Source View 44
Time for action – creating a Named Calculation 45
Time for action – using a Named Query 46
Using dimensions 46
Time for action – adding a Fact relationship 46
Hierarchies 49
Time for action – creating a hierarchy 50
Multidimensional eXpression, calculated members, and Named Sets 51
Time for action – writing an MDX query 51
Time for action – calculated members 53
Deploying and processing 54
Time for action – deploying an SSAS project 54
Time for action – processing the data 57
Summary 61
Chapter 3: Tabular Model Development of SQL Server Analysis Services
63
Introducing SSAS Tabular 64
Developing a tabular project 65
Time for action – creating a tabular project 65
Time for action – creating measures 68
Creating hierarchies 69
Time for action – creating a hierarchy from a single table 70
Time for action – creating a hierarchy from multiple tables 71
Data Analysis eXpression, calculated columns, and measures 73
Time for action – using time intelligence functions in DAX 73
Securing the data 76
Time for action – creating a model with the DirectQuery storage mode 80
Tabular versus Multidimensional SSAS 81
Summary 82
Chapter 4: ETL with Integration Services
83
Understanding ETL and data consolidation 84
Staging 84
SQL Server Integration Services 85
Integration Service projects and packages 86
Time for action – creating your first SSIS project 87
The Control Flow tab 88
Time for action – working with Control Flow tasks 88
The Data Flow tab 96
Time for action – loading customer information from a flat file into a database
table with a Data Flow Task 96
Containers and dynamic packages 107
Time for action – looping through CSV files in a directory and loading them
into a database table 107
Deploying and executing 112
Time for action – deploying an SSIS project 113
Time for action – executing an SSIS package from a catalog 114
Summary 117
Chapter 5: Master Data Management
119
Understanding Master Data Management 119
Master Data Services 121
Time for action – configuring MDS 122
Comparing WebUI with the Excel Add-in 123
Time for action – installing Excel Add-in 124
Creating models and entities 125
Time for action – creating a model and an entity 125
Time for action – creating an entity with data from the Excel Add-in 126
Time for action – change tracking 127
The entity relationship 129
Time for action – creating a domain-based relationship 129
Business rules 131
Time for action – creating a simple business rule 131
Integration management 136
Time for action – a subscription view 137
Time for action – entity-based staging 138
Summary 141
Chapter 6: Data Quality and Data Cleansing
143
Understanding data quality 143
Data Quality Services 145
Time for action – installing Data Quality Services 147
Knowledge Base Management 149
Time for action – creating a Knowledge Base 149
Knowledge discovery 151
Time for action – knowledge discovery 151
Data cleansing with Data Quality Projects 153
Time for action – using Data Quality Project for cleansing 153
Domain and composite domain rules 157
Time for action – composite domain rules 157
Synonyms and standardization 159
Time for action – creating synonyms and setting standardization 160
Matching 162
Time for action – matching policy 163
Time for action – matching projects 165
Integrating with MDS and SSIS 166
Time for action – the DQS cleansing component in SSIS 166
DQS integration with MDS 169
Summary 170
Chapter 7: Data Mining – Descriptive Models in SSAS
171
An introduction to data mining 171
The Microsoft Decision Tree algorithm 174
Time for action – creating a data mining solution with the Microsoft
Decision Tree algorithm 174
Microsoft association rules 184
Time for action – the Microsoft association rule 184
Algorithm parameters 190
Summary 191
Chapter 8: Identifying Data Patterns – Predictive Models in SSAS
193
Finding the best algorithm 193
Time for action – finding the best mining model with Lift Chart and Profit Chart 194
Time for action – predicting prospective bike buyers 207
Microsoft Time Series 214
Time for action – predicting future sales with Microsoft Time Series 214
Summary 218
Chapter 9: Reporting Services
219
The Reporting Services architecture 219
Developing a basic report 221
Time for action – creating our first report using SSRS 221
Extended report development 226
Parameters 226
Time for action – adding parameters to a report 226
Printing and page configuration 232
Time for action – changing a page's properties 232
Sorting and grouping 234
Time for action – applying ordering and grouping on the data rows 234
Expressions 237
Time for action – changing the background color of data rows based
on expressions 237
Adding charts 240
Time for action – working with charts in Reporting Services 240
Deploying and configuring 242
Time for action – deploying a report 242
Time for action – using Report Manager 245
Summary 246
Chapter 10: Dashboard Design
247
The PerformancePoint service 247
Time for action – configuring PerformancePoint in SharePoint 248
The Dashboard Designer utility 250
Time for action – creating your first dashboard with PerformancePoint
Dashboard Designer 250
The dashboard pages 253
Time for action – creating a dashboard page 253
PPS dashboard's on-the-fly features 256
Time for action – exploring on-the-fly features 256
Filters 259
Time for action – enabling Power View in Excel 263
Time for action – creating the first Power View dashboard 264
Map 266
Time for action – geographical data visualization using Power View 266
Scatter chart 269
Time for action – visualizing time-based information with a scatter chart 269
Filtering data 273
Time for action – using Filter in Power View 273
Wrapping up Power View 274
Summary 274
Chapter 11: Power BI
275
Self-service ETL with Power Query 275
Time for action – self-service ETL with Power Query 276
Power Map 285
Time for action – data visualization with Power Map 285
Summary 292
Chapter 12: Integrating Reports in Applications
295
Designing .NET applications with reports 296
Time for action – installing AdventureWorks SSRS sample reports 296
Developing reports in a web application 297
Time for action – working with reports in web/Windows applications 297
Developing reports in a Metro application 301
Time for action – working with reports in Metro applications 302
Working with ReportViewer in a local processing mode 303
Time for action – designing reports and working with the local processing mode 304
Passing parameters to a report 308
Time for action – changing a report configuration with a ReportViewer
Object through code behind 308
Using the results of a mining model in an application 313
Time for action – running DMX queries from a .NET application 313
Summary 321
Preface
Business Intelligence (BI) is one of the hottest topics nowadays in the Information Technology field. Many companies and organizations intend to utilize a BI system to solve problems and help decision makers make decisions. This high demand for BI systems has raised the number of job openings in this field.
The following is Gartner's definition of Business Intelligence
(http://www.gartner.com/it-glossary/business-intelligence-bi/):
Business Intelligence (BI) is an umbrella term that includes the applications, infrastructure and tools, and best practices that enable access and analysis of information to improve and optimize decisions and performance.
What this book covers
Chapter 1, Data Warehouse Design, explains the first steps in thinking and designing a BI system. As the first steps, a developer needs to design the data warehouse (DW) and needs an understanding of the key concepts of the design and methodologies to create the data warehouse.
Chapter 2, SQL Server Analysis Services Multidimensional Cube Development, explains how an OLAP multidimensional structure is required to provide fast query response and aggregated data from a data warehouse. In this chapter, readers will learn what OLAP provides and how to design OLAP with Microsoft SSAS Multidimensional.
Chapter 3, Tabular Model Development of SQL Server Analysis Services, explains that SSAS Tabular is a new method of presenting data in Microsoft BI 2012 and is very useful in small BI systems and when a developer wants to create POC. In this chapter, the reader will learn about SSAS Tabular and how to use it in BI projects.
Chapter 4, ETL with Integration Services, describes how ETL is an operation of transferring and integrating data from source systems into the data warehouse. ETL needs to be done on a scheduled basis. In this chapter, readers learn how to think about ETL processes and use SSIS to perform data transfers.
Chapter 5, Master Data Management, guides readers on how to manage reference data. Master Data Management (MDM) is very critical in all integrated systems, especially in BI and data warehouse. In this chapter, the reader will learn how to use Master Data Services (MDS) to implement an MDM solution.
Chapter 6, Data Quality and Data Cleansing, explains that data quality is one of the biggest concerns of database systems. The data should be cleansed to be reliable through the data warehouse. In this chapter, readers will learn about data cleansing and how to use Data Quality Services (DQS), which is one of the new services of SQL Server 2012, to apply data cleansing on data warehouse.
Chapter 7, Data Mining – Descriptive Models in SSAS, provides a descriptive model on historical events. In this chapter, readers will understand data mining concepts and how to use data mining algorithms to understand the relationship between historical data, and how to analyze it using Microsoft technologies.
Chapter 9, Reporting Services, explores Reporting Services, one of the key tools of the Microsoft BI toolset, which provides different types of reports with charts and grouping options. In this chapter, readers will learn when and how to use SSRS to create and design reports from data warehouses, SSAS Multidimensional, or SSAS Tabular.
Chapter 10, Dashboard Design, describes how dashboards are one of the most popular and useful methods of visualizing data. In this chapter, readers will learn when to use dashboards, how to visualize data with dashboards, and how to use PerformancePoint and Power View to create dashboards.
Chapter 11, Power BI, explains how predesigned reports and dashboards are good for business users, but power users require more flexibility. Power BI is a new self-service BI tool. In this chapter, you will learn about Power Query as a self-service ETL tool and Power Map as a 3D geospatial data visualization tool.
Chapter 12, Integrating Reports in Applications, begins with the premise that reports and dashboards are always required in custom applications. This chapter explains different ways to integrate SSRS reports and other dashboards into C# or VB.NET applications in web or Metro applications to provide reports on the application side for the users.
What you need for this book
This book will explain the features of Microsoft SQL Server 2014 Enterprise Edition. However, you can also download and install MS SQL Server 2014 Evaluation Edition, which has the same functionalities but is free for the first 180 days, from the following link:
http://technet.microsoft.com/en-US/evalcenter/dn205290.aspx
There are many examples in this book and all of the examples use the following databases as a source:
AdventureWorks2012 AdventureWorksDW2012 AdventureWorksLT2012
You can download the database files from the following link:
http://msftdbprodsamples.codeplex.com/releases/view/55330
CREATE DATABASE AdventureWorksDW2012 ON (FILENAME = '<drive>:\
<file path>\AdventureWorksDW2012_Data.mdf') FOR ATTACH_REBUILD_LOG ;
CREATE DATABASE AdventureWorksLT2012 ON (FILENAME = '<drive>:\
<file path>\AdventureWorksLT2012_Data.mdf') FOR ATTACH_REBUILD_LOG ;
Who this book is for
This book is very useful for BI professionals (consultants, architects, and developers) who want to become familiar with Microsoft BI tools. It will also be handy for BI program managers and directors who want to analyze and evaluate Microsoft tools for BI system implementation.
Conventions
In this book, you will find several headings that appear frequently.
To give clear instructions on how to complete a procedure or task, we use:
Time for action – heading
1.
Action 12.
Action 23.
Action 3Instructions often need some extra explanation so that they make sense, so they are followed with:
What just happened?
A block of code is set as follows:
SELECT [<axis_specification>
[, <axis_specification>...]] FROM [<cube_specification>] [WHERE [<slicer_specification>]]
Newterms and importantwords are shown in bold. Words that you see on the screen, in menus or dialog boxes for example, appear in the text like this: "On the Select
DestinationLocation screen, click on Next to accept the default destination."
Warnings or important notes appear in a box like this.
Tips and tricks appear like this.
Reader feedback
Feedback from our readers is always welcome. Let us know what you think about this book—what you liked or may have disliked. Reader feedback is important for us to develop titles that you really get the most out of.
To send us general feedback, simply send an e-mail to [email protected], and
mention the book title through the subject of your message.
If there is a topic that you have expertise in and you are interested in either writing or contributing to a book, see our author guide on www.packtpub.com/authors.
Customer support
Now that you are the proud owner of a Packt book, we have a number of things to help you to get the most from your purchase.
Downloading color versions of the images for this book
For your convenience we have also provided a PDF that contains higher resolution color versions of the images used in this book. These can be extremely useful as you work through various stages of the project when working with materials or examining small detail changes as we tweak individual parameters. You can download the PDF from https://www.
packtpub.com/sites/default/files/downloads/8888EN_ColoredImages.pdf.
Errata
Although we have taken every care to ensure the accuracy of our content, mistakes do happen. If you find a mistake in one of our books—maybe a mistake in the text or the code—we would be grateful if you would report this to us. By doing so, you can save other readers from frustration and help us improve subsequent versions of this book. If you find any errata, please report them by visiting http://www.packtpub.com/submit-errata,
selecting your book, clicking on the erratasubmissionform link, and entering the details of your errata. Once your errata are verified, your submission will be accepted and the errata will be uploaded to our website, or added to any list of existing errata, under the Errata section of that title.
Piracy
Piracy of copyright material on the Internet is an ongoing problem across all media. At Packt, we take the protection of our copyright and licenses very seriously. If you come across any illegal copies of our works, in any form, on the Internet, please provide us with the location address or website name immediately so that we can pursue a remedy.
Please contact us at [email protected] with a link to the suspected pirated material.
We appreciate your help in protecting our authors, and our ability to bring you valuable content.
Questions
You can contact us at [email protected] if you are having a problem with any
1
Data Warehouse Design
Nowadays, Business Intelligence (BI) is one of the hot topics in most of the job markets around the world. Most companies are establishing or planning to establish a Business Intelligence system and a data warehouse (DW). Knowledge
related to the BI and data warehouse are in great demand in the job market. This chapter gives you an understanding of what Business Intelligence and data warehouse is, what the main components of the BI system are, and what the steps to create the data warehouse are.
This chapter focuses on the designing of the data warehouse, which is the core of a BI system. The following chapters are about other BI components such as visualization, data integration, data governance, and so on. A data warehouse is a database designed for analysis, and this definition indicates that designing a data warehouse is different from modeling a transactional database. Designing the data warehouse is also called dimensional modeling. In this chapter, you will learn about the concepts of dimensional modeling.
Understanding Business Intelligence
Based on Gartner's definition (http://www.gartner.com/it-glossary/business -intelligence-bi/), Business Intelligence is defined as follows:
As the definition states, the main purpose of a BI system is to help decision makers to make proper decisions based on the results of data analysis provided by the BI system. Nowadays, there are many operational systems in each industry. Businesses use multiple operational systems to simplify, standardize, and automate their everyday jobs and requirements. Each of these systems may have their own database, some of which may work with SQL Server, some with Oracle. Some of the legacy systems may work with legacy databases or even file operations. There are also systems that work through the Web via web services and XML. Operational systems are very useful in helping with day-to-day business operations such as the process of hiring a person in the human resources department, and sale operations through a retail store and handling financial transactions.
The rising number of operational systems also adds another requirement, which is the integration of systems together. Business owners and decision makers not only need integrated data but also require an analysis of the integrated data. As an example, it is a common requirement for the decision makers of an organization to compare their hiring rate with the level of service provided by a business and the customer satisfaction based on that level of service. As you can see, this requirement deals with multiple operational systems such as CRM and human resources. The requirement might also need some data from sales and inventory if the decision makers want to bring sales and inventory factors into their decisions. As a supermarket owner or decision maker, it would be very important to understand what products in which branches were in higher demand. This kind of information helps you to provide enough products to cover demand, and you may even think about creating another branch in some regions.
The requirement of integrating multiple operational systems together in order to create consolidated reports and dashboards that help decision makers to make a proper decision is the main directive for Business Intelligence.
The architecture and components of a BI system
After understanding what the BI system is, it's time to discover more about its components and understand how these components work with each other. There are also some BI tools that help to implement one or more components. The following diagram shows an illustration of the architecture and main components of the Business Intelligence system:
Sales
The BI architecture and components differ based on the tools, environment, and so on. The architecture shown in the preceding diagram contains components that are common in most of the BI systems. In the following sections, you will learn more about each component.
The data warehouse
Extract Transform Load
It is very likely that more than one system acts as the source of data required for the BI system. So there is a requirement for data consolidation that extracts data from different sources and transforms it into the shape that fits into the data warehouse, and finally, loads it into the data warehouse; this process is called Extract Transform Load (ETL). There are many challenges in the ETL process, out of which some will be revealed (conceptually) later in this chapter. According to the definition of states, ETL is not just a data integration phase. Let's discover more about it with an example; in an operational sales database, you may have dozen of tables that provide sale transactional data. When you design that sales data into your data warehouse, you can denormalize it and build one or two tables for it. So, the ETL process should extract data from the sales database and transform it (combine, match, and so on) to fit it into the model of data warehouse tables.
There are some ETL tools in the market that perform the extract, transform, and load operations. The Microsoft solution for ETL is SQL Server Integration Service (SSIS), which is one of the best ETL tools in the market. SSIS can connect to multiple data sources such as Oracle, DB2, Text Files, XML, Web services, SQL Server, and so on. SSIS also has many built-in transformations to transform the data as required. Chapter 4, ETL with Integration Services, is about SSIS and how to do data transformations with this tool.
Data model – BISM
A data warehouse is designed to be the source of analysis and reports, so it works much faster than operational systems for producing reports. However, a DW is not that fast to cover all requirements because it is still a relational database, and databases have many constraints that reduce the response time of a query. The requirement for faster processing and a lower response time on one hand, and aggregated information on another hand causes the creation of another layer in BI systems. This layer, which we call the data model, contains a file-based or memory-based model of the data for producing very quick responses to reports.
Hat
In the preceding diagram, the illustrated cube has three dimensions: Product, Customer, and Time. Each cell in the cube shows a junction of these three dimensions. For example, if we store the sales amount in each cell, then the green cell shows that Devin paid 23$ for a Hat on June 5. Aggregated data can be fetched easily as well within the cube structure. For example, the orange set of cells shows how much Mark paid on June 1 for all products. As you can see, the cube structure makes it easier and faster to access the required information.
Microsoft SQL Server Analysis Services 2012 comes with two different types of modeling: multidimensional and tabular. Multidimensional modeling is based on the OLAP cube and is fitted with measures and dimensions, as you can see in the preceding diagram. The tabular model is based on a new In-memory engine for tables. The In-memory engine loads all data rows from tables into the memory and responds to queries directly from the memory. This is very fast in terms of the response time. You will learn more about SSAS Multidimensional in
Data visualization
The frontend of a BI system is data visualization. In other words, data visualization is a part of the BI system that users can see. There are different methods for visualizing information, such as strategic and tactical dashboards, Key Performance Indicators (KPIs), and detailed or consolidated reports. As you probably know, there are many reporting and visualizing tools on the market.
Microsoft has provided a set of visualization tools to cover dashboards, KPIs, scorecards, and reports required in a BI application. PerformancePoint, as part of Microsoft SharePoint, is a dashboard tool that performs best when connected to SSAS Multidimensional OLAP cube. You will learn about PerformancePoint in Chapter 10, Dashboard Design. Microsoft's
SQL Server Reporting Services (SSRS) is a great reporting tool for creating detailed and consolidated reports. SSRS is a mature technology in this area, which will be revealed in
Chapter 9, Reporting Services. Excel is also a great slicing and dicing tool especially for power users. There are also components in Excel such as Power View, which are designed to build performance dashboards. You will learn more about Power View in Chapter 9, Reporting Services, and about Power BI features of Excel 2013 in Chapter 11, Power BI. Sometimes, you will need to embed reports and dashboards in your custom written application.
Chapter 12, Integrating Reports in Application, of this book explains that in detail.
Master Data Management
Every organization has a part of its business that is common between different systems. That part of the data in the business can be managed and maintained as master data. For example, an organization may receive customer information from an online web application form or from a retail store's spreadsheets, or based on a web service provided by other vendors.
Master Data Management (MDM) is the process of maintaining the single version of truth for master data entities through multiple systems. Microsoft's solution for MDM is Master Data Services (MDS). Master data can be stored in the MDS entities and it can be maintained and changed through the MDS Web UI or Excel UI. Other systems such as CRM, AX, and even DW can be subscribers of the master data entities. Even if one or more systems are able to change the master data, they can write back their changes into MDS through the staging architecture. You will learn more about MDS in Chapter 5, Master Data Management.
Data Quality Services
As a solution to improve the quality of data, Microsoft provided users with DQS. DQS
works based on Knowledge Base domains, which means a Knowledge Base can be created for different domains, and the Knowledge Base will be maintained and improved by a data steward as time passes. There are also matching policies that can be used to apply standardization on the data. You will learn more about DQS in Chapter 6, Data Quality and Data Cleansing.
Building the data warehouse
A data warehouse is a database built for analysis and reporting. In other words, a data warehouse is a database in which the only data entry point is through ETL, and its primary purpose is to cover reporting and data analysis requirements. This definition clarifies that a data warehouse is not like other transactional databases that operational systems write data into. When there is no operational system that works directly with a data warehouse, and when the main purpose of this database is for reporting, then the design of the data warehouse will be different from that of transactional databases.
If you recall from the database normalization concepts, the main purpose of normalization is to reduce the redundancy and dependency. The following table shows customers' data with their geographical information:
Customer first
name Last name Suburb City State Country
Devin Batler Remuera Auckland Auckland New Zealand
Peter Blade Remuera Auckland Auckland New Zealand
Lance Martin City Center Sydney NSW Australia
Let's elaborate on this example. As you can see from the preceding list, the geographical information in the records is redundant. This redundancy makes it difficult to apply changes. For example, in the structure, if Remuera, for any reason, is no longer part of the Auckland
So, a normalized approach is to retrieve the geographical information from the customer table and put it into another table. Then, only a key to that table would be pointed from the customer table. In this way, every time the value Remuera changes, only one record in the geographical region changes and the key number remains unchanged. So, you can see that normalization is highly efficient in transactional systems.
This normalization approach is not that effective on analytical databases. If you consider a sales database with many tables related to each other and normalized at least up to the third normalized form (3NF), then analytical queries on such databases may require more than 10 join conditions, which slows down the query response. In other words, from the point of view of reporting, it would be better to denormalize data and flatten it in order to make it easier to query data as much as possible. This means the first design in the preceding table might be better for reporting.
However, the query and reporting requirements are not that simple, and the business domains in the database are not as small as two or three tables. So real-world problems can be solved with a special design method for the data warehouse called dimensional modeling. There are two well-known methods for designing the data warehouse: the Kimball and Inmon methodologies.
The Inmon and Kimball methods are named after the owners of these methodologies. Both of these methods are in use nowadays. The main difference between these methods is that Inmon is top-down and Kimball is bottom-up. In this chapter, we will explain the Kimball method. You can read more about the Inmon methodology in Building the Data Warehouse, William H. Inmon, Wiley (http://www.amazon.com/Building -Data-Warehouse-W-Inmon/dp/0764599445), and about the Kimball methodology in
The Data Warehouse Toolkit, Ralph Kimball, Wiley (http://www.amazon.com/The -Data-Warehouse-Toolkit-Dimensional/dp/0471200247). Both of these books
are must-read books for BI and DW professionals and are reference books that are recommended to be on the bookshelf of all BI teams. This chapter is referenced from
The Data Warehouse Toolkit, so for a detailed discussion, read the referenced book.
Dimensional modeling
Fact or measure
Facts are numeric and additive values in the business process. For example, in the sales business, a fact can be a sales amount, discount amount, or quantity of items sold. All of these measures or facts are numeric values and they are additive. Additive means that you can add values of some records together and it provides a meaning. For example, adding the sales amount for all records is the grand total of sales.
Dimension
Dimension tables are tables that contain descriptive information. Descriptive information, for example, can be a customer's name, job title, company, and even geographical information of where the customer lives. Each dimension table contains a list of columns, and the columns of the dimension table are called attributes. Each attribute contains some descriptive information, and attributes that are related to each other will be placed in a dimension. For example, the customer dimension would contain the attributes listed earlier.
Each dimension has a primary key, which is called the surrogate key. The surrogate key is usually an auto increment integer value. The primary key of the source system will be stored in the dimension table as the business key.
The Fact table
The Fact table is a table that contains a list of related facts and measures with foreign keys pointing to surrogate keys of the dimension tables. Fact tables usually store a large number of records, and most of the data warehouse space is filled by them (around 80 percent).
Grain
The star schema
There are two different schemas for creating a relationship between fact and dimensions: the snow flake and star schema. In the start schema, a Fact table will be at the center as a hub, and dimensions will be connected to the fact through a single-level relationship. There won't be (ideally) a dimension that relates to the fact through another dimension. The following diagram shows the different schemas:
The snow flake schema, as you can see in the preceding diagram, contains relationships of some dimensions through intermediate dimensions to the Fact table. If you look more carefully at the snow flake schema, you may find it more similar to the normalized form, and the truth is that a fully snow flaked design of the fact and dimensions will be in the 3NF. The snow flake schema requires more joins to respond to an analytical query, so it would respond slower. Hence, the star schema is the preferred design for the data warehouse. It is obvious that you cannot build a complete star schema and sometimes you will be required to do a level of snow flaking. However, the best practice is to always avoid snow flaking as much as possible.
An example of Internet sales
Assume that you want to build a data warehouse for the sales part of a business that contains a chain of supermarkets; each supermarket sells a list of products to customers, and the transactional data is stored in an operational system. Our mission is to build a data warehouse that is able to analyze the sales information.
Before thinking about the design of the data warehouse, the very first question is what is the goal of designing a data warehouse? What kind of analytical reports would be required as the result of the BI system? The answer to these questions is the first and also the most important step. This step not only clarifies the scope of the work but also provides you with the clue about the Grain.
Defining the goal can also be called requirement analysis. Your job as a data warehouse designer is to analyze required reports, KPIs, and dashboards. Let's assume that the decision maker of a particular supermarket chain wants to have analytical reports such as the comparison of sales between stores, or the top 10 customers and/or top 10 bestselling products, or he wants to compare the sale on weekdays with weekends.
After requirement analysis, the dimensional modeling phases will start. Based on Kimball's best practices, dimensional modeling can be done in the following four steps:
1. Choosing the business process. 2. Identifying the Grain.
3. Designing dimension.s 4. Designing facts.
In our example, there is only one business process, that is, sales. Grain, as we've described earlier, is the level of detail that will be stored in the Fact table. Based on the requirement, Grain is to have one record per sales transaction and date, per customer, per product, and per store.
Once Grain is defined, it is easy to identify dimensions. Based on the Grain, the dimensions would be date, store, customer, and product. It is useful to name dimensions with a Dim
prefix to identify them easily in the list of tables. So our dimensions will be DimCustomer, DimProduct, DimDate, and DimStore. The next step is to identify the Fact table, which
would be a single Fact table named FactSales. This table will store the defined Grain.
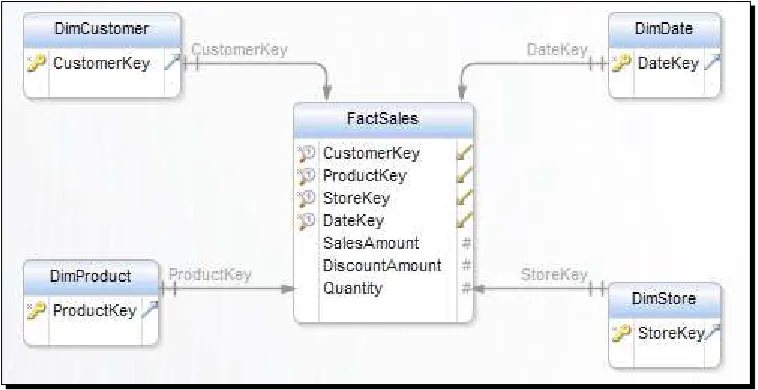
FactSales
There is only one Grain for this business process, and this means that one Fact table would be required. Based on the provided Grain, a Fact table would be connected to DimCustomer,
DimDate, DimProduct, and DimStore. To connect to each dimension, there would be a foreign key in the Fact table that points to the primary key of the dimension table.
The table would also contain measures or facts. For the sales business process, facts that can be measured (numeric and additive) are SalesAmount, DiscountAmount, and QuantitySold. The Fact table would only contain relationships to other dimensions and measures. The following diagram shows some columns of the FactSales:
As you can see, the preceding diagram shows a star schema. We will go through the dimensions in the next step to explore them more in detail. Fact tables usually don't have too many columns because the number of measures and related tables won't be that much. However, Fact tables will contain many records. The Fact table in our example will store one record per transaction.
If you are thinking about adding comments in this made by a sales person to the sales transaction as another column of the Fact table, first think about the analysis that you want to do based on comments. No one does analysis based on a free text field; if you wish to do an analysis on a free text, you can categorize the text values through the ETL process and build another dimension for that. Then, add the foreign key-primary key relationship between that dimension to the Fact table.
The customer dimension
The customer's information, such as the customer name, customer job, customer city, and so on, will be stored in this dimension. You may think that the customer city is, as another dimension, a Geo dimension. But the important note is that our goal in dimensional modeling is not normalization. So resist against your tendency to normalize tables. For a data warehouse, it would be much better if we store more customer-related attributes in the customer dimension itself rather than designing a snow flake schema. The following diagram shows sample columns of the DimCustomer table:
The DimCustomer dimension may contain many more attributes. The number of attributes
You can also see two keys for this dimension: CustomerKey and CustomerAlternateKey. The CustomerKey is the surrogate key and primary key for the dimension in the data warehouse. The CustomerKey is an integer field, which is autoincremented. It is important that the surrogate key won't be encoded or taken as a string key; if there is something coded somewhere, then it should be decoded and stored into the relevant attributes. The surrogate key should be different from the primary key of the table in the source system. There are multiple reasons for that; for example, sometimes, operational systems recycle their primary keys, which means they reuse a key value for a customer that is no longer in use to a new customer.
CustomerAlternateKey is the primary key of the source system. It is important to keep the primary key of the source system stored in the dimension because it would be necessary to identify changes from the source table and apply them into the dimension. The primary key of the source system will be called the business key or alternate key.
DimDate
The date dimension is one of the dimensions that you will find in most of the business processes. There may be rare situations where you work with a Fact table that doesn't store date-related information. DimDate contains many generic columns such as FullDate, Month, Year, Quarter, and MonthName. This is obvious as you can fetch all other columns out of the full date column with some date functions, but that will add extra time for processing. So, at the time of designing dimensions, don't think about spaces and add as many attributes as required. The following diagram shows sample columns of the date dimension:
The date dimension will have a record for each date. The table, shown in the following screenshot, shows sample records of the date dimension:
As you can see in the records illustrated in the preceding screenshot, the surrogate of the date dimension (DateKey) shows a meaningful value. This is one of the rare exceptions
where we can keep the surrogate key of this dimension as an integer type but with the format of YYYYMMDD to represent a meaning as well.
In this example, if we store time information, where do you think would be the place for time attributes? Inside the date dimension? Definitely not. The date dimension will store one record per day, so a date dimension will have 365 records per year and 3650 records for 10 years. Now, we add time splits to this, down to the last minute, and then we would require 24*60 records per day. So, the combination of the date and time for 10 years would have 3650*24*60= 5265000 records. However, 5 million records for a single dimension are too much; dimensions are usually narrow and they occasionally might have more than one million records. So in this case, the best practice would be to add another dimension as
DimTime and add all time-related attributes in that dimension. The following screenshot
Usually, the date and time dimensions are generic and static, so you won't be required to populate these dimensions through ETL every night; you just load them once and then you could use them. I've written two general-purpose scripts to create and populate date and time dimensions on my blog that you can use. For the date dimension, visit the
http://www.rad.pasfu.com/index.php?/archives/95-Script-for-Creating -and-Generating-members-for-Date-Dimensions-General-Purpose.html
URL, and for the time dimension, visit the http://www.rad.pasfu.com/index.php?/ archives/122-Script-for-Creating-and-Generating-members-for-Time -Dimension.html URL.
DimProduct
The product dimension will have a ProductKey, which is the surrogate key, and the
business key, which will be the primary key of the product in the source system (something similar to a product's unique number). The product dimension will also have information about the product categories. Again, denormalization in dimensions occurred in this case for the product subcategory, and the category will be placed into the product dimension with redundant values. However, this decision was made in order to avoid snow flaking and raise the performance of the join between the fact and dimensions.
DimStore
We are not going to go in detail through the attributes of the store dimension. The most important part of this dimension is that it can have a relationship to the date dimension. For example, a store's opening date will be a key related to the date dimension. This type of snow flaking is unavoidable because you cannot copy all the date dimension's attributes in every other dimension that relates to it. On the other hand, the date dimension is in use with many other dimensions and facts. So, it would be better to have a conformed date dimension. Outrigger is a Kimball terminology for dimensions, such as date, which is
conformed and might be used for a many-to-one relationship between dimensions for just one layer.
Types of facts
In the previous example, you learned about transactional fact. Transactional fact is a fact table that has one record per transaction. This type of fact table usually has the most detailed Grain.
Transactional facts are a good source for detailed and atomic reports. They are also good for aggregations and dashboards. The Snapshot Fact tables provide a very fast response for dashboards and aggregated queries, but they don't cover detailed transactional records. Based on your requirement analysis, you can create both kinds of facts or only one of them. There is also another type of Fact table called the accumulating Fact table. This Fact table is useful for storing processes and activities, such as order management. You can read more about different types of Fact tables in The Data Warehouse Toolkit, Ralph Kimball, Wiley
(which was referenced earlier in this chapter).
The Factless Fact table – The Bridge table
We've explained that Fact tables usually contain FKs of dimensions and some measures. However, there are times when you would require a Fact table without any measure. These types of Fact tables are usually used to show the non-existence of a fact.
For example, assume that the sales business process does promotions as well, and you have a promotion dimension. So, each entry in the Fact table shows that a customer X purchased a product Y at a date Z from a store S when the promotion P was on (such as the new year's sales). This Fact table covers every requirement that queries the information about the sales that happened, or in other words, for transactions that happened. However, there are times when the promotion is on but no transaction happens! This is a valuable analytical report for the decision maker because they would understand the situation and investigate to find out what was wrong with that promotion that doesn't cause sales.
So, this is an example of a requirement that the existing Fact table with the sales amount and other measures doesn't fulfill. We would need a Fact table that shows that store S did the promotion P on the date D for product X. This Fact table doesn't have any fact or measure related to it; it just has FKs for dimensions. However, it is very informative because it tells us on which dates there was a promotion at specific stores on specific products. We call this Fact table as a Factless Fact table or Bridge table.
Types of dimensions
Using examples, we've explored the usual dimensions such as customer and date. When a dimension participates in more than one business process and deals with different data marts (such as date), then it will be called a conformed dimension.
There are other types of dimensions with some differences, such as junk dimension and degenerate dimension. The junk dimension will be used for dimensions with very narrow member values (records) that will be in use for almost one data mart (not conformed). For example, the status dimensions can be good candidates for junk dimension. If you create a status dimension for each situation in each data mart, then you will probably have more than ten status dimensions with only less than five records in each. The junk dimension is a solution to combine such narrow dimensions together and create a bigger dimension.
You may or may not use a junk dimension in your data mart because using junk dimensions reduces readability, and not using it will increase the number of narrow dimensions. So, the usage of this is based on the requirement analysis phase and the dimensional modeling of the star schema.
A degenerate dimension is another type of dimension, which is not a separate dimension table. In other words, a degenerate dimension doesn't have a table and it sits directly inside the Fact table. Assume that you want to store the transaction number (string value). Where do you think would be the best place to add that information? You may think that you would create another dimension and enter the transaction number there and assign a surrogate key and use that surrogate key in the Fact table. This is not an ideal solution because that dimension will have exactly the same Grain as your Fact table, and this indicates that the number of records for your sales transaction dimension will be equal to the Fact table, so you will have a very deep dimension table, which is not recommended. On the other hand, you cannot think about another attribute for that dimension because all attributes related to the sales transaction already exist in other dimensions connected to the fact. So, instead of creating a dimension with the same Grain as the fact and with only one column, we would leave that column (even if it is a string) inside the Fact table. This type of dimension will be called a degenerate dimension.
Slowly Changing Dimension
Now that you understand dimensions, it is a good time to go into more detail about the most challengeable concepts of data warehousing, which is slowly changing dimension (SCD). The dimension's attribute values may change depending on the requirement. You will do different actions to respond to that change. As the changes in the dimension's attribute values happen occasionally, this called the slowly changing dimension. SCD depends on the action to be taken after the change is split in different types. In this section, we only discuss type 0, 1, and 2.
SCD type 0
SCD type 1
Sometimes, a value may be typed wrongly in the source system, such as the first name, and it is likely that someone will come and fix that with a change. In such cases, we will accept the change, and we won't need to keep historical information (the previous name). So we simply replace the existing value with a new value. This type of SCD is called type 1. The following screenshot shows how type 1 works:
SCD type 2
In this type, it is a common requirement to maintain historical changes. For example, consider this situation; a customer recently changes their city from Seattle to Charlotte. You cannot use type 0 because it is likely that someone will change their city of living. If you behave like type 1 and update the existing record, then you will miss the information of the customer's purchase at the time that they were in Seattle, and all entries will show that they are customers from Charlotte. So the requirement for keeping the historical version resulted in the third type of SCD, which is type 2.
Type 2 is about maintaining historical changes. The way to keep historical changes is through a couple of metadata columns: FromDate and ToDate. Each new customer will be imported
into DimCustomer with FromDate as a start date, and the ToDate will be left as null (or a
big default value such as 29,990,101). If a change happens in the city, the existing records in
ToDate will be marked as the date of change, and a new record will be created as an exact
copy of the previous record with the new city and with a new FromDate, which will be the
date of change, and the ToDate field will be left as null. Using this solution to find the latest
and most up-to-date member information, you just need to look for the member record with
ToDate as null. To fetch the historical information, you would need to search for it in the
There are other types of SCD that are based on combinations of the first three types and cover other kinds of requirements. You can read more about the different types of SCD and methods of implementing them in The Data Warehouse Toolkit referenced earlier in this chapter.
Summary
In this chapter, you learned what Business Intelligence is and what its components are. You studied the requirement for BI systems, and you saw the solution architecture to solve the requirements. Then, you read about data warehousing and the terminologies in dimensional modeling.
If you come from a DBA or database developer background and are familiar with database normalization, then you will know that in dimensional modeling, you should avoid normalization in some parts and you would need to design a star schema. You've learned that the Fact table shows numeric and additive values, and descriptive information will be stored in dimensions. You've learned different types of facts such as transactional, snapshot, and accumulating, and also learned about different types of dimensions such as outriggers, role playing, and degenerate.
2
SQL Server Analysis Services
Multidimensional Cube Development
In the previous chapter, you learned how to design a data warehouse. In this chapter, you will learn how to create an OnLine Analytical Processing(OLAP)
cube with the help of Microsoft SQL Server Analysis Services(SSAS) from an existing data warehouse. OLAP means loading data from a data warehouse into a file structure that makes it much faster to access measures in different granular levels. OLAP cubes also provide much better navigation through hierarchical structures, and slicing and dicing becomes much easier.
In this chapter, you will understand how to develop SSAS cubes and how to create hierarchies and calculated measures. MDX, which is the query and calculation language of SSAS Multidimensional, will be introduced. You will also read about the deployment of OLAP cubes on the server and the processing of cubes to get data loaded into the OLAP structure. Creating an OLAP cube is an important step in a BI system because it will provide the just mentioned benefits.
Why is OLAP required?
As an example, assume that you want to create a report in a BI system for sales based on products and dates. You might need to get the sales amount per day, per month, or per year. You might also have categories of products. So, it will be helpful if you have a graph with two dimensions, Product as one dimension and Date as another dimension:
Date
August 2012
Product A
Product
Having two dimensions helps to achieve each granular point and each conjunction of both dimensions easier and faster. For example, point A shows the total sales amount of ProductA in August 2012. Each point in the preceding graph is a measure, and each line shows a dimension attribute.
Now, assume that the report needs another dimension, Store. Also, the Store dimension might have its own attributes and hierarchies as well, for example, types of stores and branches of stores. So, you will need a graph with three axes as shown in the following diagram:
Product Date
The structure shown in the previous diagram helps you to find the junction of the three dimensions in every granular level of the defined attributes. For example, the total sales amount of ProductA in August 2012 in a New Zealand store is a point of junction of three axes of each value represented together in the cube shown in the previous diagram. This structure is also called a cube. This is how the OLAP cube is named: the dimensions are axes of the cube and the measures are connection points of it.
In real-world requirements, you might need many more than three dimensions for some reports and analytics, so the real-world structure of cubes will have more than three dimensions, but they cannot be illustrated on paper so we cannot show you a sample of cube with eleven dimensions.
The OLAP tools are utilities that provide the ability to create an OLAP cube structure, and then data will be loaded into that structure. After loading data into that structure, which is called processing, information can be easily gathered from data by querying each point or conjunction of the cube axis.
Understanding the SQL Server Analysis Services engine
Microsoft SQL Server released Analysis Services in 2000 as an OLAP cube tool. This tool is a mature service of Microsoft technologies in BI that provides the ability to develop cubes and create dimensions and measures. Creating hierarchies (such as the product category hierarchy) based on attributes of dimensions are also possible within SSAS.
Microsoft introduced a new language named MDX to query the SSAS cube. This querying language has the ability to query cube-structured data and work with hierarchies. Also, many Microsoft-reporting and dashboard tools support this language.
Take a look at the following diagram:
Data
warehouse Processing data OLAP cube
SSDT
Deploy cube structure
Visualization
MDX
Analysis Services is an engine that runs SSAS databases on the server. After the deployment of an SSAS database (which contains cubes, dimensions, measures, security, and some other information that you will dig into in chapters related to data mining), the metadata and structure of cubes will reside on the SSAS server. Then, a processing step is required to load data from a data warehouse into the SSAS cube structure. This step usually runs on a schedule at the end of ETL processing after loading data into the data warehouse (we will talk about ETL in Chapter 4, ETL with Integration Services.
This process will take place when a client wants to get data from a cube. The client tool queries data from the SSAS cube using MDX queries. MDX queries will be compiled, parsed, and executed in the SSAS engine. Hence, some results in a multidimensional format will be returned to the client tools. Then, the reporting client tools, for example, SSAS, will show information to the user as the report and dashboard layout are formatted.
MDX queries will be resolved from the SSAS cube in the MOLAP storage mode. There are other storage modes for SSAS, which are ROLAP and HOLAP. ROLAP resolves queries directly from the source database, while HOLAP is a hybrid method. A detailed discussion on storage modes are outside the scope of this book. You can read more about them at http://msdn. microsoft.com/library/ms174915.aspx.
As the data entries will be stored in the cube, data security will be an important aspect. Fortunately, SSAS provides an extensive security mechanism that delivers role-based and row-level security on each cell of the cube, and security can be applied through the administration or development tools. You can read more about SSAS security at http:// technet.microsoft.com/en-us/library/ms174840.aspx.
Developing your first cube
When you install Microsoft SQL Server BI services such as Analysis Services, you can also install SQL Server Data Tools (SSDT). SSDT is a designer and developer tool for SSAS cubes. SSDT was formerly known as Business Intelligence Development Studio (BIDS) in SQL Server 2008R2 and earlier versions.
Time for action – creating an Analysis Services project
In this example and other examples of this book, we will use SSDT for Visual Studio 2012. You can download and install it from http://www.microsoft.com/en-us/download/ details.aspx?id=36843.
After installation, perform the following steps:
1.
Open SQL Server Data Tools by clicking on Start, then navigate to your MicrosoftSQL Server 2012 folder and under that, choose SQL Server Data Tools for Visual Studio 2012.