(IJSBAR)
I SSN 2 3 0 7 - 4 5 3 1
(Print & Online)
http://gssrr.org/index.php?journal=JournalOfBasicAndApplied
---
The Impact of Regional Expansion on Economic
Structure: A Case Study in Lampung Province, Indonesia
Teguh Endaryanto
a*, Muhammad Firdaus
b, Hermanto Siregar
c, Dedi Budiman
Hakim
da
Graduate School of Regional and Rural Development Planning Sciences, Bogor Agricultural University,
Bogor 16680, Indonesia
b,c,d Faculty of Economics and Management, Bogor Agricultural University, Indonesia
Abstract
Different potential economic sectors in the main district and expansion can occur because there are differences
in the characteristics and potential of each area. This research aimed to determine the economic structure in
main district and expansion, to analyze the impact of the expansion towards the potential economic sectors, and
to formulate the policy of potential economic sector development in post-expansion. Lampung Province,
Indonesia, was used as the case study, i.e. in Tanggamus and Tulang Bawang Districts. These districts have
expanded to Pringsewu, Mesuji, and West Tulang Bawang as the new autonomous regions. The method that
used in this research was quantitative descriptive approach with an analysis of Location Quotient, Shift-Share
Analysis, and Klassen Typology. The results showed that there were differences in the economic structure after
expansion in the District of Pringsewu with dominance in the tertiary sector/services, while the main District of
Tanggamus dominated in primary sector/agriculture. The District of Mesuji and West Tulang Bawang had
relatively similar in economic structure with the main district of Tulang Bawang. The development of potential
economic sectors prioritized in advanced sectors with high growth, considering the local and regional potential,
the quality of human resources, the distance location, regulation, roads infrastructure, and other supporting
facility and infrastructure.
Keywords: economic structure; Klassen Typology; location quotient; regional autonomy; shift-share analysis
---
* Corresponding author.
E-mail address: [email protected]
1.Introduction
Pringsewu District, Mesuji, and West Tulang Bawang are a New Autonomous Regions in Lampung Province,
Indonesia which are expanded from Tanggamus and Tulang Bawang Districts in 2008 under the Law Number
48, 49, and 50 year 2008. The fundamental reasons for expanding region are to improve the welfare of local
people, improving services, and shorten the control range (span of control) [1]. In early development, the
District of Pringsewu has recorded good economic performance with the pace of economic growth in 2010 and
2011 was 6,95% higher than the main district/Tanggamus that is 5,79%, but began to decline in 2012.
Otherwise, in the early development of Mesuji District and West Tulang Bawang, the economic performance is
lower than the main district of 5,92%, 5,89% compared to 6,19%. However, it’s began to increase in 2012 [2].
Mesuji District as DOB has achieved PDRB ADHK per capita in greater range of 6-7 million, compared with its
main district (Tulang Bawang) that only 5-6 million during the last 5 years (2009-2013). While the District of
West Tulang Bawang and Pringsewu still have a PDRB per capita lower than its main district.
The economic growth and PDRB per capita that higher than the main districts like Mesuji District, the economic
growth and PDRB per capita that lower than the main districts like the District of Pringsewu, and the lower
economic growth than the main district but PDRB per capita is higher than the main districts like the District of
West Tulang Bawang are interesting patterns of expansion effects to be studied. According to , the rate of
economic growth in the New Autonomous Regions (DOB) in 2001-2007 is lower than the economic growth in
the main district. The main district have levels of PDRB per capita better than the DOB, the poverty rate in
DOB region is relatively high (reached in 21,4% of total population) compared with the main region (16,7%).
The condition of DOB in the three expansion districts in the Province of Lampung is slightly different from the
results of Bappenas. The poverty rate in the District of Pringsewu, Mesuji, and Tulang Bawang during the
period of 2010-2013 showed decreasing trend that is from 12,45% to 9,8%, 8,65% to 5,81%, and 7,63% to
6,31%. This DOB poverty level is lower than the main district Tanggamus and Tulang Bawang which reached
as much as 15,24% and 8,04% in 2013. While the study results of Kuncoro [1] stated that the economy
condition which measured by PDRB per capita, poverty rate, and IPM during observation (1987-2007) in the
District of West Lombok, Bima, and Sumbawa become better after the expansion than before the expansion.
The increased of economic growth is an imperative requirement in order to reduce the unemployment and
poverty [4], but the terms must not enough. Adequacy requirement is to improve the quality of economic growth
in order to have a higher absorption of the workforce or labor and spread the benefits of growth more evenly so
can encourage the sustainable empowerment of the poor. According to Todaro [5], there are four key
dimensions of economic development, namely growth, poverty reduction, alteration or transformation of the
economy, and sustainable development from an agrarian society into an industrial society. Structural
transformation is a prerequisite of the improvement and sustainability of growth and poverty reduction, as well
as support for sustainable development itself. The process of structural change in the economy characterized by
declining share of the primary sector (agriculture), an increasing share of the secondary sector (industry), and
the share of the tertiary sector (services) which is also contributed to the increase in line with economic growth.
The economic growth of expansion district which is higher than the main district, chances formerly an area that
has evolved before the expansion or an area of largest contributor to the budget (APBD) for the district before
the expansion. The expansion district which the economic growth is lower than the main district likely before
the district is an area that is neglected in the development or potential areas is inadequate [6].
Some differences of potential economic sectors in DOB with main district can not be separated from the
differences in the characteristics and potential of each area. The impact of expanding region towards potential
economic sectors in main district and expansion is interesting to be studied further. Based on the report of
Kemendagri [7] about the Autonomous Regional Evaluation Results of Expansion (EDOHP), the District of
Pringsewu, Mesuji, and West Tulang Bawang belong to a low DOB categorized and increasing the
competitiveness of the region that is rated in 187, 161, and 166 of 198 DOB across Indonesia. Accordingly,
need to study the impact of the expansion towards the potential economic sectors in the main district and
expansion district, namely 1) how the economic structure of the main district and expansion? 2) analyze the
potential economic sectors that are competitive as a result of the impact of the expansion in the main district and
expansion; and 3) how the formulation of policy for the development of a potential economic sectors for the
main district and expansion in post-expansion?
2.Materials and Methods
The research analyzes the potential economic sector conducted in the District of Tanggamus, Tulang Bawang as
a main district and Pringsewu District, Mesuji, as well as the district of West Tulang Bawang as an expansion
district. The definition of main district (KI) in this study was a new autonomous district either one or more
districts, while the district of expansion (KP) was a newly district which is fomed from the district of expansion
or often referred to as the new autonomous regions (DOB). Pringsewu District was the expansion district (KP)
of Tanggamus district, while the District of Mesuji and West Tulang Bawang were a KP of Tulang Bawang
District.
The methods of analysis in this research used a quantitative descriptive analysis approach. The analysis of the
region's comparative advantage (Location Quotient Analysis) used to indicate the location of concentration/base
[8]; [9]; [10] applied the traditional model for combining trade through the disaggregation of the components of
growth and industry mix components. Economic Base Analysis (LQ) aimed to determine whether a sector has
been able to meet the needs of the area itself (subsistence), less or even more/surplus. Sectors which is surplus
said to be a sector base and has the export potential [11]. Analysis of Regional Competitive Advantage
(Shift-Share Analysis) used to describe the performance of an activity in a sub-region and compared with the
performance in the total area. To see the position of the sector in the category of developed (advanced) or
underdeveloped and have a rapid or slow growth used Klassen Typology [12], with four categories, namely: 1)
an advanced sector and grow rapidly, 2) an advanced sector but oppressed, 3) a potential sector or can still
develop rapidly, and 4) a relatively underdeveloped sector.
The main data used were secondary data of Gross Regional Domestic Product (PDRB) at current prices
(ADHB) and PDRB at constant prices (ADHK) of five districts, namely Tanggamus, Tulang Bawang,
Pringsewu, Mesuji, and West Tulang Bawang in period of 2004-2013.
Supporting data used including population, land area, the potential of the district, the amount of labor
absorption, the center distance of the capital, infrastructure originating from the publication of the Central
Statistics Agency (BPS) as District In Figures, Lampung in Figures, Regional Economic Outlook in Lampung
Province published in the period of 2012-2014, and some other data sourced from several publications issued by
various agencies relevant to this study.
3.Results and Discussion
3.1 The Overview of Economic Performance
Until the year 2013, the economy of Lampung is still dominated by four (4) sectors of economic activities
namely agriculture, trade/hotels/restaurants, manufacturing and transport/ communications. The economic
structure of the region is reflected in the PDRB level of contribution of each economic sector to the total of
PDRB. By knowing the economic structure of the region, the economic development efforts can be directed in
accordance with the aspirations of the people and the potential of the region [13].
The District of Tanggamus and Tulang Bawang are the district contributor of 60 percent contribution in
agricultural sector (6-8 percent) in the province of Lampung besides the District of Central Lampung, South
Lampung, and East Lampung since before the expansion to the year of 2013. The contributions of agriculture
sector in Tanggamus and Tulang Bawang District in post-expansion in 2008 are getting smaller because
partially of agricultural land is divided into expansion territory. For the other sectors (manufacturing,
trade/hotels/restaurants, and transport/communication) are dominated by the District of Central Lampung, South
Lampung, North Lampung, Tulang Bawang, and Bandar Lampung.
Pringsewu district, Mesuji, and West Tulang Bawang as the DOB of young age, are still not able to provide a
large contribution to the dominant sectors in the Province of Lampung as well as the District of Central
Lampung, South Lampung, East Lampung, Tulang Bawang, Bandar Lampung, and Tanggamus. However, the
development of economic performance of DOB is quite well with the rate of average economic growth of the
last 4 years (2010-2013) still above 5,75 percent.
In the period of 2004-2008, before the expansion, in the District of Tanggamus only agricultural sector that
showed the trend of the development of the sector's contribution to PDRB which has increased from 48,05% to
57,8%, eight other sectors tend to decline. While in the District of Tulang Bawang in addition to the agricultural
sector which has increased the development trend from 42,74% to 45,05%, mining and quarrying and transport
and communications sector also showed a trend increase in the contribution of the sector to PDRB. In the
post-expansion period of 2009-2013, the agricultural sector in Tanggamus District had a decreased contribution to
PDRB from 57,96% to 51,31%. One reason for the declining contribution of the agricultural sector in the
District of Tanggamus allegedly is the expansion of Pringsewu District in 2008. From the total area of 284.175
ha of agricultural land previously with details of 39.979 ha were paddy fields and as much as 244.196 ha of
non-paddy fields were reduced by 10.843 ha of non-paddy fields and 37.919 ha of non-non-paddy fields or approximately
17,16 percent of agricultural land reduced in Tanggamus District (data source from PODES 2008) including a
reduction of human resources (population) of 41 percent.
In Tulang Bawang District, the contribution of the agricultural sector after the expansion continued to show an
upward trend from 41,79% to 49,48%. However, eight other sectors had a decrease contribution to PDRB. The
development sector of the business field in the main district and expansion in the year of 2009-2013 can be seen
in Table 1. In the Post-expansion, the District of West Tulang Bawang as DOB had a development trend of
increased agricultural sector (46,47% to 49,28%) which is directly proportional to its main district, with the
contribution of the largest contributor in the food crops sub-sector, followed by livestock sub-sector and its
results (West Tulang Bawang), the fisheries sub-sector (Tulang Bawang), and the plantation crops sub-sector.
The increase also occurred in the secondary sector (construction) and tertiary sector (trade, hotels and
restaurants; transport and communications) with dominated by wholesale sub-sector and retail trade and
transportation sub-sectors. Meanwhile, the development trend of the contribution of the agricultural sector in
Mesuji District as a result of expansion DOB Tulang Bawang even more decreased (49,28% to 46,34). The
sectors that experienced a trend of increasing contributions were the construction sector, trade, hotels and
restaurants with dominated by wholesale sub-sector and retail trade; services sector. The contribution of the
agricultural sector was still dominant in the District of Pringsewu about 37 percent, but the development trend of
the contribution of post-expansion in the year of 2009-2013 showed a downward trend.
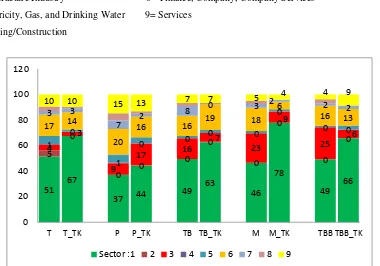
Figure 1 and Table 2 showed that the agricultural sector was still the dominant sector in absorb the labor and
labor sector basis. In the District of Mesuji, although the last five years (2009-2013) the contribution of the
agricultural sector continued to decline, but the absorption of the agricultural sector to the labor reached in the
amount of 78 percent. Inversely proportional to the secondary and tertiary sectors, while the contribution of the
sector was high, the absorption of labor (TK) was low. This condition occured in almost all districts, except for
the trade sector, hotels, and restaurants (16% with the data absorption of TK 19%) in Tulang Bawang and
manufacture industry (9% with the data absorption of TK 17%) in the District of Pringsewu. This condition
indicates that the secondary and tertiary sectors in the district was not labor intensive but capital intensive.
However, according to Jula and Jula [14], the structural changes of labor in agriculture sector, mining and
quarrying, electricity, gas, and water were not caused by structural changes of labor in secondary and tertiary
sectors and the structural changes of labor in the secondary and tertiary sectors were not caused by the structural
changes of labor in the primary sector.Structural change generally had a positive effect on labour productivity
during these years, although it appears to be basically dominated by the effects within productivity growth [15].
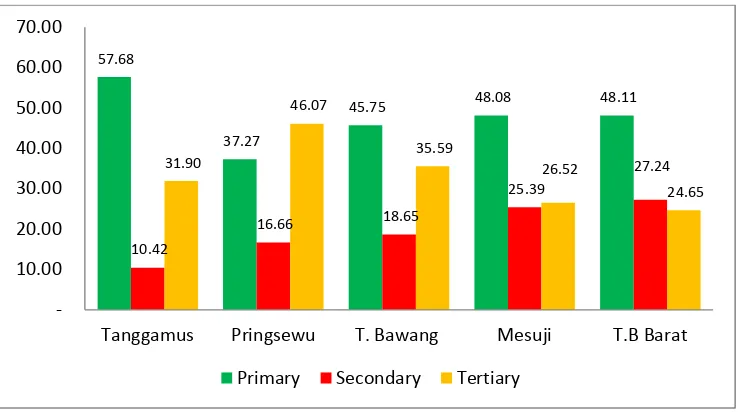
To view the economic structure of main district and expansion more simply, sectors that contribute to the PDRB
during five years averaged and divided into 3 sectors, namely primary sector, secondary, and tertiary as shown
in Figure 2. Based on Figure 2, it can be seen that the economic structure of main district and expansion
dominated by the primary sector (agriculture) except Pringsewu District which is dominated by the tertiary
sector (services). [Fisher [16]] adopted a tripartite decomposition of economics by distinguishing between
primary, secondary, and tertiary. The primary sectors were a combination of agriculture, mining, and quarrying.
Secondary sectors were a combination of manufacturing, electricity, gas, water, and construction sectors. While
the tertiary sectors were a combination of trade, hotels, restaurants, transport and communications, financial
sector, companies and companies services, as well as the services sector.
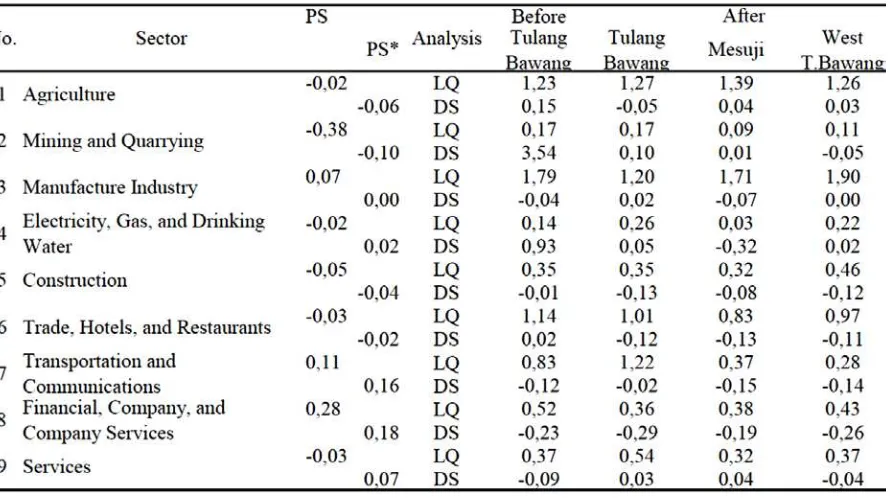
Table 1: The sector development based business field of main district and expansion in the year 2009-2013
1= Agriculture 6= Trade, Hotels, and Restaurants
2= Mining and Quarrying 7= Transportation and Communications
3= Manufacture Industry 8= Finance, Company, Company Services
4= Electricity, Gas, and Drinking Water 9= Services
5= Building/Construction
Figure 1: The contributions sector and absorption of labor (TK) in the main district and expansion
of the year 2013. Description: T = Tanggamus; P = Pringsewu; TB = Tulang Bawang; M = Mesuji; TBB =
West Tulang Bawang
The biggest contribution came from trade sector, hotels, and restaurants, followed by the services sector,
transport and communications, as well as finance, company and company services. The development of the
contribution of the secondary sector (industry) in the District of Pringsewu as DOB was also higher than the
main district. Thus, in the post-expansion, Pringsewu District had a different economic structure of its main
district, where the service sector (tertiary) was more dominant than the agriculture sector (primary). According
51
T T_TK P P_TK TB TB_TK M M_TK TBB TBB_TK
Sector :1 2 3 4 5 6 7 8 9
to Santra, Kumar [17] in Bihar services sector, industry, and agriculture contributed for 52 percent, 28 percent,
and 20 percent to the GDP of India. The secondary sector (industry) in the main district and expansion in the
third rank in contribution to PDRB. In general, the industrial sector in DOB had a greater contribution than the
main district.
Table 2: The results of base sector analysis of labor in the main district and expansion in the year of 2013
No. District/City 1 2 3 4 5 6 7 8 9
Figure 2: Average contributions sector of PDRB in the main district and expansion of theyear 2009-2013
3.2 The Case of Tanggamus District
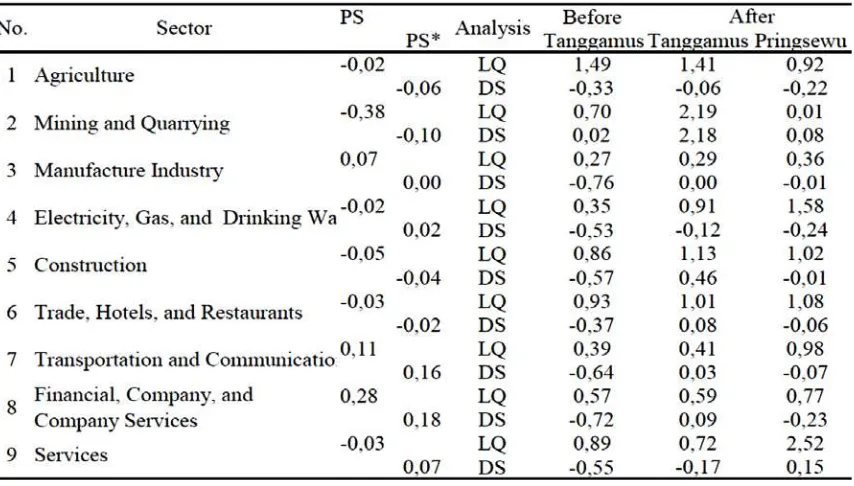
Based on the analysis using LQ and SSA (see Table 3), the agricultural sector was the only basis sector in the
District of Tanggamus before expansion area with LQ = 1,49. However, the growth in the agricultural sector,
including slow. The slow growth in the agricultural sector actually happening in other districts in Lampung
Province, indicated by the negative results of shift proportional in the agricultural sector. Meanwhile, non-base
sectors in the period before the expansion in Tanggamus District who possess the rapid growth were the mining
and quarrying sector, the rest was the slow/negative growth of other sectors.
After the expansion of the region, the agricultural sector remains a basic sector (LQ = 1,41). Although with slow
growth, but still be a strategic sector for being able to absorb the labor force as much as 67 percent and a basis
sector of the labor (see Figure 1 and Table 2). The agricultural sector has the potential to produce goods and
services in addition to being able to meet market demand in the region also exported outside the region, either
through inter-regional trade, trade between the island, and even foreign trade. Rice, crops, fruits, and vegetables
were a reliable commodity in the food crops sub-sector. For the plantation sub-sector dominated by plantation
cocoa comodity, coconut, and coffee (robusta).
Other bases sectors after the expansion area were mining and quarrying (LQ = 2,19), which prior to expansion,
this sectors were not a basis sector but have rapid growth/positive. After the expansion of the region, the mining
and quarrying sector became the basis sector of rapid growth, very potential to be developed by considering the
ratio of the investment with labor absorption. This potential sector be developed in Tanggamus as in
regional/provincial still experiencing the slow growth. Sub-sector that give dominant contribution was the
quarrying sub-sector.
Table 3: The results of base sector analysis and competitiveness before and after expansion in The District of
Tanggamus (KI) and Pringsewu (KP)
Description:
LQ > 1 = Basis Sector; LQ < 1 = non Basis Sector
DS/PS positive = Rapid Growth; DS/PS negative = Slow Growth
PS = Proportional Shift DS = Differential Shift
PS = Before Expansion PS * = After Expansion
The construction sector was a basis sector after expansion the region. There was a potential for new construction
that needs to be built and established in the District of Tanggumus although with slow growth. However,
supported by trade, hotels, and restaurants were becoming a basis sector and have positive growth/fast. The
growth of trade, hotel, and restaurant sector collaborated with building/construction potential to boost the
contribution of PDRB in the District of Tanggamus after expansion area. Moreover, in the level of regional/
provincial (PS), the growth in this sector was likely to slow down/ negative.
After the expansion of the region, the sectors such as manufacturing, transportation, communications, financial
sector, company, and service were still not be a basis sector, but had a positive growth both locally and
regionally, except for the manufacturing sector which in the level of regional/provincial, the sector growth
slowed.
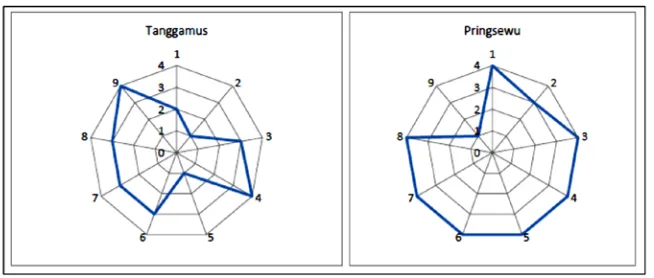
Based on the analysis of Klassen Typology, Arsyad [12], obtained the information that in the District of
Tanggamus, mining and quarrying sectors, and construction sector were an advanced sector which were
growing rapidly (Figure 3). Quarrying sub-sector was a dominant in the mining and quarrying sector, so that it
was very supportive for the supply of raw materials in the construction sector. Therefore, infrastructure such as
roads and transport need to be prepared properly. In 2013, available freight truck car as many as 291 pieces.
Challenge in Tanggamus District was the conditions of the roads in average/good categorized (28%) from the
total length of 1.301 km district roads. Including the anticipated development of the sector that needs attention
was the environmental impact that will result from the activity of mining/quarrying. The position of the
agricultural sector was in advanced sector but oppressed. The agricultural as the primary sector should continue
to be developed in order to meet the needs of Tanggamus District both local and regional, including the ability
of the sector to absorb the labor. For the development of the agricultural sector, needs to do the integration of
improving the quality of human resources, institutional farmer, agriculture infrastructure, development of
saprodi technology, as well as post-harvest.
In post-expansion of the District of Tanggamus in 2008, the District of Pringsewu became a New Autonomous
Region (DOB) which had an authorized to autonomously take care of the government, including optimizing the
potential of economic sectors. The agricultural sector in the early period of expansion the District of Pringsewu
as DOB, was still a basis sector as the main district Tanggamus until 2010, but due to the growth of the
agricultural sector likely to slow down, the agricultural sector was no longer a sector basis. However, the
absorption of the labor in this sector was still very large about 44 percent for agricultural sector contributes only
33 percent in 2013. In addition, Pringsewu District only had 625 hectares of land area, with agricultural land use
reached in 75 percent, but the area of Pringsewu District actually only 17 percent from the area of main district
of Tanggamus (before expansion).
Pringsewu District had a basis sectors such as electricity, gas and water, construction, hotel and restaurant, trade
and services sector. Electricity, gas, and water became a basis sector in the District of Pringsewu but
experienced the negative growth for this sector. However, regionally/provincially, this sector experienced
positive growth. So the opportunity to develop this sector as a basis sector by viewing regional growth was still
considerable potential.
Figure 3: The radar diagram of Typology Klassen sector in the District of Tanggamus and Pringsewu year
2009-2013
Construction and trade sector, hotel and restaurant sector were also a basis sector in the District of Pringsewu as
Tanggamus District after expansion. Only difference was, in the District of Pringsewu although a basis sector,
the sector experienced a negative/slow growth as well as regional growth. So care should be taken in developing
this sector as economic potential.
Other basis sector in the District of Pringsewu which is potentially developed was services sector with LQ =
2,52. The growth in this sector was positive/fast and supported by regional growth that also positive. In the main
district of Tanggamus, before and after the expansion, the service sector was not a basis sector. The
development of the service sector in the District of Pringsewu also potential for the labor market. This sector
was a basis sector of the potential labor force (see Table 2). For the absorption of labor in the service sector by
33 percent in 2013 (see figure 1).
The changes of the economic structure in the District of Pringsewu from the pattern of economic structure in
main district/Tanggamus namely primary sector/agriculture showed a new economic growth center in the
District of Pringsewu which concentrated in the service sector. According to Perroux (1955) in citation from
Sjafrizal [18] stated that economic growth tends to be concentrated in certain areas that driven by
Agglomeration economies which were arising from the concentration of economic activity. In countries that the
members of SAARC (South Asian Association for Regional Cooperation), generally, structural transformation
begins with the declining contribution of agriculture to the Gross National Product in the economy, and the
increasing contribution of the services sector was a leading sector, India was one of them, because the countries
that the member of SAARC generally immature as an industrial economy, unlike developed countries [19].
According to Dietrich and Krüger [20], the research in Germany with the data from 1850 to 2001, explained that
the long-term structural changes in the economic development in three main sectors of the economy follows the
typical pattern namely the primary sector (agriculture, mining) which dominates at the beginning, followed by
secondary sector (manufacturing), and finally by the tertiary sector (services).A declining employment share of
agriculture is a key feature of economic development. Its main drivers are improvements in agricultural
technology combined with Engel’s law release resources from agriculture (“labor push”), improvements in
industrial technology attract labor out of agriculture (“labor pull”) [21].
In the District of Pringsewu, by looking at the results of the analysis of the Klassen Typology (Figure 3), the
services sector was a sector that in the advanced position and growing rapidly. According to Thakur [22], the
Fundamental Economic Structure (FES) concept implies that selected characteristics of an economy will vary
predictably with the region size. With an area of 625 km2 and a population of 379.190 inhabitants, Pringsewu
District can be categorized as a medium city/district with a population of 100.000 to 500.000 inhabitants.
Pringsewu District had a population density of 607 inhabitants/km2 denser than the Districts of Tanggamus as
the main district (185 inhabitants/km2). With the expansion of Pringsewu District from Tanggamus District, the
distance center of economic activity and administrative where the capital city of Pringsewu was in the provincial
capital, being closer at 41 miles compared to when they united with Tanggamus District. The government center
was in the City of Agung, Tanggamus District with the distance of 81 km from the provincial capital. According
to Hoover and Giarratani [23], the location factor, distance, and accessibility become the factors that play an
important role in regional economic analysis. As well as goods and services although it could be moved, but
require a transfer fee to move it. This means that after the expansion into DOB, the Districts of Pringsewu
likely to depress economic of the high costs with the approach of the center of government and economic
services, especially supported by adequate infrastructure.
Recorded in transportation statistics in 2013, the amount of public transport buses around 14 pieces and truck
transport as many as 1.128 in 2012 increased to 1.235 in 2013 [24]. Besides, the mini bus/station wagen as much
as 1.666 pieces, car pick up as many as 942 pieces, as well as 2-wheel vehicles as much as 41.337 pieces [25].
By the facility of transportation, the more support Pringsewu District which is dominated by its PDRB
contribution of the tertiary sector (services). Hurst [26] suggested that the interaction between the regions is
reflected in the state of transportation facilities as well as the flow of people, goods, or services. Transportation
is a measure of the spatial interaction between region and a very important role in supporting the process of
development of a region, including support for the good enough road conditions in the District of Pringsewu.
The country road along 28 km and the provincial road along 48 km in the paved road conditions become a
sufficient assets to spur economic growth in the region, although still need to improve the conditions in the
connecting road between the regions of Pringsewu District. Three sub-districts in the District of Pringsewu,
namely Pringsewu Sub-district, Pangelaran, and Gading Rejo are the one that passed by country road. This
condition is potentially facilitate the access of Pringsewu District to further develop the service sector.
Communications sector contributed communication in the potential service sector. Until the year of 2011,
recorded the number of customers and STT in the District of Pringsewu for the type of wire line services as
many as 2.404 and as many as 585 for the customers of speedy.
3.3 The Case of Tulang Bawang District
In the District of Tulang Bawang, the agricultural sector was a basis sector (LQ = 1.23) which is a mainstay of
the district with the population of 800.000 inhabitants. Although Proportional Shift in the region was negative,
Differential Shift in Tulang Bawang District recorded positive with rapid growth. Other potential economic
sectors that owned by Tulang Bawang District before the expansion was the manufacturing sector, but with slow
growth. Trade sector, hotels, and restaurants were a basis sector in Tulang Bawang District. This sector had a
positive growth when the regional growth in this sector was slowing. And the last sectors which a basis sector
before the expansion in Tulang Bawang District were the transport and communications sector. At the local
level, the slow growth of the sector (DS negative), although regionally this sector was growing rapidly (PS
positive).
After the expansion of the region, the agricultural sector remains a basis sector (LQ = 127) in the District of
Tulang Bawang although agricultural growth slowed down after the expansion. However, the absorption of
labor in this sector still dominant around 67 percent, the agricultural sector was also a basis sector of labor.
Approximately 68 percent of agricultural paddy field and non-paddy field available in the District of Tulang
Bawang which total area of 3.466 km2.Food crop sub-sector, the sub-sector of plantation, and fishery sub-sector
were the largest sub-sector contributing to PDRB. The main commodity of food crops sub-sector were rice and
cassava, plantations sub-sector were the oil palm plantations, sugarcane, and rubber. For the fisheries sub-sector
contributions came from inland and marine fisheries.
Table 4: The results of base sector analysis and competitiveness before and after expansion in the District of
Tulang Bawang (KI), Mesuji (KP1), and West Tulang Bawang (KP2)
Description:
LQ > 1 = Basis Sector; LQ < 1 = Non-Basis Sector
DS/PS positive = Rapid Growth; DS/PS negative = Slow Growth
PS = Proportional Shift DS = Differential Shift
PS = Before Expansion PS * = After Expansion
The manufacturing sector also remains a basis sector after expansion of the region, even with positive
growth/rapid (DS positive) than before the expansion. The development of this sector was quite potential
because it supported by labor which was also a basis in this sector. Medium industrial/large as much as 182
units and small industries, the results of agriculture and plantations were around 10.715 units with a total
investment of 9,8 trillion rupiah [27]. According to Kuznets [28], the development in many countries up to the
1960s as the third of his six characteristics of modern economic growth, stating that the rate of structural
transformation of the economy is high. Major aspects of structural change include the shift away from
agriculture to non-agricultural pursuits and, recently, away from industry to services.
The others sector which still became the basis in post-expansion, namely trade sector, hotel, and restaurant.
Those sector were still able to be a basis despite slower growth than before the expansion. This can happen
because of regionally the value of PS was negative. The sector dominated by wholesale and retail trade
sub-sector. There were a shop (279 units), kiosks (1.993 units), los (2099 units), and the expanse (952 units) in 15
sub-districts in Tulang Bawang District.
A new basis sector after the expansion were transport and communications sector. Locally, the growth of this
sector was relatively slow (DS negative). However, regional support to this sector was positive/fast (PS
positive). Sub-sector that give substantial contribution was the transportation sub-sector, especially road
transport, in addition to communication sub-sector. The transport sector was supported by the highway
infrastructure where 66 percent of the length of district road of 778 stay in good status. There were
transportation facilities such as 22 buses and 136 trucks. For the communication facilities, available as much as
1.714 installed capacity for telecommunication with 965 customers [29]. So, after the expansion, there were four
sectors which became the basis in the District of Tulang Bawang from before the expansion that there were only
3 basis sector.
In addition to the four sectors which became the basis in Tulang Bawang District after the expansion, there was
a sector that was not the basis but had a positive local growth such as mining and quarrying sector, electricity
sector, gas and drinking water, and the services sector. These sectors likely to grow and able to give contribute
to PDRB. The base sector analysis results and competitiveness in more detail can be seen in Table 4.
In the District of Tulang Bawang, the primary sector (agriculture) was also a basis sector in addition there were
the secondary sector (industry) and tertiary sector (services), namely agriculture, manufacturing, trade, hotels,
restaurants, transportation, and telecommunications sector.Structural change exerts a far-reaching influence on
the economic performance of nations. It takes place at various levels of aggregation, leading to a characteristic
pattern of change among the three main sectors of the private economy as well as changes of the industry
composition within these sectors and among firms within the individual industries [30]. The great absorption of
labor was in the agricultural sector followed by transportation and communications sectors which reached a total
of 63 percent and 19 percent with the labor LQ of 1,21 and 1,12 (see Figure 2 and Table 2). As a main district,
Tulang Bawang District within a decade (2004-2013) had a contribution trend of agricultural sector which
increased from 42,74 percent to 49,48 percent (although it had declined when the expansion area of Mesuji
District and West Tulang Bawang between the year 2008-2009). Food crop sub-sector, plantation, and fishery
sub-sector were the largest sub-sector contributing to PDRB. The main commodity of food crops sub-sector was
cassava. For the plantation sub-sectors, the main commodity were the oil palm plantations, sugar cane, and
rubber. For the fisheries sub-sector, the contribution came from the fishing on the eastern sea coast and open
waters. In the manufacturing sector, there were 22 large and medium industries and 4.878 small industries and
households handicraft that contribute in Tulang Bawang District.
To see the position of the sector are in the category of developed or advanced or underdeveloped and have a
rapid or slow growth, Klassen Typology used to analyze it. The industrial sector and the manufacture sector
were an advanced sector and growing rapidly in the District of Tulang Bawang (Figure 4). The development of
the manufacturing sector requires a qualified and skilled human resources, good regulation, infrastructure
support, as well as a clear product market. Associated with human resources, the District of Tulang Bawang
need to improve the quality of human resources as its IPM/HDI value (Human Development Index) amounted to
71,86, still under the Lampung Province that is amounted to 72,87. Road infrastructure that connected between
the regions was very important for the smoothness of marketing. Required the cooperation of local government
district, provincial and central related to connecting roads in the district (123 km of provincial roads, 60 km of
country roads) and between the regions. The distance capital of the district to the provincial capital along the
119 km was also a factor that must be considered in the development of this sector.
The agricultural sector was still the basis sector (LQ = 1.39) in the District of Mesuji as the main district, Tulang
Bawang with positive growth. Food crops and plantations were a sub-sector that dominated to the contribution
of the agricultural sector. The main food crops besides rice was cassava which produced in the area of 97
percent of the total land area for food crops was 32.618 ha. While in the sub-sector of plantation, the oil palm
plantation and rubber plantations dominate the sub-sector. As much as 45 percent of the plantation area devoted
to oil palm plantations and 54 percent for rubber from the total plantation crops area of 45.351 ha. The total area
of Mesuji District was 218.400 ha. The agricultural sector as a basis also supported by the potential labor base.
With the sector's contribution to PDRB by 46 percent, this sector was able to absorb as much as 78 percent of
the labor . Other basis sector in the District of Mesuji after the expansion was the manufacturing sector. The
local growth in this sector tend to slow down. However, it was still possible to be developed, considering this
sector was also the basis for the labor sector. There were 4 industrial units of medium/ large and 749 small
industrial units in the District of Mesuji that was contributing to the PDRB in the sector of manufacturing
industry. Mining and quarrying, and the services sector were the non-basis sector which enable to be a potential
sector because it has positive growth.
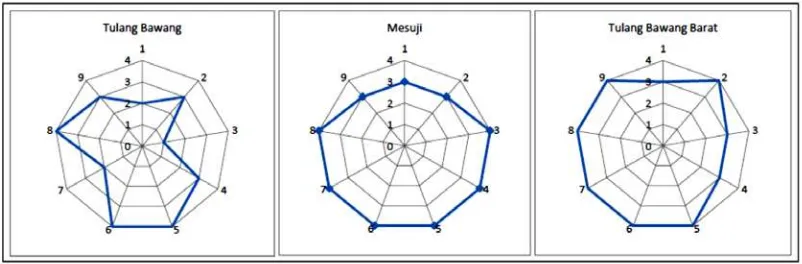
Figure 4: The radar diagram of Klassen Typology sector in the District of Tulang Bawang, Mesuji, and West
Tulang Bawang in the year of 2009-2013
The District of West Tulang Bawang expanded from Tulang Bawang District with an area of 1.201 km2, smaller
than Mesuji District (KP) and the main district. However, it has a population density (216 inhabitants/km2) more
dense than Mesuji District (88 km2). In addition, it had two basis sectors, namely agriculture and manufacturing
sector with rapid growth. Unlike Mesuji District and Tulang Bawang District base that is supported by the labor
sector in the agricultural sector, in West Tulang Bawang District, the labor only made the manufacturing
industry as a basis sector. The dominant sub-sector was the food crop sub-sector with the main commodity was
cassava and the plantation sub-sector with rubbers and palm oil plantation as a main commodity. The
manufacturing sector supported by the presence of eight unit of large medium industries and 1.428 units of
small industries.
Thus, two basis sectors in the District of Mesuji and West Tulang Bawang equal to the basis sector in the
District of Tulang Bawang both before and after the expansion. This likely occurred because the expanded
region had the characteristics of a potential economic sectors that relatively the same as its main district.
Including the area after expansion quite sufficient for the development of sectors such as agriculture sector. If
the sector is managed and developed properly, it expected to be able to increase the income of the people and
suppress the poverty. According to Gyimah-Brempong [31], the high growth of the agricultural sector is able to
increase the relative income and lower income inequality. The strategy is to provide price incentives,
improvement of rural road infrastructure, and availability of inputs. However, because there are still many poor
people in the agricultural sector, the strategy for development is not enough just to lower income inequality, but
should also reduce the level of poverty.
Based on the analysis of Klassen Typology, in the District of Mesuji and West Tulang Bawang, the sectors of
agriculture, mining, quarrying, services, manufacturing industry, gas, electricity, and drinking water sector were
in the category of potential or can still grow rapidly (Figure 4). As the DOB to develop the potential sectors,
Mesuji District and West Tulang Bawang need to manage the area properly and efficiently. The distance of the
center of the district capital and the capital of the province was quite far of 204 km and 140 km. The road
infrastructure in the districts need to improve because only about 40-45 percent of the length of district roads in
a good-average condition. The IPM in Mesuji District (68,79) and West Tulang Bawang (70,38) still below the
IPM in main district and Lampung Provinces, so that the improvements in the quality and service of education,
health, and economic improvement were very important to note. If management can be done well and
efficiently, then the development of potential sectors such as agriculture and industrial sector with the
commodities such as cassava, rubber, and palm oil could give a major contribution to the area. Especially with
the support of large industry, medium, average, and small industry in the industrial sector. In general, according
to Klassen Typology, this considered to the expansion district that still quite a lot of sectors in the category of
relatively underdeveloped. According to Nayak and Mishra [32], some aspects due to structural changes in
Meghalaya include the decline of employment in the agricultural sector and converted with an appropriate
increase in the tertiary sector, especially in the suburbs. Manufacturing and mining sectors are gradually
becoming more prominent. Per capita income increases. Improving infrastructure is not balanced by the number
of vehicles on the road that increased rapidly.
4.Conclusion
There are the differences in the economic structure after the expansion in the District of Pringsewu as an
expansion district compared with its main district, Tanggamus. The dominant sector in the District of
Tanggamus is the primary sector/agriculture while Pringsewu District dominant in the tertiary sector/services. In
the District of Mesuji and West Tulang Bawang, after the expansion, the economic structure is relatively the
same as its main district, Tulang Bawang which is dominant in the primary sector/agriculture. The potential
economic sectors in the main district, Tanggamus (KI1) are mining and quarrying, construction, agriculture,
trade, hotels and restaurants, meanwhile in Tulang Bawang (KI2) are the manufacturing industry, agriculture,
trade, hotels and restaurants, transport, and communications. For the district of expansion in Pringsewu (KP1.1),
the potential economic sector are the services sector, electricity, gas and drinking water, construction, trade,
hotels and restaurants. Agriculture sector and manufacturing industry are the potential economic sector in
Mesuji (KP2.1) and West Tulang Bawang (KP2.2). For the development of a potential economic sectors need to
consider the position of each advanced sector with high growth as a priority, the local and regional potential of
the sector, the quality of human resources, the distance location, road infrastructure, and other supporting
facilites and infrastructure.
References
[1] Kuncoro, M., Perencanaan Daerah: Bagaimana Membangun Ekonomi Lokal, Kota, dan Kawasan? 2012,
Jakarta: Salemba Empat. 424.
[2] BPS, Tinjauan Ekonomi Regional Di Provinsi Lampung 2013. 2014, Bandar Lampung (ID): BPS Provinsi
Lampung.
[3] Bappenas and UNDP, Studi Evaluasi Dampak Pemekaran Daerah 2001-2007. 2008, Jakarta: BRIDGE
(Building and Reinventing Desentralised Governance).
[4] Siregar, H., Makro-Mikro-Pembangunan: Kumpulan Makalah dan Esai. 2009, Bogor (ID): IPB Press.
[5] Todaro, M.P., Ekonomi Pembangunan Di Dunia Ketiga. 2000: Terjemahan oleh Haris Munandar, Edisi ke
tujuh. Erlangga, Jakarta.
[6] Yulistiani, A.e.a., Analisis Terhadap Evaluasi Daerah Otonomi Baru Tahun Anggaran 2007, in Kemitraan
bagi Pembaruan Tata Pemerintahan di Indonesia. 2007, Dirjen Otda Depdagri: Jakarta.
[7] Kemendagri, D.O., Evaluasi Daerah Otonom Hasil Pemekaran (EDOHP). 2011, Jakarta.
[8] Dunn, E.S., A statistical and analytical technique for regional analysis. Papers in Regional Science, 1960.
6(1): p. 97-112.
[9] Glasson, J., Pengantar Perencanaan Regional, diterjemahkan Paul Sitohang. Jakarta: Fakultas Ekonomi
Universitas Indonesia, 1990.
[10] Markusen, A.R., H. Noponen, and K. Driessen, International trade, productivity, and US regional job
growth: A shift-share interpretation. International Regional Science Review, 1991. 14(1): p. 15-39.
[11] Tarigan, R., Ekonomi Regional. Teori dan Aplikasi, Jakarta, Bumi Aksara. 2006.
[12] Arsyad, L., Ekonomi Pembangunan, Edisi Kelima. 2010: Yogyakarta: Unit Penerbit dan Percetakan STIM
YKPN Yogyakarta.
[13] BPS, Tinjauan Ekonomi Regional Daerah Otonom Di Provinsi Lampung 2010. 2011, Bandar Lampung
(ID): BPS Provinsi Lampung.
[14] Jula, D. and N.M. Jula, Economic Growth and Structural Changes in Regional EmploymenT. Journal for
Economic Forecasting, 2013(2): p. 52-69.
[15] Maroto-Sánchez, A. and J.R. Cuadrado-Roura, Is growth of services an obstacle to productivity growth? A
comparative analysis. Structural Change and Economic Dynamics, 2009. 20(4): p. 254-265.
[16] Fisher, A.G., Production, primary, secondary and tertiary. Economic Record, 1939. 15(1): p. 24-38.
[17] Santra, S., R. Kumar, and N. Bagaria, Structural change of Bihar economy during 1999 to 2010: a district
level analysis. The International Journal of Humanities and Social Studies, 2014. 2(1).
[18] Sjafrizal, Ekonomi Wilayah dan Perkotaan. 2012, Raja Grafindo Persada: Jakarta.
[19] Sawhney, U., Growth and structural change in SAARC economies. International Journal of Economics and
Finance Studies, 2010. 2(2): p. 95-103.
[20] Dietrich, A. and J.J. Krüger, Long-run sectoral development time series evidence for the German economy.
2008, Jena economic research papers.
[21] Alvarez-Cuadrado, F. and M. Poschke, Structural change out of agriculture: Labor push versus labor pull.
American Economic Journal: Macroeconomics, 2011: p. 127-158.
[22] Thakur, S., Fundamental economic structure and structural change in regional economies: a
methodological approach. Régionet Développement, 2011. 33: p. 9-38.
[23] Hoover, E.M. and F. Giarratani, An Introduction To Regional Economics. 1971, West Virginia University.
[24] BPS, Statistik Transportasi 2013. 2014, Bandar Lampung (ID): BPS Provinsi Lampung.
[25] BPS, Pringsewu Dalam Angka. 2014, Pringsewu (ID): BPS Kabupaten Pringsewu.
[26] Hurst, M.E.E., Transportation geography: comments and readings. 1973: McGraw-Hill Companies.
[27] BPS, Tulang Bawang Dalam Angka. 2014, Menggala (ID): BPS Tulang Bawang.
[28] Kuznets, S., Modern economic growth: findings and reflections. The American Economic Review, 1973: p.
247-258.
[29] BPS, Lampung Dalam Angka. 2014, Bandar Lampung (ID): BPS Provinsi Lampung.
[30] Krüger, J.J., Productivity and structural change: a review of the literature. Journal of Economic Surveys,
2008. 22(2): p. 330-363.
[31] Gyimah-Brempong, K., Agricultural development and the size distribution of personal income: The tropical
African experience. World development, 1988. 16(4): p. 483-488.
[32] Nayak, P. and S.K. Mishra, Structural change in Meghalaya-theory and evidence. NORTH EAST
INDIA-APPROACHES TOWARDS SUSTAINABLE DEVELOPMENT, 2009: p. 25-40.