Radon and thoron analysis of soil gas survey case study of Rajabasa
geothermal field
Nandi Haerudin, Wahyudi, and Wiwit Suryanto
Citation: AIP Conf. Proc. 1554, 218 (2013); doi: 10.1063/1.4820324
View online: http://dx.doi.org/10.1063/1.4820324
View Table of Contents: http://proceedings.aip.org/dbt/dbt.jsp?KEY=APCPCS&Volume=1554&Issue=1
Published by the AIP Publishing LLC.
Additional information on AIP Conf. Proc.
Journal Homepage: http://proceedings.aip.org/
Journal Information: http://proceedings.aip.org/about/about_the_proceedings
Top downloads: http://proceedings.aip.org/dbt/most_downloaded.jsp?KEY=APCPCS
Radon and Thoron Analysis of Soil Gas Survey
Case Study of Rajabasa Geothermal Field
Nandi Haerudin
1,*, Wahyudi
2and Wiwit Suryanto
21
Department of Geophysics Engineering, Faculty of Engineering, Lampung University, Jl. Sumantri Brojonegoro No. 1, Bandar Lampung 35145, Indonesia
2
Department of Physics Faculty of Mathematics and Natural Sciences, Gadjah Mada University, Jl. Sekip Utara No. 1,Yogyakarta 55281, Indonesia
*
[email protected]Abstract. Radon and Thoron concentration of soil gas was measured by Scintrex Radon detector RDA 200 in the Rajabasa geothermal field, South Lampung regency, Indonesia. This study is aimed todeterminethe buried fault zoneunder theoverburdenlayer. The survey areacovers three geothermal manifestations in the southern part of Rajabasageothermalfield. The result indicates fault system trending SW-NE (N 60o E) and SSW-NNE (N 8o E). The contour map of Radon concentration performed high value in the three manifestations which was included survey area; those are 123 cpm in Gunung Botak hot spring, 145 cpm in Kunjir fumarole and 382 cpm about 300 m from Bulakan (Way Belerang) fumarole. Three manifestations were connected by two fault. The first fault passed begin from Gunung Botak directed to Kunjir and the other across the first fault from SSW to Bulakan. The contour map of Radon and Thoron ratio indicated that the second fault system is not only indicate the presence of the fault /fracture zones but also show the extension of the faults/fractures from the depth to the surface.
Keywords: Radon, Thoron, Soil gas survey, Geothermal field. PACS: 93.85.Np
INTRODUCTION
The presence of geothermal manifestations were controlled by structures that were formed in the fracture or fault area. High permeability zones i.e. fault /fracture zones provides a channel for the geothermal fluid driving up from the depth to the surface. It have important role in the transfer of geothermal fluid from the reservoir to the surface [1]. So,the permeable zones such as fault is important when we study geothermal field.
Measurements of radioactivity Radon was used in the exploration of geothermal areas adopted from mineral exploration techniques. The anomalous Radon concentrations can be observed in the active fault zone because it could provide a conduit for upward migration [2-4]. Radon method is mostly used as a device in geochemical methods (geochemistry tools). It began to be popularized in 1984. The research that using Radon gas for geothermal exploration has been carried out by Lopez et. al.[5] in Mexico to find the source of geothermal energy, and then Rodriguez et. al.[6] conducted a research for soil gas Radon observation in Las Pail as geothermal area, Costa Rica. Radon method has been also successful as an effective way to detect hidden faults [1].This method mixed with geo-electric methods for determine fault or fracture zone. Previously, this method has been done
in some places like China and Mongolia [7-9]. Meanwhile, the Radon method for geothermal exploration in Indonesia only has been done by Phuong et al [10] in Ungaran geothermal field Central Java as a geochemical tools.
The aim of this study is to determine the fault that connect three manifestations in the southern part of the Rajabasa geothermal area.
GEOLOGY SETTING
FIGURE 1. Geology Map of Rajabasa Geothermal Field
PREVIOUS WORK
Some preliminary survey relatd to the exploration of Rajabasa geothermal prospect area have been done initially by geothermal division of Pertamina Co. but it was unpublished [12]. Geological mapping based on the structure of volcanic rocks and geological events was developed in that area by Suswati et al.[13]. The structure pattern developing in this complex area was influenced by regional structures such as Lampung fault which is closely associated with sliding of the Semangko fault.
A study to investigate geomagnet for describing of the fault system has been conducted by Suharno et. al.
[14]. This study not cover the entire area of geothermal prospect Rajabasa. The data were dominantly taken in the northern Rajabasa volcano while in the southern were very less and almost nil. Beside that, the geological reference is the regional geology, not detail geological reference. Haerudin et. al [15,16] carried out research of geomagnetic covered entire area of Rajabasa geothermal. This study produced the 3D model of Rajabasa reservoir.
METHOD
There are three isotopes of Radon that often occur in nature i.e. 222Rn (Radon) with a half-life time of 3.825 days, 220Rn (Thoron) with a half-life of 54.5 seconds and 219Rn (Actinon) with a half-life of 4 seconds. Radon was selected as an exploration tool because of a suitable half-life and its source in the form of magmatic rocks derived from the decay of 238U series while Thoron decay series derived from Thorium.
Radon is able to be detected in very low concentration. So, this became a basis for the highly sensitive geochemical methods [17]. In addition, there are several other reasons why Radon is used as a tracer element as in [18] and [19]:
(i) To represent the thermodynamic activity. It is transported to the surface by geothermal gas in place where the thermodynamic activity is high.
(ii) To indicate active faults and fractures. It moved faster when passing through open fractures or fracture. (iii) No correction required for the geochemical composition. As a noble gas, radon is mixs with no other elements in the field.
(iv) To show recent geothermal activity because the new radon generated every 20 days.
The equation to describe the steady state radon transport upward with the convection-diffusion mechanism in three-dimensional porous media, where Eq.(1) is a mass flow velocity cm/sec [20]:
(1) and
D* = D/e (2)
where
N = radon concentration
D* = difussivity
= decay constant of radon(O = 2,07x10⁻⁶s-l)
y = direction to surface
D = diffussion coefficient
= bulk porosity of rock
The radon concentration was measured with radon detector (RDA-200, Scintrex). Soil gas was circulated through the detector manually with hand pump, replacing the air in the detection cell. The Rn concentration was measured by an alpha-scintillation radon counter with soil gas pumped directly into a scintillation chamber.
When the alpha-particles produced during radon decay impact the ZnS(Ag) layer in the scintillation counter, an energy pulse is created in the form of photons, measured by a photo-multiplier and a counter. By means of alpha emission, the concentration of Rn was calculated from three counts in each sequentially 2 minutes.
RESULT
concentration in manifestation zones that are 382 cpm western near Bulakan, 145 cpm in Kunjir and 123 cpm in Gunung Botak. For Thoron, the greatest valueis 164 cpm and the smallest value is 4cpm.
Threshold value is calculated using the geometric mean value (average) plus the deviation standard. It is used to identify the concentration anomalies within soil gas data [21]. The areas whose concentration greater than the threshold value are considered as anomalies. Based on Table 1, the data is classified into three categories that are low, high and anomalies. Concentration values were low category considered as background values.
TABLE 1.Distribution of soil gas classification
Classification Radon (cpm)
Thoron (cpm)
Radon/ Thoron
Mean () 63 62 2.62
Deviation standard ()
59 42 4.72
Low (cpm < ) < 59 < 42 < 4.72
High ( < cpm < + )
59 – 122 42 – 104 4.72 – 7.34
Anomalies (+ < cpm < + 2)
122 – 186 104 – 166 7.34 – 9.96
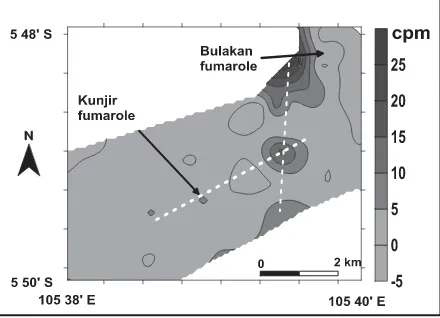
The measurement point data were presented on the contour maps using kriging method provided by Surfer 8. In the contour map of Radon concentration, it is shown the value of anomalous Radon concentration which formed two lines. First (F1), the southwest-northeast trending lineament (N450E) through Gunung Botak and Kunjir, and the other (F2) is north-south trending lineaments (N80E) cutting the first lineament passed near Bulakan geothermal manifestation (Fig 2). The value of high Radon anomalies may be indicate an enlarged permeability where Radon is rapidly migrating to the surface before it decay into daughter products. Faults supports gas transportation because it increase the permeability of the rock and assist geothermal fluid stream up to the surface. Furthermore, the fluid from deep sources migrating upward through the fault depends also on other factors including the level of cracking rock and soil capability to absorb water through the rocks.
Thoron has a short half-life of 54.5 s, so that the concentration decreased rapidly for 2 minutes of the sequences of three times measurement. Meanwhile, Radon has a half-life 3.825 days and can be transported in the fracture for a considerable distance.
FIGURE 2. Contour Map of Radon Concentration at Rajabasa Geothermal Field
To detect the presence of fault or fracture system connecting depth zone to the surface, the concentration Radon and Thoron ratio can be a suitable indicator. Contour map of the Radon and Thoron ratio is shown in the Fig 3. The high value of Radon and Thoron ratio (> 7.34) is found dominantly on the second fault lineaments and lightly visible on the Kunjir manifestation. The zones with the high value of Radon and Thoron ratio not only indicate the presence of the fault /fracture zones but also show the extension of the faults/fractures from the depth to the surface.
FIGURE 3. Contour Map of Radon and Thoron
Concentration Ratio
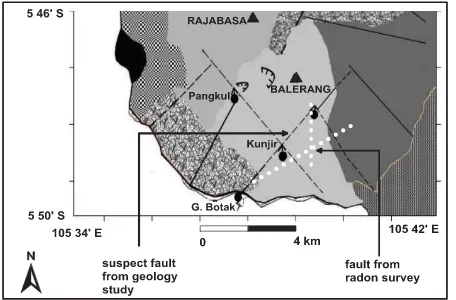
FIGURE 4. Fault Performance from Radon Survey on Geology Map
CONCLUSION
The Radon method result shown two lineament anomalies that indicating as the fault. The first trend in the southwest-northeast direction which is connecting Gunung Botak and Kunjir geothermal manifestations. The other fault in the NNE – SSW direction cross to the first into Bulakan. Based on contour map of Radon and Thoron concentration ratio, the second anomalies, characterized with high value, indicated the extending fault from depth.
ACKNOWLEDGEMENT
This Research cooperated with LEMIGAS. I would like to give thankful to Prof. Suprajitno Munadi from LEMIGAS.
REFERENCES
1. C. C. Fu, Y. F. Walia and C. H. Chen, Geochemical Journal 39, 427-439 (2005).
2. K. Ioannides, C. Papachristodoulou, K. Stamoulis, D. Karamanis, S. Pavlides, A. Hatzipetros and E. Karakala, Applied Radiation and Isotopes 59 (2-3), 205 – 213 (2003).
3. J. Swakon, K. Kozak, M. Paszkowski, R. Gradzin'ski, J. Loskiewicz, J. Mazur, M. Janik, J. Bogacz, T. Horwacik and P Olko, Journal of Environmental Radioactivity 78(2), 137 – 149 (2004).
4. G. Jönsson, Radiation Measurements 25(1-4), 537-546 (1995).
5. A. Lopez, L. Gutierrez, A. Razo and M. Balcazar,
Nuclear Instruments and Methods in Physics Research
255, 426-429 (1987).
6. A. Rodriguez, Y. Torres, L. Chavarria and F. Molina,
Geothermal Training Proggrame 30th Anniversary
Workshop Orkustofnun, Grensasvegur 9, Iceland,
2008.
7. L. Zuhui, W. Yujin, C. Donrong, L. Youming, X. Aijun and J. Fuxing, Nuclear Tracks Radiation Measurement 22(1-4), 387-392 (1993).
8. Tilstey, Open File Report 5876, Ministry of Northern Development and Mines, 1993.
9. G. A. Duddrige, Observations on Soil Gas Variations in the Bovey Basin, Proceeding of the Ussher Society, 1995.
10. N. K. Phuong, A. Harijoko, R. Itoi and Y. Unoki,
Journal of Volcanology and Geothermal Research, 229–230, 23-33, (2012).
11. P. Bronto, G. Asmoro, Hartono and Sulistiyono,
Indonesian Journal of Geology 7(1), 11-25, (2012). 12. B. Budiardjo, Masdjuk and A. M. N. Leonardus,
Project Report, PERTAMINA Divisi Panasbumi,
Indonesia, 1995.
13. Suswati, N. Haerani and I. S. Sutawidjaya, Laporan
Kegiatan, Direktorat Vulkanologi dan Mitigasi
Bencana, Badan Geologi Bandung, 2001.
14. S. Suharno, Soengkono and A. Hidayatika, “Magnetic Analysis to Determine the Permeability of a Geothermal Reservoir: Case Study of the Mt. Rajabasa Geothermal System, Lampung Selatan Indonesia” in Proceedings World Geothermal Congress, Bali, 2010. 15. N. Haerudin, R. Wahyuningsih, Wahyudi and W.
Suryanto, “Interpretasi Kualitatif Data Anomali Magnet Total untuk Menentukan Gambaran Umum Struktur Bawah Permukaan di Daerah Panasbumi Rajabasa” in Prosiding Seminar Nasional Penelitian,
Pendidikan dan Penerapan MIPA, Edited by D.
Darmawan, Fakultas MIPA, Universitas Negeri Yogyakarta, 2011, pp. 101-108.
16. N. Haerudin, Wahyudi, W. Suryanto and Sarkowi,
“Pemodelan 3D Data Anomali Magnet Total untuk
Menentukan Reservoir di Daerah Panasbumi Rajabasa Provinsi Lampung, Indonesia”in Proceedings the 12th Annual Indonesian Geothermal Association Meeting & Conference, Edited by Suharno, Bandung, 2012. 17. J. E. Gingrich, Journal of Geochemical Exploration
21, 19-39 (1984).
18. M. Balcázar, A. López Martínez, M. Huerta, J. H. Flores Ruíz and P. Peña, “Use of Environmental Radioactive Isotopes in Geothermal Prospecting” in The 17th Pacific Basin Nuclear Conference, Instituto Nacional de Investigaciones Nucleares, Mexico, 2011. 19. A. K. Stokerand P. Kruger, “Radon in Geothermal
Reservoir” in Second U. N. Symposium Devel. Use. Geotherm. Resour.,San Fransisco, 1975, pp. 1797-1803.
20. A. Abdoh and M. Pilkington, Geoexploration 25(4), 341-354 (1989).