Developmental Trajectories Toward Violence in Middle Childhood:
Course, Demographic Differences, and Response
to School-Based Intervention
J. Lawrence Aber and Joshua L. Brown
Columbia UniversityStephanie M. Jones
Yale UniversityThe present study addressed 3 questions concerning (a) the course of developmental trajectories toward violence over middle childhood, (b) whether and how the course of these trajectories differed by demographic subgroups of children, and (c) how responsive these trajectories were to a universal, school-based preventive intervention. Four waves of data on features of children’s social-emotional development known to forecast aggression/violence were collected in the fall and spring over 2 years for a highly representative sample of 1st to 6th grade children from New York City public elementary schools (N⫽11,160). Using hierarchical linear modeling techniques, synthetic growth curves were estimated for the entire sample and were conditioned on child demographic characteristics (gender, family economic resources, race/ethnicity) and amount of exposure to components of the preventive intervention. Three patterns of growth—positive linear, late acceleration, and gradual deceleration— characterized the children’s trajectories, and these trajectories varied meaningfully by child demographic characteristics. Most important, children whose teachers taught a high number of lessons in the conflict resolution curriculum demonstrated positive changes in their social-emotional developmental trajectories and deflections from a path toward future aggression and violence.
The last decade has witnessed a powerful convergence of de-velopmental science and prevention science in guiding the design and evaluation of interventions aimed at preventing future aggres-sive and violent behavior in children and youth (Institute of
Med-icine, 1994; Maggs & Schulenberg, 2001). From developmental science, knowledge has grown about the mechanisms by which exposure to violence affects children’s risk for such outcomes (Coie & Dodge, 1998). Our greater understanding of these causal mechanisms has led to improvements in both the design and evaluation of preventive interventions, which increasingly target these mechanisms as their focus of change (Dodge, 2001). Yet despite these advances, we still know relatively little about the developmental course of these mechanisms in middle childhood and whether the course differs by characteristics such as children’s gender, socioeconomic status, and race/ethnicity.
From prevention science, knowledge has grown about interven-tion strategies effective at reducing children’s risk for future ag-gressive and violent behavior (Clayton, Ballif-Spanvill, & Hun-saker, 2001; Conduct Problems Prevention Research Group, 1999; Elias, Gara, Schuyler, Branden-Muller, & Sayette, 1991; Kellam, Ling, Merisca, Brown, & Ialongo, 1998; Webster-Stratton & Tay-lor, 2001; Weissberg & Greenberg, 1998). Although the literature on school-based preventive interventions is rich with studies of interventions targeted at subgroups of high-risk children, it is comparatively poorer in studies of universal preventive interven-tions implemented with general populainterven-tions of students (Durlak, 1995). Furthermore, among the dozen or so best studies of uni-versal school-based interventions designed to prevent conduct problems and reduce risk for future aggression and violence, a variety of methodological challenges limit the quality and gener-alizability of the knowledge base (Hundert et al., 1999).
In this study, we strove to make contributions both to develop-mental science and to prevention science by examining growth trajectories in domains of development thought to forecast future J. Lawrence Aber, National Center for Children in Poverty, Joseph L.
Mailman School of Public Health, Columbia University; Joshua L. Brown, Department of Human Development, Teachers College, Columbia Univer-sity; Stephanie M. Jones, Department of Psychology, Yale Univesity.
This research was initiated with the support of grants from the Centers for Disease Control and Prevention and the William T. Grant Foundation. Additional support was provided by the Pinkerton Foundation, the Surdna Foundation, and the Kellogg Foundation.
We would like to acknowledge the work of Tom Roderick, executive director of Educators for Social Responsibility (ESR) Metropolitan Area, who initiated the Resolving Conflict Creatively Program (RCCP) together with Linda Lantieri, director of the RCCP at the ESR National Center. We wish to thank the William T. Grant Foundation and, in particular, its former President and Vice President, Betty Hamburg and Lonnie Sherrod, for facilitating our research collaboration with the RCCP. We also thank Tom Roderick, Jinnie Spiegler, Mariana Gaston, and Mara Gross for facilitating the research team’s entry into and ongoing relationships with the schools participating in this evaluation. We gratefully acknowledge the work of the National Center for Children in Poverty field staff and the project coordi-nation efforts of Faith Samples and Nina Chaudry. Finally, we especially thank the students, teachers, assistant principals, and principals in each of the research schools for their participation and cooperation with this study. Correspondence concerning this article should be addressed to J. Law-rence Aber, National Center for Children in Poverty, Joseph L. Mailman School of Public Health, Columbia University, 154 Haven Avenue, New York, New York 10032. E-mail: [email protected]
violent and aggressive behavior and by using those trajectories to evaluate one of the largest universal school-based violence pre-vention programs in the country, the Resolving Conflict Creatively Program (RCCP). In the following sections, we (a) briefly review and justify the domains of development we examined for growth over middle childhood, (b) describe the RCCP and highlight the key features of the intervention for which program implementation may vary, and (c) describe why trajectories of growth are superior to single-point-in-time measures of outcome variables for evalua-tions of preventive intervenevalua-tions. Finally, we specify the three questions we set out to answer in this study on developmental trajectories toward violence in middle childhood regarding their course, demographic differences, and response to a school-based universal preventive intervention.
The Domains of Development
In the design of this study, constructed collaboratively by prac-titioners and researchers (Aber, Brown, Chaudry, Jones, & Sam-ples, 1996), we proposed to focus on three domains of social-emotional development known to forecast future aggressive and violent behavior and that were hypothesized both to change over the course of middle childhood and to be responsive to change that was due to children’s participation in the RCCP. The first domain,
teachers’ perceptions of children’s aggressive and prosocial be-haviors, is face valid as an indicator of program impact and has been used successfully in prior evaluations of school-based pre-ventive interventions (Greenberg, Kusche, Cook, & Quamma, 1995; Kellam et al., 1998).
We also collected children’s reports of their own behavioral symptomatology, specifically, their levels of conduct problems, depressive symptoms, and aggressive fantasies. Child-reported behavioral problems have also been used extensively in prior evaluations of preventive interventions (Conduct Problems Pre-vention Research Group, 1992; Dahlberg, Toal, & Behrens, 1996; Elias et al., 1991; Farrell & Meyer, 1997), with reports of conduct problems being one of the strongest predictors of later maladjust-ment, including delinquency (White, Moffitt, Earls, Robins, & Silva, 1990) and conduct disorder in adolescence (Loeber, 1991). Because both teacher- and child-reported indicators may be espe-cially vulnerable to reporting bias, it is generally recommended that results be compared on the basis of different sources of data (e.g., child self-report and teacher ratings) and derived from dif-ferent analytic techniques (e.g., hierarchical as well as general linear modeling) (Conduct Problems Prevention Research Group, 1999; Keiley, Bates, Dodge, & Pettit, 2000).
Finally, on the basis of prior developmental theory and research (Coie & Dodge, 1998; Dodge, Pettit, Bates, & Valente, 1995; Dodge, Pettit, McClaskey, & Brown, 1986; Schultz & Selman, 2002; Selman, Beardslee, Schultz, Krupa, & Podoresky, 1986), we collected data on a variety ofsocial-cognitive processesknown to place children at risk for future aggressive and violent behavior. In a recent major review of the theoretical and empirical literature on aggressive and antisocial behavior, Coie and Dodge (1998) em-phasized the current need for studies that specify the processes and mechanisms by which poor, ethnically diverse, and highly mobile urban neighborhoods are related to heightened crime and violence (see also Aber, 1994). On the basis of their thorough analysis, Coie and Dodge (1998) stated that “an environmental variable will
influence human aggressive behavior if it affects one or more of three mental processes: (a) the perception of threat and experience of irritation or fear; (b) the accessibility of aggressive responses in one’s memorial repertoire; and (c) the evaluation that aggression will lead to desirable positive consequences” (p. 795). In the present study, we focused on two of these types of mental pro-cesses. To examine children’s perception of threat, we assessed their hostile attribution bias, namely, the tendency to attribute hostile intent to an ambiguous or prosocial cue (Aber, Jones, Brown, Chaudry, & Samples, 1998; Dodge, Price, Bachorowski, & Newman, 1990). To examine the accessibility of aggressive re-sponses in children’s memorial repertoires, we assessed children’s aggressive (and competent) responses to hypothetical interpersonal negotiation situations (Leadbeater, Hellner, Allen, & Aber, 1989; Selman et al., 1986).
Each of these types of mental processes (a) is affected by certain types of experiences (e.g., a history of harsh, punitive, or abusive parenting [Dodge et al., 1995; Patterson, Reid, & Dishion, 1992; Weiss, Dodge, Bates, & Pettit, 1992] or a peer environment in which violence is normative [Bierman & Wargo, 1995; Coie & Jacobs, 1993; Tremblay, Masse, Vitaro, & Dobkin, 1995]) and, in turn, (b) increases the probability of aggression/violence by chil-dren and youth (Guerra & Slaby, 1990; Huesmann & Guerra, 1997). In other words, each of these mental processes constitutes a potential causal mechanism linking early exposure to ecological risk with later developmental outcomes of aggression and violence (Dodge, Bates, & Pettit, 1990).
Such mental processes have been associated with aggression and violence both concurrently (Dodge, 1986; Dodge et al., 1986, 1990; Lochman & Dodge, 1994) and over a short time period (e.g., over 2 successive years; see Zelli, Dodge, Lochman, Laird, & Conduct Problems Prevention Research Group, 1999) in young children and adolescents. However, no longitudinal studies have been identified that described the form of children’s developmen-tal growth trajectories in these mendevelopmen-tal processes during middle childhood or that used racially, ethnically, and socioeconomically diverse samples large enough that demographic subgroup differ-ences in growth trajectories could be examined. Although there is an extensive literature on gender, socioeconomic, and racial/ethnic differences in the aggressive and violent behavior of children and youth (Conger et al., 1992; Elliott, Ageton, Huizinga, Knowles, & Canter, 1983; Offord, Boyle, & Racine, 1991; Patterson, Ku-persmidt, & Vaden, 1990), most of these studies examined cross-sectional differences or differences in growth rates measured as change between two points in time. None examined growth over the 6-year period of elementary school using an accelerated lon-gitudinal design and growth curve modeling. Consequently, no prior studies have been able to test for subgroup differences in level (intercept), slope (linear change), and rate of acceleration or deceleration (curvilinear change) in aggressive and violent behav-ior or their developmental correlates.
The Intervention
over 6,000 teachers and 200,000 children in several hundred New York City public schools. The RCCP is also currently being implemented in 12 other diverse school systems across the United States from Anchorage, Alaska, to Atlanta, Georgia, by the RCCP National Center, an initiative of the national ESR and local part-ners. The main goal of the RCCP is to change the mental processes and interpersonal behavioral strategies that lead children to engage in aggression and violence by teaching them constructive conflict resolution strategies and promoting positive intergroup relations.
Specific program objectives are to (a) make children aware of the different choices they have besides passivity or aggression for dealing with conflicts, (b) help children develop skills for making those choices real in their own lives, (c) encourage children’s respect for their own culture and those of others, (d) teach children how to identify and stand against prejudice, and (e) make children aware of their role in creating a more peaceful world.
The intervention has two major components: (a) training and coaching of teachers to support them in implementing a curriculum in conflict resolution and intergroup understanding (teacher train-ing and coachtrain-ing) and (b) the delivery of that curriculum via classroom instruction for children provided by the trained teachers (classroom instruction). Additional features of the RCCP include peer mediation, principals’ training, and parent training. (See Aber et al., 1996, for a more detailed description of the intervention. See Clayton et al., 2001, for a detailed description of how the RCCP compares to other violence prevention, conflict resolution, and peace programs for elementary school children.)
To reflect the normal evolution of RCCP implementation within a school, and to maximize external validity for a test of the program as implemented on children’s development, we used a quasi-experimental design. Four schools were identified in each of four school districts in New York City and were recruited to participate in the evaluation. Each school represented one of four different stages of program evolution. Presumably, teachers also varied both within and across schools in their level of interest and enthusiasm for participating in and implementing the RCCP. Be-cause children were arbitrarily assigned to teachers independent of teacher’s willingness to participate in the RCCP, a quasi-experimental design still permitted us to make an unbiased esti-mate of the effects on children’s development of their exposure to RCCP teachers. (See the Method section for details of school selection.)
Many prevention programs are well founded on research-based theoretical principles, are rigorously evaluated for efficacy, and are often quite expensive, but they rarely, if ever, solve the multifac-eted problems of how the programs might go to scale. Other programs, in contrast, grow out of practice-based philosophies, solve the financial, bureaucratic, and implementation challenges required to go to scale, but are of unknown efficacy and validity. Each type of program offers a different profile of opportunities for and challenges to service delivery and knowledge development. In an earlier publication (Aber et al., 1996), we described the recip-rocal process by which the research and intervention teams col-laborated to make the RCCP’s implicit program theory explicit and to draw on developmental theory and method to design a fair and disciplined test of the effects of the program as implemented on children’s development. In another report, we described the 1st-year (two-wave) results based on a subset of child-report measures (Aber et al., 1998). In this study, for the first time, we report the
2-year (four-wave) results based on both child- and teacher-report measures of this evaluation.
Prior research both on the RCCP (Aber et al., 1996, 1998) and on other school-based prevention efforts (e.g., Conduct Problems Prevention Research Group, 1999) suggests that even well-designed and supervised interventions demonstrate great variation in both the dosage and the quality of the intervention to which the students are exposed. Indeed, in early work with this sample, hierarchical linear regressions were used to test the separate and combined influence of the RCCP intervention components on change over Year 1 (from Wave 1 to Wave 2) in child-reported outcomes. These analyses revealed that after the amount of train-ing and coachtrain-ing a teacher received was controlled, the more classroom instruction children received in the RCCP, theslower
their growth over Year 1 in negative outcomes and theslowertheir decline in positive outcomes. However, the results also revealed that after we controlled for its shared variance with classroom instruction, the amount of teacher training and coaching was related to an increase in negative outcomes and a decrease in positive outcomes over Year 1 (Aber et al., 1998).
Building on this work, we developed measures of variation in the implementation of the RCCP (both within a particular year and summed across 2 years) in order to examine how this variation affected children’s development over 2 years. Our hypothesis was that children whose teachers implemented more classroom instruc-tion in the conflict resoluinstruc-tion curriculum of the RCCP but received only a moderate amount of training and coaching would benefit the most (Aber et al., 1998).
Change in Developmental Trajectories as the Measure of
Program Impact
Most preventive interventions aim to decrease risk factors and/or increase protective factors at various levels of children’s ecologies with the goal of altering their trajectories toward positive outcomes and away from negative outcomes. Although both pro-gram and developmental theories draw on the concept of trajecto-ries, it is only recently that trajectories per se (rather than point-in-time or cumulative [summed over time] scores) have actually been employed as measures of developmental outcomes and/or program impact (see Hundert et al., 1999; Maggs & Schulenberg, 2001; Vitaro, Brendgen, & Tremblay, 2001). In this study, devel-opmental trajectories of (a) teachers’ reports of children’s aggres-sive and prosocial behaviors, (b) children’s reports of their own behavioral symptomatology, and (c) children’s social-cognitive processes were used as the measures of program influence because of their assessment at four points in time over 2 consecutive school years (fall and spring in 1994 –1995 and 1995–1996) in a cross-sequential design. This study used three parameters (intercept, linear change, and curvilinear change) to define growth trajectories in the three developmental domains of interest.
future aggression and violence to increase over the elementary school years (Aber et al., 1998), other such measures may decrease (Nagin & Tremblay, 2001), and the precise nature of these changes (e.g., linear, curvilinear) may vary.
Second, do children’s developmental trajectories differ for de-mographic subgroups? Most analyses of dede-mographic differences in paths to violence have been based on cross-sectional findings or differences between two points in time. Because there are many different paths between two points, trajectories will be more re-vealing of gender, racial/ethnic, and family-resource differences than will other methods. On the basis of reviews of prior literature, we hypothesized that boys, low-income children, and minority children would demonstrate higher initial levels (intercepts) on measures of aggression than would girls, higher income children, and White children. However, there is insufficient theory or re-search to predict subgroup differences in linear or curvilinear change in these domains of social-emotional development during middle childhood.
Finally, and most important, are children’s developmental tra-jectories modifiable by degree of exposure to a school-based universal violence prevention program? We hypothesized that children whose teachers provided high levels of classroom instruc-tion in the RCCP curriculum would demonstrate lower intercepts and smaller increases in their teachers’ reports of their aggressive behaviors, in their own reports of their behavioral symptomatol-ogy, and most important, in key social-cognitive processes thought to place elementary school children at risk for future aggression and violence.
Method
Procedure
Data for this study were collected in the fall and spring of the 1994 – 1995 and 1995–1996 school years. During the 1994 –1995 school year, the RCCP was implemented in 112 of the 1,067 New York City public elementary, middle, and high schools. This evaluation focused on the children and teachers in 15 of these elementary schools across four school districts in New York City. (Field conditions for Year 1 of data collection necessitated certain design modifications. One school dropped out 6 months after beginning the evaluation, reducing the number of participat-ing schools from 16 to 15.) The elementary schools were initially divided into four groups on the basis of stage of intervention: nonintervention, the beginning stage of intervention, integration of some program components, and integration of all program components. To reduce possible confounds, the schools in each group were drawn equally from four major school districts within the city of New York. Groups of schools were chosen whose student race/ethnicity, poverty status, and school size were compa-rable both across districts and stages of RCCP evolution and that were representative of the public elementary school population in New York City. This quasi-experimental evaluation design (a) allowed the relative effects of no program implementation to be compared with varying levels of implementation, (b) maximized external validity for a test of the pro-gram as implemented on children’s development, and (c) examined whether the RCCP met its own self-defined goals and objectives in these 15 schools. (See Aber et al., 1996, for a full description of the design and rationale of the evaluation.)
Sample
Data for the present article came from all four waves of data collection in both years of the evaluation, and the sample includes first- through
sixth-grade students and their classroom teachers from each of the 15 participating schools. Students who were severely mentally or physically challenged, as identified by school principals, were excluded from the study. Otherwise, all students in each of the 15 participating schools were included in the study unless a “refusal to participate” form was returned by a parent or signed by a student or if a student was discharged from the school. (This passive consent procedure, approved both by the Office of Educational Research at the New York City Board of Education and by the Institutional Review Board of Columbia University, was voluntarily im-plemented by the principal investigator following a waiver of active consent based on a Single Project Assurance, submitted to the Office for Protection from Research Risks of the National Institutes of Health, U.S. Department of Health and Human Services.)
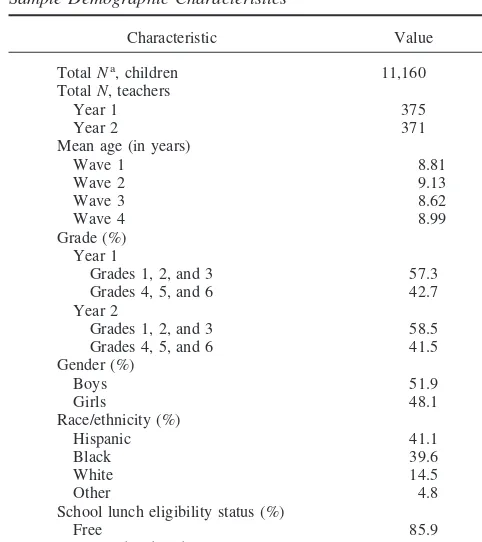
On the basis of these criteria, a total of 11,160 children participated in this study and had nonmissing data in at least one of the four data collection waves across the 2 evaluation years. As shown in Table 1, the sample was 48% female, 40% Black, 41% Hispanic, 14% White, and 5% other (in-cluding Native American and Asian American), and approximately 86% of the sample were receiving free school lunches. On key demographic factors, this sample of children resembled the larger population of children receiving the RCCP. Data were also collected from 375 teachers in Year 1 and 371 teachers in Year 2 of the study.
Overall, rates of participation within waves ranged from 75% to 84% for students and from 80% to 87% for teacher questionnaires. Of the 11,160 children included in this study, approximately 9% participated at only one time point, 42% participated at two time points, 4% at three time points, and 45% at four time points. The low percentage of children participating at only three time points resulted from the infrequent situation in which a child was present in 1 full year of the study and in only one additional wave in the other year because of either dropping out of or entering the school in the middle of the academic year. These within-year and across-year percentages are consistent with the within-year and across-year mobility of
Table 1
Sample Demographic Characteristics
Characteristic Value
TotalNa, children 11,160
TotalN, teachers
School lunch eligibility status (%)
Free 85.9
Full and reduced price 14.1
students in the New York City public school system. One-way analyses of variance used to test for differences between these groups revealed that children who participated at fewer time points scored significantly lower in reading (2
⫽.005) and math (2
⫽.006) achievement in the spring of 1994 and had higher rates of absence during Year 1 (2
⫽.007) and Year 2 (2
⫽.011) of the evaluation than did children who participated more frequently.
Constructs and Variables
Data for the present study were collected from four different sources. Data on exposure to the RCCP curriculum were extracted from Years 1 and 2 of the Management Information System designed and operated by ESR Metro. Student demographic data were gathered from school record information provided by the New York City Board of Education. Key demographic variables included in this analysis were student gender, race/ethnicity (Black, White, Hispanic), and school lunch eligibility status (full price, reduced price, free), which served as a proxy for family socioeconomic status.
Individual student developmental data were collected via child- and teacher-report assessments in both the fall and spring of the 2 consecutive school years. Child-report data were collected by a multiracial field re-search team using classroom-based group administration procedures during classroom periods, whereas teacher-report data on children were collected from individual teachers at the end of each data collection wave.
Levels of intervention. Exposure to the intervention was operational-ized using data on two primary RCCP components: teacher training and coaching in the RCCP and classroom instruction in the RCCP. Additional dimensions of the RCCP include peer mediation, principals’ training, and parent training. These additional program features are much more difficult to reliably and validly measure and therefore were either not operational-ized (administrator and parent training) or not considered in the present article (peer mediation).
Teacher training and coachingis a count of the number of contacts a teacher had with the RCCP and consists of training sessions attended, one-on-one meetings with an RCCP staff developer, and classroom visits by the staff developer. Teachers new to the RCCP receive a 25-hr training course to introduce them to the ideas and skills of conflict resolution and to the RCCP curriculum (see below). Topics addressed during training include active listening, assertiveness, affirmation (building self-esteem), anger management, mediation, celebrating differences, and standing up to bias. In addition to the training, the program design calls for each teacher new to the program to receive 10 visits in the course of the year by an RCCP staff developer, who coaches the teacher in implementing the curriculum in his or her classroom. Coaching consists of demonstration lessons, co-planning and co-facilitation of lessons, observations, and one-on-one conferences.
The number of contacts ranged from 0 to 20 over the course of Year 1 and from 0 to 19 in Year 2, with an average of four contacts in each year. The teacher training and coaching variable was skewed in Year 1 (skew-ness⫽3.56, kurtosis ⫽13.61) and Year 2 (skewness ⫽ 2.33, kurto-sis⫽5.57) because of the large percentage of children whose teachers were either not trained in the RCCP (received no teacher training and coaching: Year 1⫽69%; Year 2⫽62%) or were trained previously but did not report receiving any additional training or coaching (Year 1⫽ 10%; Year 2⫽5%). Thus, both the Year 1 and Year 2 teacher training and coaching variables were recoded into two scales with values ranging from 0 to 4. In each year, children with recoded scale values of 0 had teachers who received no teacher training and coaching. Children with recoded scale values of 1 had teachers in each year who received initial training in the RCCP but no additional training or support. Children with recoded scale values of 2 had teachers in each year who received an average of between 1 and 2 teacher training and coaching sessions. Chil-dren with recoded scale values of 3 had teachers who received between 3
and 5 training and coaching sessions in Year 1 (M⫽4) and between 3 and 7 sessions in Year 2 (M⫽5). Finally, children with recoded scale values of 4 had teachers who received between 6 and 20 training and coaching sessions in Year 1 (M⫽11) and between 8 and 19 sessions in Year 2 (M⫽10). The range of raw score values within each recoded scale value differs between years as a result of approximating equal distributions of children in the nonzero scale categories within each year.
As noted above, the majority of teachers in each year were not trained and received no teacher training and coaching (i.e., those teachers with scores of 0 on the recoded teacher training and coaching scale; see above). The remaining teachers were evenly distributed among the recoded values. In Year 1, for example, 20 teachers (5%) received between 1 and 2 training and coaching sessions, and 23 (6%) received between 6 and 20 sessions. Similarly, in Year 2, 43 teachers (12%) received between 1 and 2 training and coaching sessions, and 32 (9%) received between 8 and 19 sessions. The two recoded scale scores in each year were then summed to equal the total number of contacts that any given child’s Year 1 and Year 2 teachers had with the RCCP over the course of the 2-year evaluation period. This cumulative index of Year 1 and Year 2 teacher training and coaching ranged from 0 to 8 and had a mean of 1.30 (SD ⫽ 1.81, skewness⫽1.15), which, when considered in terms of raw teacher training and coaching, is equivalent to 1 contact. The standard deviation, when considered in terms of raw teacher training and coaching, indicates that 68% of the sample received between 0 and approximately 28 contacts across the 2 years. Forty-two percent of the children in the sample were taught in one or both years by teachers who received at least some teacher training and coaching.
Classroom instruction in the RCCPis composed of the total number of lessons given by trained teachers to children in their classrooms. Lessons given by teachers were based on the RCCP elementary school curriculum and focused on key skills such as active listening, assertiveness, negotia-tion, and problem solving. Across Years 1 and 2, the three most common types of RCCP lessons given were about “communication,” “conflict,” and “feelings,” accounting for almost 40% of the total RCCP lessons taught in Year 1 and Year 2. Skills were taught through role playing, interviewing, small group discussion, and brainstorming.
Although the majority of teachers in each year were not trained and thus implemented no RCCP classroom instruction (i.e., those teachers with scores of 0 on the recoded classroom instruction scale; see above), the remaining teachers were again evenly distributed among the recoded values. In Year 1, for example, 22 teachers (6%) implemented between 1 and 4 lessons, and 22 teachers (6%) implemented between 12 and 27 lessons. Similarly, in Year 2, 33 teachers (9%) implemented between 7 and 11 lessons, and 25 (7%) implemented between 12 and 21 lessons.
The two recoded scale scores in each year were then summed to equal the total number of RCCP lessons to which children had been exposed across the 2 years of the study. This cumulative index of Year 1 and Year 2 classroom instruction ranged from 0 to 10, with an average of 1.48 (SD⫽2.22, skewness⫽1.48), which, when considered in terms of raw lessons, is equivalent to between 1 and 4 lessons. The standard deviation, when considered in terms of raw lessons, indicates that 68% of the sample received between 0 and approximately 28 lessons across the 2 years. Again, 42% of the children in this sample were taught in one or both years of the study by teachers who were trained in the RCCP or who imple-mented at least some RCCP classroom instruction.
The cumulative indices of classroom instruction and teacher training and coaching were strongly positively correlated (r⫽.80) for the sample as a whole but only modestly correlated (r⫽.40) for the subsample (42%) of children whose teachers received some teacher training and coaching and implemented some classroom instruction (i.e., those teachers with recoded scale values for each variable that were greater than or equal to 1). In light of the correlation between teacher training and coaching and classroom instruction, we examined (a) the main effects of each intervention compo-nent while controlling for the effects of the other compocompo-nent and (b) the interaction between teacher training and coaching and classroom instruction.
The outcome measures included in this article were collected from both children and teachers.1On the basis of previous research and
developmen-tal theory, the child-report data were conceptualized as falling within two broad domains: social-cognitive processes and children’s reports of their own behavioral symptomatology. Teacher-report data focused specifically on children’s aggressive and prosocial behaviors as observed by their classroom teachers.2The use of data from teacher reports, child
self-reports, and child responses to hypothetical situations provides a multitrait, multimethod strategy for more rigorously evaluating whether the program is effective in altering the underlying constructs and behaviors targeted by the RCCP and for maximizing the internal validity of the study. Although promoting intergroup understanding is also a major goal of the RCCP, the evaluation research team was unable to identify measures of these pro-cesses in the mid-1990s that were valid, reliable, age-appropriate, as well as amenable to classroom-based administration.
Social-cognitive processes. Three features of children’s social-cogni-tive processes were measured via self-report: children’s hostile attribution biases and their competent and aggressive interpersonal negotiation strat-egies. Children’s hostile attribution biases were measured with an adapta-tion of the Home Interview originally developed by Dodge (1986). This instrument contains six items that assess children’s hostile attributional biases toward peers. Each of six hypothetical vignettes was read aloud while children viewed an accompanying illustration. In each vignette, children were asked to imagine themselves as the recipient of a provocation involving a peer, the cause of which was both visually and verbally ambiguous. Children were then asked about the cause of the provocation, and they selected one of four possible causal attributions. The subscale was created by recoding item responses as either 1 (hostile) or 0 (benign) and then averaging across items. Alphas for this scale ranged from .74 to .78 for the sample as a whole across the four assessment waves.
Competent interpersonal negotiation strategies in proactive situations were measured with the Social Problem Solving Measure developed by Lochman and Dodge (1994). This instrument was designed to assess the interpersonal skill level of children’s selected responses to eight
hypothet-ical vignettes (and their accompanying illustrations), each of which de-scribes a social problem requiring some initiative on the part of the child. The subscale was created by recoding item responses as either 1 ( compe-tent) or 0 (noncompetent) and then averaging across items. Sample alphas across the four waves ranged from .56 to .59.
Aggressive interpersonal negotiation strategies in reactive situations were measured using the Home Interview (Dodge, 1986). Following as-sessment of their attributions of intent, children were asked what they would do next in each of the six scenarios, and they selected from among four possible response strategies. The subscale was created by recoding item responses as either 1 (aggressive) or 0 (nonaggressive) and then averaging across items. Scale reliabilities ranged from .87 to .90 for the sample as a whole across the four waves.
Behavioral symptomatology. Three features of children’s self-reported behavioral symptomatology were measured: self-report levels of conduct problems, depressive symptoms, and aggressive fantasies. Conduct prob-lems were composed of an average of eight items from the Seattle Per-sonality Inventory (Greenberg, 1994). Sample items include “Do you get into a lot of fights?” and “Do you tease or make fun of other kids?” Scale alphas ranged from .73 to .79 across the four waves.
Depressive symptoms were measured as the average of 11 items from the Seattle Personality Inventory (Greenberg, 1994). Sample items include “Do you feel unhappy a lot?” and “Do you feel that most things are not that much fun?” Reliabilities across the four waves ranged from .73 to .76.
Aggressive fantasies were measured using the What I Think instrument (Huesmann & Eron, 1986; Rosenfeld, Huesmann, Eron, & Torney-Purta, 1982). The subscale was calculated as the average of six items, with sample items such as “Do you sometimes have daydreams about hitting or hurting someone you don’t like?” Alphas for this scale ranged from .58 to .63 across the four waves.
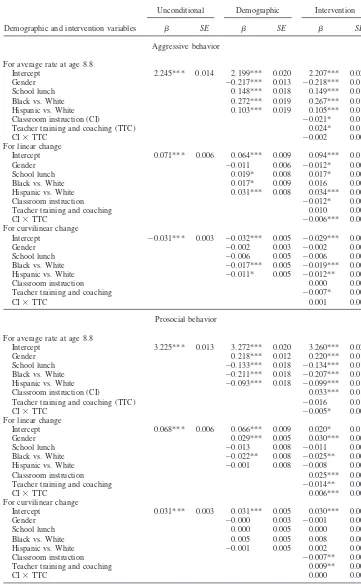
Teacher perceptions of child behavior. Two constructs concerning teachers’ perceptions of children’s behavior were assessed: child aggres-sive behavior and child prosocial behavior. Child aggresaggres-sive behavior comprised an average of six items from the Teacher Checklist (Dodge & Coie, 1987). The measure assesses both reactive and proactive aggression. Child aggressive behaviors were rated by teachers using a 5-point Likert-type scale ranging from 1 (never) to 5 (always). Sample items include “When this child is teased or threatened, he or she gets angry easily” and “This child threatens or bullies others in order to get his or her own way.” The alpha for the total scale was .95 at each of the four assessment waves. Child prosocial behavior was assessed using an average of 19 items from the Social Competence Scale (Conduct Problems Prevention Research Group, 1991). Child prosocial behaviors were rated by teachers using a 5-point Likert type scale ranging from 1 (not at all)to 5 (very well). Sample items include “is helpful to others” and “acts friendly toward others.” Scale alphas for the sample were .98 across each of the four assessment waves. All scale reliabilities were examined by child gender, race/ethnicity, socioeconomic status (i.e., school lunch eligibility), and grade level and were found to be at a minimum above .6 and more frequently above .7 in
1All measures from the evaluation protocol appear in a compendium,
prepared by the Centers for Disease Control and Prevention, of measures used in evaluations of violence prevention programs (Dahlberg et al., 1996).
2Child-report outcomes were originally conceptualized as falling into
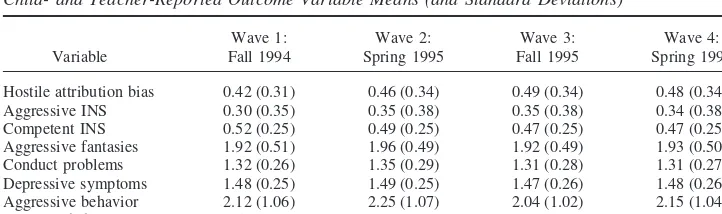
all cases with two exceptions. As with the alphas for the competent strategies and aggressive fantasies scales, the subgroup alphas for these variables also occasionally fell between .5 and .6 and in a few cases dipped below .5, primarily for the youngest children. Means and standard devia-tions of all child- and teacher-reported outcomes are presented in Table 2.
Results
Background
The use of a short-term longitudinal design with repeated mea-sures provides data with a hierarchical or multilevel structure. This article focuses on two levels of the hierarchy: Level 1 units are composed of the repeated assessments over time nested within students; Level 2 units are composed of person-level (between-subjects) characteristics such as demographic factors and exposure to intervention. Because children changed classrooms (and there-fore teachers) between Years 1 and 2 of the evaluation, cumulative exposure to the RCCP across the 2-year period was conceptualized for this article as a person-level characteristic. Year 2 classroom size averaged 23 children. The number of children in Year 2 classrooms who had at least one classmate from their Year 1 classroom in their class ranged from 0 to 23, with an average of 16. On average, four Year 1 classrooms contributed to each Year 2 classroom. Because repeated assessments were expected to be more similar within subjects than between subjects, the assumption of independence may have been violated, thus requiring statistical methods that allow for the decomposition of variance into its within- and between-subjects components.
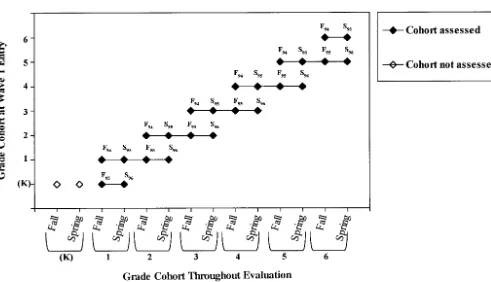
Analyses for this article were conducted using the Hierarchical Linear Modeling (HLM) 5.01 software package, with full maxi-mum likelihood estimation used for all models. HLM allows for the simultaneous estimation of variance associated with individual (within-subject) and population (between-subjects) growth curves based on the specification of fixed- and random-effect variables in the model (Bryk & Raudenbush, 1987, 1992; Burchinal, Bailey, & Snyder, 1994). HLM also allows for missing data at the time-varying (within-subject) level because individual growth curves are assumed to vary systematically around population (between-subjects) growth curves. As such, there may be one or more missing data points in any longitudinal design. In this study, the assessment of an entire subpopulation of first- through sixth-grade children (average ages ranging from 6.0 to 12.5 years) at four different time points enabled us to estimate patterns of growth over time as well as across ages. With each subject’s growth
repre-sented up to four times (and thus at four different ages), we were able to estimate developmental trajectories across age, with each subject having a series of data points that were purposefully incomplete at the time-varying level (see Figure 1). For example, although 7-year-old children in second grade at the Wave 1 as-sessment (fall 1994) were approximately 1 year older and one grade ahead by the Wave 3 assessment (fall 1995), because all children were assessed in each school at each time point, a new cohort of 7-year-old children entered the second-grade sample in the 2nd year (fall 1995), allowing for the synthesis of data from all 7-year-old children at any point in the study.
Each developmental trajectory is composed of an intercept (B0,
estimated score on a given outcome for the mean age of children at Time 1), a slope (B1, estimated linear change over time, i.e.,
across ages 6.0 to 12.5), and a quadratic function (B2, estimated rate of acceleration/deceleration over time, i.e., across ages 6.0 to 12.5). In order to ensure the stability of the intercept, initial status was defined as the mean age of the sample at Time 1. Therefore, the time-varying element, age, was centered on age 8.8. Any differences reported in intercepts should be interpreted in the subsequent figures as differences when the children were 8.8 years old. The use of an accelerated longitudinal design with purpose-fully incomplete data enables outcome scores to be estimated backward to the ages of the youngest children in the sample (⬃6.0 years) and forward to the ages of the oldest children in the sample (⬃12.5 years).
Developmental trajectories estimated in the unconditional mod-els are represented by the following equations:
Level 1 model:
Y(target outcome)⫽0⫹1(age⫺8.8)⫹2(age⫺8.8)2⫹e
Level 2 model: 0⫽00⫹r0
1⫽10⫹r1
2⫽20⫹r2.
Because our parameter estimates for the outcome trajectories were based on a sample that included children with as few as one out of four data points (e.g., approximately 51% had only one or two data points), our ability to adequately detect the significance of the three random components when estimated simultaneously was compromised. To balance the generalizability afforded by this
Table 2
Child- and Teacher-Reported Outcome Variable Means (and Standard Deviations)
Variable
Wave 1: Fall 1994
Wave 2: Spring 1995
Wave 3: Fall 1995
Wave 4: Spring 1996
Hostile attribution bias 0.42 (0.31) 0.46 (0.34) 0.49 (0.34) 0.48 (0.34) Aggressive INS 0.30 (0.35) 0.35 (0.38) 0.35 (0.38) 0.34 (0.38) Competent INS 0.52 (0.25) 0.49 (0.25) 0.47 (0.25) 0.47 (0.25) Aggressive fantasies 1.92 (0.51) 1.96 (0.49) 1.92 (0.49) 1.93 (0.50) Conduct problems 1.32 (0.26) 1.35 (0.29) 1.31 (0.28) 1.31 (0.27) Depressive symptoms 1.48 (0.25) 1.49 (0.25) 1.47 (0.26) 1.48 (0.26) Aggressive behavior 2.12 (1.06) 2.25 (1.07) 2.04 (1.02) 2.15 (1.04) Prosocial behavior 3.63 (0.84) 3.38 (1.01) 3.42 (1.00) 3.47 (0.98)
large sample and to maximize the precision with which we could estimate model parameters, we estimated the random components of the linear and curvilinear parameters sequentially (i.e., fixing the linear component and estimating the curvilinear component and then vice versa). Coefficients across these two models were nearly identical.
For each of the targeted outcomes, results from the uncondi-tional model indicated significant unexplained variation around the intercept, linear, and quadratic parameters. These results suggested that individual children varied significantly in each of the targeted outcomes in intercept, rates, and shape of change over time (across ages 6.0 to 12.5). Modeling the parameters of intercept, linear change, and curvilinear change was therefore necessary to ade-quately understand children’s trajectories on these measures of social-emotional development.
Model Testing
The following sections describe three sets of models designed to address the three questions proposed in this study. For each out-come, the three sets of models to be discussed are as follows: (a) a series of unconditional models estimating the pattern (or course) of developmental growth over 6 years in each outcome for the sample as a whole, not controlling for child demographic charac-teristics and intervention status; (b) a series of conditional models estimating the effects of child demographic characteristics (i.e., gender, school lunch status, and race/ethnicity) on the intercept and rate of growth for each outcome; and (c) a series of conditional models estimating the effects of children’s exposure to each of the two main RCCP intervention components on the growth
trajecto-ries of each outcome, controlling for key child demographic characteristics.
Social-cognitive processes. Results of the models examining unconditional growth for the three constructs measuring children’s social-cognitive processes were highly similar. The correlation (tau) between intercept and growth for each outcome ranged between .27 (for competent interpersonal negotiation strategies) and .55 (for aggressive interpersonal negotiation strategies), indi-cating that children who reported higher levels of competent and aggressive interpersonal negotiation strategies at age 8.8 (inter-cept) also reported greater increases over time.
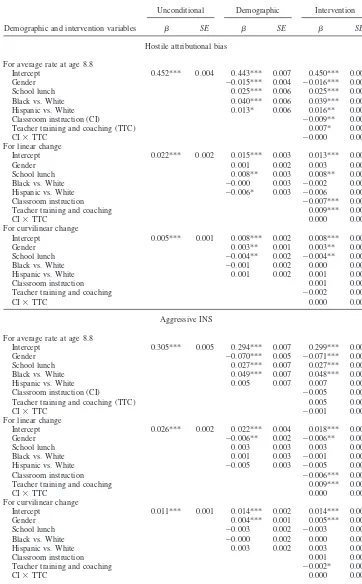
As shown in Table 3 (Unconditional column), the overall pattern of the trajectories for each of these three outcomes was character-ized by significant linear and curvilinear change over time. Spe-cifically, from ages 6.0 to 12.5, the average growth trajectories of hostile attributional bias and aggressive interpersonal negotiation strategies demonstrated positive linear change (t ⫽ 11.72, p⬍ .001, andt⫽12.12,p⬍.001, respectively) and positive curvi-linear change (acceleration;t⫽4.42,p⬍.001, andt⫽9.20,p⬍ .001, respectively). The growth trajectory for competent interper-sonal negotiation strategies was marked by positive linear change (t⫽20.81,p⬍.001) and negative curvilinear change (decelera-tion; t ⫽ ⫺19.13, p ⬍ .001). As shown in Figure 2, hostile attributional bias and aggressive strategies were consistent in level until approximately ages 6.5 and 7.5, respectively; then they ac-celerated up to age 12.5. The positive linear and negative curvi-linear change in competent interpersonal negotiation strategies revealed a trajectory that peaked at approximately age 10.0 and declined thereafter to age 12.5.
Table 3
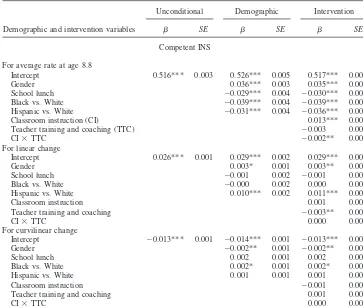
Model Estimates for Growth Trajectories of Children’s Social-Cognitive Processes
Demographic and intervention variables
Unconditional Demographic Intervention
 SE  SE  SE
Hostile attributional bias
For average rate at age 8.8
Intercept 0.452*** 0.004 0.443*** 0.007 0.450*** 0.008
Gender ⫺0.015*** 0.004 ⫺0.016*** 0.004
School lunch 0.025*** 0.006 0.025*** 0.006
Black vs. White 0.040*** 0.006 0.039*** 0.006
Hispanic vs. White 0.013* 0.006 0.016** 0.007
Classroom instruction (CI) ⫺0.009** 0.003
Teacher training and coaching (TTC) 0.007* 0.004
CI⫻TTC ⫺0.000 0.001
For linear change
Intercept 0.022*** 0.002 0.015*** 0.003 0.013*** 0.003
Gender 0.001 0.002 0.003 0.002
School lunch 0.008** 0.003 0.008** 0.003
Black vs. White ⫺0.000 0.003 ⫺0.002 0.003
Hispanic vs. White ⫺0.006* 0.003 ⫺0.006 0.003
Classroom instruction ⫺0.007*** 0.002
Teacher training and coaching 0.009*** 0.002
CI⫻TTC 0.000 0.000
For curvilinear change
Intercept 0.005*** 0.001 0.008*** 0.002 0.008*** 0.002
Gender 0.003** 0.001 0.003** 0.001
School lunch ⫺0.004** 0.002 ⫺0.004** 0.002
Black vs. White ⫺0.001 0.002 0.000 0.002
Hispanic vs. White 0.001 0.002 0.001 0.002
Classroom instruction 0.001 0.001
Teacher training and coaching ⫺0.002 0.001
CI⫻TTC 0.000 0.000
Aggressive INS
For average rate at age 8.8
Intercept 0.305*** 0.005 0.294*** 0.007 0.299*** 0.009
Gender ⫺0.070*** 0.005 ⫺0.071*** 0.005
School lunch 0.027*** 0.007 0.027*** 0.007
Black vs. White 0.049*** 0.007 0.048*** 0.007
Hispanic vs. White 0.005 0.007 0.007 0.007
Classroom instruction (CI) ⫺0.005 0.003
Teacher training and coaching (TTC) 0.005 0.004
CI⫻TTC ⫺0.001 0.001
For linear change
Intercept 0.026*** 0.002 0.022*** 0.004 0.018*** 0.004
Gender ⫺0.006** 0.002 ⫺0.006** 0.002
School lunch 0.003 0.003 0.003 0.003
Black vs. White 0.001 0.003 ⫺0.001 0.003
Hispanic vs. White ⫺0.005 0.003 ⫺0.005 0.003
Classroom instruction ⫺0.006*** 0.002
Teacher training and coaching 0.009*** 0.002
CI⫻TTC 0.000 0.001
For curvilinear change
Intercept 0.011*** 0.001 0.014*** 0.002 0.014*** 0.002
Gender 0.004*** 0.001 0.005*** 0.001
School lunch ⫺0.003 0.002 ⫺0.003 0.002
Black vs. White ⫺0.000 0.002 0.000 0.002
Hispanic vs. White 0.003 0.002 0.003 0.002
Classroom instruction 0.001 0.001
Teacher training and coaching ⫺0.002* 0.001
Next, a series of models testing differences in children’s growth trajectories by gender (girls⫽ 1), school lunch eligibility status (free lunch⫽ 1), and child race/ethnicity (Black⫽ 1, White⫽ ⫺1; Hispanic⫽1, White⫽ ⫺1) are reported in Table 3. To assess the unique effects of each demographic variable on children’s trajectories independent of intervention status, all demographic
variables were tested simultaneously. Demographic differences in trajectories of outcome variables in the domain of children’s social-cognitive processes were highly similar. As shown in Ta-ble 3 (Demographic column), girls reported significantly lower levels of hostile attribution bias (t ⫽ ⫺3.72, p ⬍ .001) and aggressive interpersonal negotiation strategies (t⫽ ⫺15.57,p⬍ Table 3 (continued)
Demographic and intervention variables
Unconditional Demographic Intervention
 SE  SE  SE
Competent INS
For average rate at age 8.8
Intercept 0.516*** 0.003 0.526*** 0.005 0.517*** 0.006
Gender 0.036*** 0.003 0.035*** 0.003
School lunch ⫺0.029*** 0.004 ⫺0.030*** 0.004
Black vs. White ⫺0.039*** 0.004 ⫺0.039*** 0.005
Hispanic vs. White ⫺0.031*** 0.004 ⫺0.036*** 0.005
Classroom instruction (CI) 0.013*** 0.002
Teacher training and coaching (TTC) ⫺0.003 0.002
CI⫻TTC ⫺0.002** 0.001
For linear change
Intercept 0.026*** 0.001 0.029*** 0.002 0.029*** 0.002
Gender 0.003* 0.001 0.003** 0.001
School lunch ⫺0.001 0.002 ⫺0.001 0.002
Black vs. White ⫺0.000 0.002 0.000 0.002
Hispanic vs. White 0.010*** 0.002 0.011*** 0.002
Classroom instruction 0.001 0.001
Teacher training and coaching ⫺0.003** 0.001
CI⫻TTC 0.000 0.000
For curvilinear change
Intercept ⫺0.013*** 0.001 ⫺0.014*** 0.001 ⫺0.013*** 0.001
Gender ⫺0.002** 0.001 ⫺0.002** 0.001
School lunch 0.002 0.001 0.002 0.001
Black vs. White 0.002* 0.001 0.002* 0.001
Hispanic vs. White 0.001 0.001 0.001 0.001
Classroom instruction ⫺0.001 0.001
Teacher training and coaching 0.001 0.001
CI⫻TTC 0.000 0.000
Note. INS⫽interpersonal negotiation strategies. *p⬍.05. **p⬍.01. ***p⬍.001.
.001) and significantly higher levels of competent interpersonal negotiation strategies (t ⫽ 12.39, p ⬍ .001) than did boys at age 8.8 (intercept). For hostile attribution bias, there were no gender differences for linear change; however, girls accelerated significantly faster than boys (t ⫽ 2.77, p ⬍ .01). In addition, compared with boys, girls showed a slower linear increase (t⫽ ⫺2.87,p⬍.01) and a faster rate of acceleration (t⫽3.88,p⬍ .001) in their endorsement of aggressive interpersonal negotiation strategies, and they showed a greater linear increase (t⫽2.36,p⬍ .05) and a faster rate of deceleration in their competent interper-sonal negotiation strategies (t⫽ ⫺2.46,p⬍.01).
To summarize, the primary differences in the shape of the trajectories for girls and boys were consistent across the three outcomes in the social-cognitive developmental domain. Overall, from ages 6.0 to 12.5, girls had lower levels of aggressive and higher levels of competent interpersonal negotiation strategies, and they exceeded boys in levels of hostile attribution bias beginning at age 11.0. In all three outcomes, girls initially declined faster in risk than did boys (i.e., they had faster decreases in hostile attri-bution bias and aggressive interpersonal negotiation strategies between ages 6.0 and approximately 8.5 and faster increases in competent interpersonal negotiation strategies between ages 6.0 and 10.0). This initial decline in risk for girls was followed by faster increases in risk than were evidenced for boys (i.e., faster increases in hostile attribution bias and aggressive interpersonal negotiation strategies between ages 8.5 and 12.5 and faster de-creases in competent interpersonal negotiation strategies between ages 10.0 and 12.5). Said another way, girls initially declined but then caught up to (and exceeded in the case of hostile attribution biases) boys in each of the variables in this domain.
Although the graphic representation of all significant demo-graphic subgroup effects is not possible given space limitations, the general shape of gender differences in growth trajectories across outcomes in this domain is illustrated in Figure 3 for aggressive interpersonal negotiation strategies. Note that some convergence in trajectories at the extremes of the age span is due to the length of the (age) series being predicted, with smaller variances for the intercept, slope, and quadratic effects leading the fitted curves to be “pulled” to the average.
Children who received free school lunches reported signifi-cantly higher levels at age 8.8 (intercept) of hostile attribution bias (t ⫽ 3.89, p ⬍ .001) and aggressive interpersonal negotiation strategies (t⫽4.01,p⬍ .001) and significantly lower levels of competent interpersonal negotiation strategies (t ⫽ ⫺6.66, p⬍ .001) than did children who received reduced price or full price lunches (see Table 3, Demographic column). Differences in the shape of growth, however, were seen only for trajectories of hostile attribution bias. Children who received free school lunches had a greater linear increase (t⫽2.71,p⬍.01) and a slower rate of acceleration (t ⫽ ⫺2.64, p ⬍ .05) than did children who received reduced price or full price lunches. Compared with chil-dren who received reduced or full price lunches, free-lunch-eligible children initially had lower levels of hostile attribution bias (between ages 6.0 and 7.0) followed by higher levels (between ages 7.5 and 12.0) and then lower levels again by age 12.5.
Compared with White children, Black and Hispanic children reported significantly higher levels at age 8.8 (intercept) of hostile attribution biases (t⫽ 6.18, p⬍ .001, and t⫽ 2.04, p⬍ .05, respectively) and of aggressive interpersonal negotiation strategies (only Black vs. White was significant;t⫽7.24,p⬍ .001) and significantly lower levels of competent interpersonal negotiation strategies (t ⫽ ⫺8.53, p ⬍ .001, and t ⫽ ⫺6.81, p ⬍ .001, respectively). For hostile attribution bias, Hispanic children had a slower linear increase than White children (t⫽ ⫺1.93,p⬍.05), evidencing higher levels between ages 6.0 and approximately 10.0, after which levels were almost equivalent to those of White chil-dren up until age 12.5. Linear differences in hostile attribution bias between Black and White children were not significant, and no race/ethnicity differences in curvilinear change were detected. Further, there were no linear or curvilinear effects of child race/ ethnicity on trajectories of aggressive interpersonal negotiation strategies.
For competent interpersonal negotiation strategies, Black and White children showed equivalent levels of linear increase; how-ever, Black children had a slower rate of deceleration than White children (t⫽2.08,p⬍.05). Overall, from ages 6.0 to 12.5, Black children had lower levels of competent interpersonal negotiation strategies than did White children, and although both showed
initial increases between ages 6.0 and 9.5, followed by declines between ages 9.5 and 12.5, these shifts were slower for Black children, which resulted in almost equivalent levels of risk again by age 12.5. Further, Hispanic children had a greater linear in-crease in competent strategies than did White children (t⫽5.14,
p⬍.001), evidencing lower levels until age 11.0.
A final series of conditional models simultaneously tested the main and interaction effects of RCCP classroom instruction and teacher training and coaching. It must be noted that because of the co-occurrence of data collection and children’s exposure to the RCCP in the fall of Year 1 of the evaluation, significant intercept differences in these conditional intervention models can be inter-preted in two ways. First, because some children received the RCCP intervention prior to the age at which we defined the intercept (e.g., those children who were 8.8 years old in Year 2 of the evaluation and as such were likely to have been exposed to the RCCP in Year 1 when they were 1 year younger), significant differences in intercepts may actually reflect “pre-intercept” inter-vention effects, resulting in differences at age 8.8 that may be due to receipt of the intervention and not to pre-intervention differ-ences. Second, intercept differences may also be related to selec-tion bias associated with features of classroom composiselec-tion. Spe-cifically, it is possible that classrooms with lower average levels of aggression (i.e., classrooms in which children are more inclined toward positive change) elicit greater amounts of classroom in-struction. For both of these reasons, we report, but pay little attention to, the effects of classroom instruction and teacher train-ing and coachtrain-ing on intercepts. Rather, we focus on how these program components influenced the growth parameters, because these parameters are estimated net of any intercept differences (i.e., pre-intervention differences) and control for possible selec-tion bias.
Classroom instruction and teacher training and coaching in the RCCP had consistent and opposite effects on trajectories of chil-dren’s social-cognitive processes. Specifically, higher levels of classroom instruction were associated with (a) lower levels of hostile attribution bias (t⫽ ⫺2.72,p⬍.01) and higher levels of competent interpersonal negotiation strategies (t⫽5.59,p⬍.001) at age 8.8 (intercept) and (b) linear decreases in hostile attribu-tional bias (t⫽ ⫺4.06,p⬍.001) and aggressive strategies (t⫽ ⫺3.32,p ⬍ .001; see Table 3, Intervention column). Levels of classroom instruction were not associated with linear change in competent interpersonal negotiation strategies or with curvilinear change in any of the three outcomes in this developmental domain. In contrast, higher levels of teacher training and coaching were significantly associated both with a higher intercept level and with a linear increase in hostile attribution bias (t⫽1.99,p⬍.05, and
t⫽4.67,p⬍.001, respectively), as well as with a linear decline in competent strategies (t⫽ ⫺2.48,p⬍.01; see Table 3). Higher levels of teacher training and coaching were also associated with a greater linear increase (t⫽4.47,p⬍.001) and a slower rate of acceleration (t⫽ ⫺2.04,p⬍.05) in aggressive strategies.
Behavioral symptomatology. The association (tau) between
intercept and slope was weak in the unconditional models of the average growth trajectory for children’s aggressive fantasies (⫽ ⫺.04) and depressive symptoms (⫽.03). This association was positive and moderate in size for the unconditional growth trajec-tory of conduct problems (⫽.49).
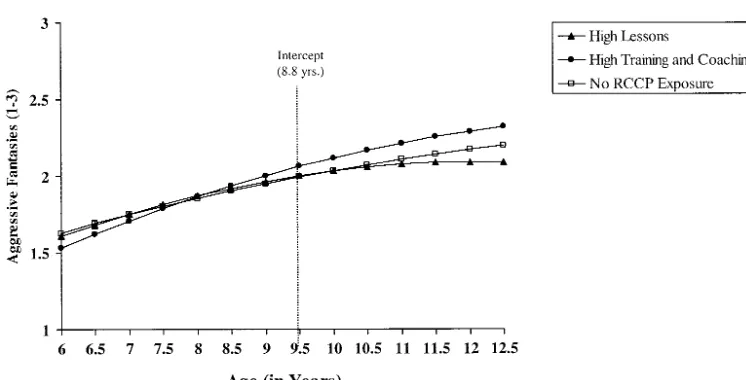
Although the unconditional models for the three outcomes in this domain revealed significant linear change, two of the three were characterized by significant curvilinear change as well (see Table 4, Unconditional column). Specifically, as shown in Fig-ure 4, the average growth trajectory from ages 6.0 to 12.5 for both aggressive fantasies and conduct problems was characterized by positive linear change (t⫽37.72,p⬍.001, andt⫽13.22,p⬍ .001, respectively) and by significant negative curvilinear change (deceleration) for aggressive fantasies (t⫽ ⫺2.14,p⬍.05). The unconditional growth trajectory for depressive symptoms included significant negative linear (t⫽ ⫺4.08,p⬍.001) and curvilinear (t⫽ ⫺3.72,p⬍.001) change.
Tests of demographic differences in the level and shape of these trajectories revealed that, compared with boys at age 8.8, girls reported significantly lower levels of aggressive fantasies (t ⫽ ⫺8.65,p⬍.001) and conduct problems (t⫽ ⫺13.61,p⬍.001) and significantly higher levels of depressive symptoms (t⫽6.87,
p ⬍ .001; see Table 4, Demographic column). Girls and boys showed equivalent linear increases in aggressive fantasies and conduct problems. Girls, however, had a slower rate of decelera-tion than boys in aggressive fantasies (t⫽3.06,p⬍.01) and were accelerating slightly in conduct problems relative to the decelera-tion demonstrated by boys (t⫽2.58,p⬍.01). No gender differ-ences were detected in linear or curvilinear change for depressive symptoms. Thus, although girls had lower levels than boys in aggressive fantasies between ages 6.0 and 11.5, and lower levels of conduct problems between ages 6.0 and 12.5, their slower decel-eration in aggressive fantasies and slower acceldecel-eration in conduct problems (compared with the deceleration of boys) placed them at greater or almost equal levels of risk, respectively, by age 12.5.
No school lunch differences in intercept, linear, or curvilinear change were detected in aggressive fantasies. Children who re-ceived free school lunches reported higher levels of conduct prob-lems (t⫽3.50,p⬍.001) and depressive symptoms (t⫽5.29,p⬍ .001) at age 8.8 and greater linear increases in conduct problems (t⫽2.75,p⬍.01) than did children who received reduced price or full price lunches. No significant linear or curvilinear changes in depressive symptoms were found.
Differences in trajectories by child race/ethnicity at age 8.8 (intercept) were detected for each of the three outcomes in this domain (see Table 4, Demographic column). With the exception of the Hispanic versus White comparison for the intercept of aggres-sive fantasies, compared with White children, Black and Hispanic children had higher age 8.8 levels of aggressive fantasies (t⫽9.09,
p⬍.001, Black only), conduct problems (t⫽6.16,p⬍.001, and
t ⫽ 2.78, p ⬍ .01, respectively), and depressive symptoms (t⫽8.84,p⬍.001, andt⫽ 7.23,p⬍ .001, respectively). For aggressive fantasies, Black and Hispanic children both had a greater linear increase than White children (t⫽4.35,p⬍.001, and
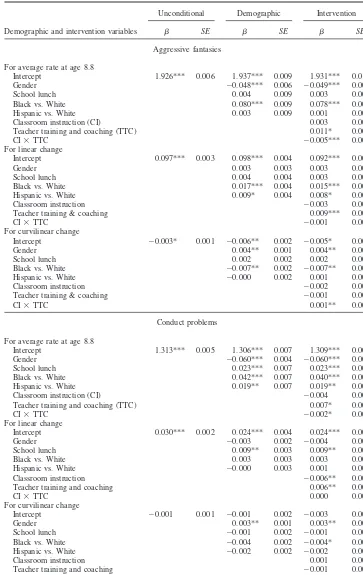
Table 4
Model Estimates for Growth Trajectories of Children’s Behavioral Symptomatology
Demographic and intervention variables
Unconditional Demographic Intervention
 SE  SE  SE
Aggressive fantasies
For average rate at age 8.8
Intercept 1.926*** 0.006 1.937*** 0.009 1.931*** 0.011
Gender ⫺0.048*** 0.006 ⫺0.049*** 0.006
School lunch 0.004 0.009 0.003 0.009
Black vs. White 0.080*** 0.009 0.078*** 0.009
Hispanic vs. White 0.003 0.009 0.001 0.009
Classroom instruction (CI) 0.003 0.005
Teacher training and coaching (TTC) 0.011* 0.005
CI⫻TTC ⫺0.005*** 0.001
For linear change
Intercept 0.097*** 0.003 0.098*** 0.004 0.092*** 0.005
Gender 0.003 0.003 0.003 0.003
School lunch 0.004 0.004 0.003 0.004
Black vs. White 0.017*** 0.004 0.015*** 0.004
Hispanic vs. White 0.009* 0.004 0.008* 0.004
Classroom instruction ⫺0.003 0.002
Teacher training & coaching 0.009*** 0.002
CI⫻TTC ⫺0.001 0.001
For curvilinear change
Intercept ⫺0.003* 0.001 ⫺0.006** 0.002 ⫺0.005* 0.003
Gender 0.004** 0.001 0.004** 0.001
School lunch 0.002 0.002 0.002 0.002
Black vs. White ⫺0.007** 0.002 ⫺0.007** 0.002
Hispanic vs. White ⫺0.000 0.002 0.001 0.002
Classroom instruction ⫺0.002 0.001
Teacher training & coaching ⫺0.001 0.001
CI⫻TTC 0.001** 0.000
Conduct problems
For average rate at age 8.8
Intercept 1.313*** 0.005 1.306*** 0.007 1.309*** 0.008
Gender ⫺0.060*** 0.004 ⫺0.060*** 0.004
School lunch 0.023*** 0.007 0.023*** 0.007
Black vs. White 0.042*** 0.007 0.040*** 0.007
Hispanic vs. White 0.019** 0.007 0.019** 0.007
Classroom instruction (CI) ⫺0.004 0.003
Teacher training and coaching (TTC) 0.007* 0.004
CI⫻TTC ⫺0.002* 0.001
For linear change
Intercept 0.030*** 0.002 0.024*** 0.004 0.024*** 0.004
Gender ⫺0.003 0.002 ⫺0.004 0.002
School lunch 0.009** 0.003 0.009** 0.003
Black vs. White 0.003 0.003 0.003 0.003
Hispanic vs. White ⫺0.000 0.003 0.001 0.003
Classroom instruction ⫺0.006** 0.002
Teacher training and coaching 0.006** 0.002
CI⫻TTC 0.000 0.001
For curvilinear change
Intercept ⫺0.001 0.001 ⫺0.001 0.002 ⫺0.003 0.002
Gender 0.003** 0.001 0.003** 0.001
School lunch ⫺0.001 0.002 ⫺0.001 0.002
Black vs. White ⫺0.004 0.002 ⫺0.004* 0.002
Hispanic vs. White ⫺0.002 0.002 ⫺0.002 0.002
Classroom instruction 0.001 0.001
Teacher training and coaching ⫺0.001 0.001
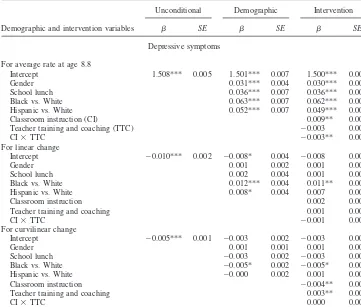
No significant child race/ethnicity differences in linear or cur-vilinear change were detected in the growth trajectory of conduct problems. For depressive symptoms, Black children had a slight linear increase compared with the linear decline evidenced by White children (t⫽3.42,p⬍.001), although the rate of decel-eration for Black children was faster (t ⫽ ⫺2.34, p ⬍ .05).
Hispanic children had a slower linear decline in depressive symp-toms than did White children (t⫽2.11,p⬍.05). Thus, Black and Hispanic children had higher overall levels of depressive symp-toms than did White children between ages 6.0 and 12.5, and although there was a slower rate of decline for Hispanic (linear change only) and Black children (deceleration), both remained at Table 4 (continued)
Demographic and intervention variables
Unconditional Demographic Intervention
 SE  SE  SE
Depressive symptoms
For average rate at age 8.8
Intercept 1.508*** 0.005 1.501*** 0.007 1.500*** 0.009
Gender 0.031*** 0.004 0.030*** 0.004
School lunch 0.036*** 0.007 0.036*** 0.007
Black vs. White 0.063*** 0.007 0.062*** 0.007
Hispanic vs. White 0.052*** 0.007 0.049*** 0.007
Classroom instruction (CI) 0.009** 0.003
Teacher training and coaching (TTC) ⫺0.003 0.004
CI⫻TTC ⫺0.003** 0.001
For linear change
Intercept ⫺0.010*** 0.002 ⫺0.008* 0.004 ⫺0.008 0.005
Gender 0.001 0.002 0.001 0.002
School lunch 0.002 0.004 0.001 0.004
Black vs. White 0.012*** 0.004 0.011** 0.004
Hispanic vs. White 0.008* 0.004 0.007 0.004
Classroom instruction 0.002 0.002
Teacher training and coaching 0.001 0.002
CI⫻TTC ⫺0.001 0.001
For curvilinear change
Intercept ⫺0.005*** 0.001 ⫺0.003 0.002 ⫺0.003 0.003
Gender 0.001 0.001 0.001 0.001
School lunch ⫺0.003 0.002 ⫺0.003 0.002
Black vs. White ⫺0.005* 0.002 ⫺0.005* 0.002
Hispanic vs. White ⫺0.000 0.002 0.001 0.002
Classroom instruction ⫺0.004** 0.001
Teacher training and coaching 0.003** 0.001
CI⫻TTC 0.000 0.000
*p⬍.05. **p⬍.01. ***p⬍.001.