Journal Homepage: www.jitecs.ub.ac.id
Optimization of Healthy Diet Menu Variation using
PSO-SA
Imam Cholissodin1, Ratih Kartika Dewi2
Faculty of Computer Science, Computer Science, Brawijaya University Veteran Road 8, 65145 Malang, Indonesia
{imamcs, ratihkartikad}@ub.ac.id
Received 06 April 2017; accepted 22 June 2017
Abstract. Optimal healthy diet in accordance with the allocation of cost needed so that the level of nutritional adequacy of the family is maintained. The problem of optimal healthy diet (based on family budget) can be solved with genetic algorithm. The algorithm particle swarm optimization (PSO) has the same effectiveness with genetic algorithm but PSO is superior in terms of efficiency, PSO algorithm has a lower complexity than genetic algorithm. However, genetic algorithms and PSO have a problem of local optimum because these algorithm associated with random numbers. To overcome this problem, PSO algorithm will be improved by combining it with simulated annealing algorithm (SA). Simulated annealing algorithm is a numerical optimization algorithms that can avoid local optimal. From our results, optimal parameter for PSO-SA are popsize 280, crossover rate 0.6, mutation rate 0.4, first temperature 1, last temperature 0.2, alpha 0.9, and generation size 100.
Keywords: PSO, SA, optimization, variation, healthy diet menu.
1.
Introduction
Nutritional adequacy is required by everyone. When nutritional needs are met, the body’s metabolism and activity can be optimized. Each individual has different nutritional needs and can be known through the Nutrition Adequacy Score (AKG). AKG is recommended nutritional intake based on scientific research that should be considered in order to meet the nutritional needs of everyone (Hartono, 2006). AKG are arranged by age, gender, height, and weight.
with the allocation of cost, then it is required to optimize healthy diet menu so the cost does not exceed the budget, and still meets the nutritional needs.
The problem formulation these research can be solved with a heuristic method based on the mechanisms of biological evolution. One method that can be used is genetic algorithm. Genetic algorithms are optimization algorithm adopting natural selection processes of living beings, which stages reshuffle the genes to adapt its environment so that only the best individuals can be survived. In the genetic algorithm, solution to the problem can be represented by chromosomes. Chromosomes go through the process of reproduction, evaluation, and selection to find the best solution based on the highest fitness values.
Research topics regarding cost optimization of nutritional needs have been conducted by genetic algorithm (Pratiwi, Mahmudy, Dewi, 2014). The results from these studies recommends one meal for one person using genetic algorithm. Particle Swarm Optimization (PSO) Algorithm has the same effectiveness of problem solving as genetic algorithm but PSO is more efficient than genetic algorithm (Eliantara, Cholissodin, Indriati, 2016), because PSO has lower algorithm complexity than genetic algorithm (Hassan, Cohanim, & Weck, 2004).
Genetic algorithm and PSO have the same problem of uncertainty to obtain the optimal global solution (stuck in a local optimum), it’s because these algorithms associated with random numbers (Hapsoro, Anita, Basith, & Dinna, 2008). To overcome the problem of local optimum, PSO algorithm will be improved by combining it with Simulated Annealing algorithm (SA). Simulated Annealing algorithm is an optimization algorithms which properties can avoid local optimal. Based on this idea, a combination of Particle Swarm Optimization (PSO) algorithm and Simulated Annealing (SA) is expected to optimize the problem of healthy diet menu variation.
2
Healthy Food and Nutrition
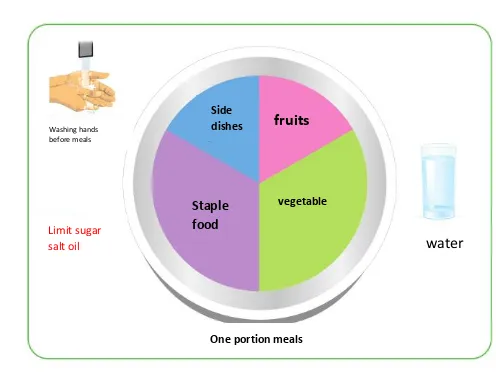
Figure 1 Perfect portion sizes once eating (Source : http://gizi.depkes.go.id)
AKG is the adequacy of the level of consumption so as to level of production and food supply need to be considered lost nutrient content ranging from production to consumption levels (Ministry of Health, 2013). Nutritional needs in general can be classified as protein, fat and carbohydrate.
Protein arranged from amino acids. Protein contained in food can come from animals (animal protein) or from plants (vegetable protein). The composition of amino acids in animal protein is suitable with human needs, but the price is relatively expensive. To maintain protein quality in a daily diet, it is recommended to consume food that contain animal protein to fulfill daily need (Afandie, Cholissodin, & Supianto, 2015).
Fat is composed from several elements: carbon (C), hydrogen (H) and oxygen (O). Fat in ordinary temperatures has a liquid form that are called oil and can be solid form in cold temperature that are called fat. Fat is generally not soluble in water, but it can be soluble in non-polar solvents such as benzene, chloroform and carbon tetrachloride. Fat has several function for the body such as efficient energy source, vitamin solvent and it can be essential fatty acids source (Sumardjo, 2006).
Washing hands before meals
Limit sugar
salt oil water
Side
dishes fruits
Staple food
vegetable
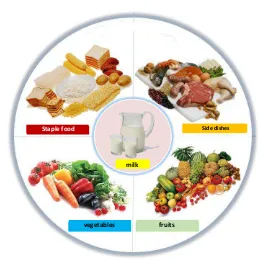
Figure 2 Benefits of 4 Healthy 5 Perfect Food (Source : http://www.frewaremini.com)
Carbohydrate composed from several elements such as carbon (C), hydrogen (H) and oxygen (O). Carbohydrate has an important role for the body because it is the main energy source for human. All carbohydrates derived from plants. Carbohydrate are divided into two groups: simple carbohydrate and complex carbohydrate. Carbohydrate in our body can be used as fuel (glucose), the food reserves (starch from plants and glycogen from animals), and the builder material (cellulose in plants, chitin in animals and fungi).
3.
Particle Swarm Optimization
PSO (Particle Swarm Optimization) is an optimization procedures based on the metaphor of communication and social interaction of animals group like a group of birds or fish. PSO will be simulated with specific dimension within a number of iterations so that in each iteration, the particle's position will increasingly lead to the intended target (minimizing or maximizing functions until the maximum iteration or other termination criteria achieved (Krisnawati, 2011). Equation 1 is the elaboration of PSO approach (Chen, et al, 2011):
Equation 1 represents the best previous position of the particle i which gives the best value as vector Pi or pbest. Vector particles (Pg) is the best particles among all particles in population, which is known as gbest.r 1 and r 2 are random numbers
generated between the 0 and 1 values. At each iteration, the value of weight function (W) be updated through Equation 3:
𝑊𝑚𝑎𝑥 = 𝑊𝑚𝑎𝑥 − 𝑊𝑚𝑎𝑥−𝑊𝑚𝑖𝑛𝑖𝑡𝑒𝑟 𝑚𝑎𝑥 ∗ 𝑖𝑡𝑒𝑟 (3)
From Equation 3, wmax is the constanta of the first weight value (inertia) and wmin is the constanta of the last weight value. Iter max is the maximum number of iterations and Iter is the number of the last iteration.
From Equation 3, the change of velocity will be close to pbest. With the velocity changing, then there is also a change in the position of an agent in each iteration that can be calculated by the following equation with s is the position of the agent and v is the agent’s velocity.
𝑆𝑖𝑘+1= 𝑆𝑖𝑘+ 𝑣𝑖𝑘+1
(4)
4.
Simulated Annealing
Simulated annealing algorithm is an optimization algorithm that based on annealing (cooling process in metal material). Annealing process itself can be interpreted as a constant decrease of the temperature in solid object that had previously been heated in a condition where this object reaches its freezing point. This cooling process requires slow temperature changing to obtain the characteristics of good metal. Irregular temperature changing results in disability of solid object because there is only local structures that can be optimized. Simulated annealing can be described in these steps (Lakshitasari, Suprajitno, and Damayanti, 2014):
1. Initialize the initial temperature Tnow
2. Initialize the initial population, i = 1, 2, ..., population_size. 3. Evaluation of the initial population as a temporary solution (vi).
4. Modification of the initial population vm and evaluate it as a new solution (vm).
5. If (vm)≤(vi), a new solution is the temporary solution. If not, then calculate
the probability P = exp (-Δ fT). Where Δf represents the difference between (vi ) and (vm), while T is the current temperature. Generate a random number
r in the [0,1] interval. If P >r then the new solution remains acceptable as a temporary solution.
5.
PSO-SA
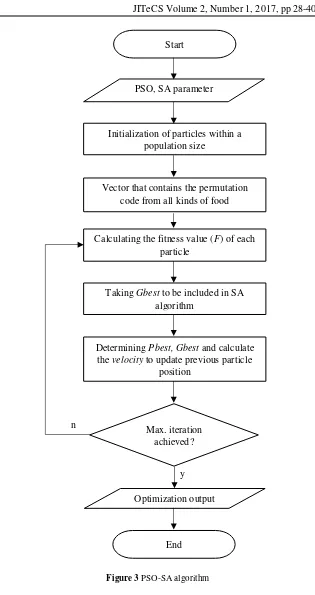
PSO-SA algorithm starts from parameter initialization, providing a variety of diet menu and also its nutrition, until the optimization process to produce a recommendation of healthy diet menu over a dynamic time period. Fig. 3 shows PSO-SA algorithm and here are the steps of PSO-SA:
a) Initialization of particles within a population size that generates a vector that contains the permutation code from all kinds of food including breakfast, lunch, and dinner of family members, such as father, mother, children, and grandparents.
b) Calculating the fitness value (F) of each particle with the following objective function (Hamidah, Cholissodin, and Nurwarsito, 2016).
F = 1 / (ph + pp + pl + pk + k) (5)
Where ph is a penalty of price, pp is the penalty of protein, pl is a penalty of fat, pk is a penalty of carbohydrates and k is similarity from selected menu variation.
c) Taking Gbest to be included in SA algorithm by using neighborhood search operators.
d) Determining Pbest, Gbest and calculate the velocity to update previous particle position.
Figure 3 PSO-SA algorithm n
Start
PSO, SA parameter
Initialization of particles within a population size
Vector that contains the permutation code from all kinds of food
Calculating the fitness value (F) of each particle
Taking Gbest to be included in SA algorithm
Determining Pbest, Gbest and calculate the velocity to update previous particle
position
Max. iteration achieved?
y
Optimization output
// Start PSO-SA
// 1. Initialization of particles within a population size // 2. Update Velocity
// 3. Update Position and calculate fitness // 4. Update Pbest dan Gbest
// if itermax not achieved, back to (2)
// 1. Initialization of velocity
int[][] Kecepatan = PsoSa.InisialisasiKecepatan(PopSize,
PanjangDimensiPartikel);
// Inisialisasi Posisi Awal Partikel
int[][] Posisi = PsoSa.InisialisasiPosisi(PopSize,
PanjangDimensiPartikel, 55);
// Initialization Pbest and Gbest
int[][] Pbest = Posisi;
double[] fitnessPbest = PsoSa.FitnessXPbest(Pbest, Type,
Jk, Energi,
Karbohidrat, Protein, Lemak);
double fitnessGbest = PsoSa.FitnessGbest(fitnessPbest);
// or by fitnessGbest = PsoSa.FitnessGbest2(fitnessPbest);
int[][] Gbest = PsoSa.GetGbest(Pbest, fitnessPbest);
w = wmin + ((wmax-wmin)*((MaxIterasi-i)/MaxIterasi)); Kecepatan = PsoSa.UpdateKecepatan(Vlama, Posisi, Pbest, Gbest, w, c1, c2);
// 3. Update position and calculate fitness
int[][] Posisibaru = PsoSa.UpdatePosisi(Kecepatan,
Posisi);
Posisi = Posisibaru;
double[] fitnessPosisi = PsoSa.FitnessXPbest(Posisi, Type, Jk, Energi,
//fitnessPbest = PsoSa.FitnessXPbest(Pbest, Type, Jk, Energi,Karbohidrat, Protein, Lemak);
double[] fitnessPbestbaru =
PsoSa.GetFitnessFromUpdatePbest(fitnessPbest, fitnessPosisi); fitnessPbest = fitnessPbestbaru;
Gbest = PsoSa.GetGbest(Pbest, fitnessPbest);
String DimensiPartikelDalamString = "";
for (int j = 0; j < PanjangDimensiPartikel; j++) {
DimensiPartikelDalamString =
DimensiPartikelDalamString + " " +
String.valueOf(Gbest[0][j]);
}
Hasil h = new Hasil();
h.dim = i + 1; // dim =iteration
h.partikel = DimensiPartikelDalamString;
h.fitness = (float) fitnessGbest;
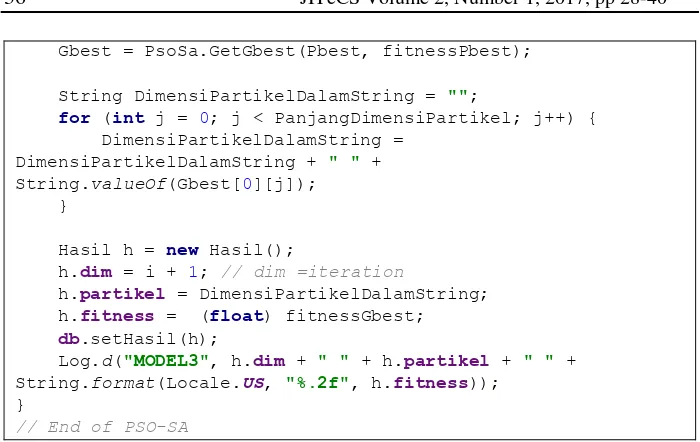
Figure 4 Snippet Code PSO-SA (Android)
Based on Fig. 4, determination of the initial particle is affected by population size. For example, P1, P2, P3 are individuals that formed in the early initialization phase that consists of 24 agents as shown in Table 1. These agents are the basis for determining the combination of healthy diet menu for two days that consist of four kinds of nutritions, there are carbohydrate, animal protein, vegetable protein, and fat. Random number from 1 to 55 are generated for each agent. The range number, 1 until 55, are chosen to simplify particle formation and also the algorithm process. These random number will later be normalized to fit the existing data.
Table 1 Initialization of Particles
These random number will be calculated by the Equation 6 to determine gen index. Where x is the number of members in i, y is the value of gene j, z is the upper limit of the permutation number.
𝐼𝑛𝑑𝑒𝑥 𝑜𝑓 𝑔𝑒𝑛 𝑖 = ((𝑥 − 1) (𝑦−1𝑧−1)) + 1 (6)
velocity to update previous particle position.
6.
Results and Discussion
The first page of application is shown in Fig. 5. First, user can choose Settings icon to set the parameter value of PSO-SA. Then, user can click PSO-SA button to perform healthy diet menu optimization, the optimization results will be displayed in the result button.
Figure 5 Main Page
This results can be shown in Fig. 6, PSO-SA algorithm can be used to optimize the family’s healthy diet menu, it works by minimizing the cost and still be able to meet the nutritional needs for the entire family.
Figure 7 PSO-SA Page
If user selects the PSO-SA button, as shown in Fig. 7, user can obtain several parameter values of PSO-SA optimization.
Table 2 Test for population size value
Pop size=10 Pop size=50 Pop size=100 Pop size=280 Nutrition
fitness
27.032 21.274 43.353 54.505
Price fitness 51.39 60.28 57.90 62.76 Overall fitness 98,424 99.554 121.250 135.267
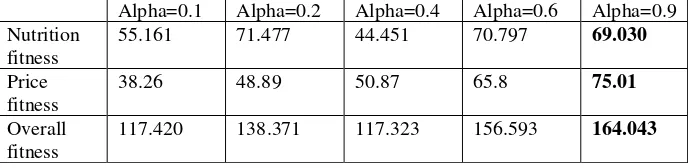
From Table 2, we can conclude that the best value for population size is 280, Table 3 is the test for alpha value with population size is 280. When alpha is 0.1, value of nutrition fitness is 55.161 and price fitness is 38.26 so that overall fitness is 117.420. When alpha is 0.2, value of nutrition fitness is 71.477 and price fitness is 48.89 so that overall fitness is 138.371. When alpha is 0.4, value of nutrition fitness is 44.451 and price fitness is 50.87 so that overall fitness is 117.323. When alpha is 0.6, value of nutrition fitness is 70.797 and price fitness is 65.8 so that overall fitness is 156.593. When alpha is 0.9, value of nutrition fitness is 69.030 and price fitness is 75.01 so that overall fitness is 164.043. From Table 3, we can conclude that the best alpha value is 0.9 with overall fitness is 164.043.
Table 3 Test for alpha value
Alpha=0.1 Alpha=0.2 Alpha=0.4 Alpha=0.6 Alpha=0.9 Nutrition
117.420 138.371 117.323 156.593 164.043
From Table 2 and 3, we can conclude that the best parameter value for healthy diet menu optimization using PSO-SA are popsize 280, crossover rate 0.6, mutation rate 0.4, first temperature 1, last temperature 0.2, alpha 0.9, and generation size 100.
7.
Conclusion
References
1. Afandie, M. N., Cholissodin, I., Supianto, A. A. (2014). Implementasi Metode K-Nearest Neighbor Untuk Pendukung Keputusan Pemilihan Menu Makanan Sehat Dan Bergizi. DORO: Repository Jurnal Mahasiswa FILKOM Universitas Brawijaya, vol. 3, no. 1. 2. Hamidah, C. P., Cholissodin, I., Nurwarsito, H. (2016). Optimasi Susunan Bahan Makanan
Untuk Pemenuhan Gizi Keluarga Menggunakan Hybrid Algoritma Genetika Dan Simulated Annealing. DORO: Repository Jurnal Mahasiswa FILKOM Universitas Brawijaya, vol. 8, no. 26.
3. Eliantara F., Cholissodin I., Indriati, 2016. Optimasi Pemenuhan Kebutuhan Gizi Keluarga Menggunakan Particle Swarm Optimization. Prosiding Seminar Nasional Riset Terapan (SNRT), Politeknik Negeri Banjarmasin, 9-10 Nopember.
4. Hartono, A. (2006). Terapi Gizi dan Diet Rumah Sakit, Ed. 2. Jakarta: ECG.
5. Hassan, R., Babak, C., & Olivier, W. (2004). A Comparison of Particle Swarm Optimization and The Genetic Algorithm. American Institute of Aeronautical and Astronautics, 1-13. 6. Pratiwi, M. I., Mahmudy, W. F., & Dewi, C. (2014). Implementasi Algoritma Genetika Pada
Optimasi Biaya Pemenuhan Gizi. DORO: Repository Jurnal Mahasiswa FILKOM Universitas Brawijaya, vol. 4, no. 6.
7. Repi, A., Kawengian, S. E., & Bolang, A. S. (2014). Hubungan Antara Status Sosial Ekonomi Dengan Status Gizi Anak Sekolah Dasar Kelas 4 Dan Kelas 5 Sdn 1 Tounelet Dansd Katolik. Universitas Sam Ratulangi Manado, 2.
8. Rukmana, R. (2003). Usaha Tani Kapri. Yogyakarta: Kanisius.