CHAPTER III RESEARCH METHOD
A.Research Type
This study used the quantitative research type which makes use of numbers
and statistical data to analyze and present the results. The researcher investigated how
the cause which been an independent variable (in this study the use of using authentic
materials) affected the dependent variable (the learning of writing). Experimental
type used because the researcher had to draw the cause-effect relationship between
the dependent and independent variables.
The type of study used is Experimental Study. It utilized One group
pre-Test/Post-Test Design. Creswell stated that this type includes a pre-test measure
followed by a treatment and a post-test for a single Group.55 This design can be
John W.Creswell, Qualitative And Quantitative Approach, California: SAGE Publications, inc,1994, P. 132.
O1 X O
2
In this Experiment, the writer taught the students directly. Firstly, the writer
gave the students pre-test in order to measure the students’ achievement in writing
before using authentic materials as media. In this case, the students had learnt writing
before. Secondly, the writer gave treatment. The writer taught the students for four
times by using authentic materials. Third, there was post test. The result of pre-test
and post-test was compared to look for the scores was whether their abilities in
writing increased or not after authentic materials were taught. In this research, the
writer had collected; processed; analized the data to get conclusion of the research.
B.Research Design
The research design of this study is quasi-experimental design using T-test.
Experimental design is a plan for experiment that specifies what independent variable
applied, the number of levels of each, how object assigned to group, and the
dependant variables. T-testis a statistical procedure used to compare responses from
two groups. T test is generally applied to normal distribution which has a small set of
values. This test compares the mean of two samples. The T-test can be used for the
case of a quantitative outcome with a categorical explanatory variable that has two
variables.56
The research design of the research is experimental design because the research
measured the effect of giving treatment and compared the effect of the treatment for
the sampling.
56
Experimental research involves a study of the effect of the systematic
manipulation of one variable(s) on another variable. The manipulated variable is
called the experimental treatment or the independent variable (authentic materials as
instructional media in teaching recount writing). The observed and measured variable
is called the dependent variable (students’ scores in writing recount text).57
C.Variables of the Study
In the study, there are two variables:
1. The first is Independent Variable :
The Independent variable (X) of this study is the use of authentic materials
as media in the class.
2. The Second is Dependent Variable :
The Dependent Variable (Y) of this study is students’ scores who involved
in this study.
D.Place and Time of The Study
In this study, the writer needed about two months, they are from 18th August
2014 – 18th October 2014 to collect all of the data accurately and briefly. The place of
study is MTs Islamiyah Palangka Raya Jl. dr. Murjani No. 77.
57
E.Population and Sample 1. Population
According to Arikunto, population is the whole of research subject, if
someone wants to research all of the elements in research area her research is
called population research.58
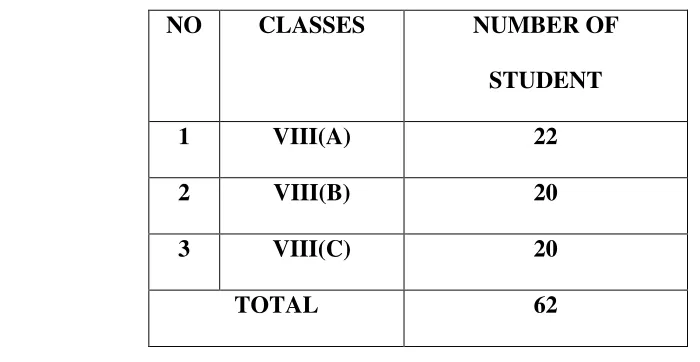
The Population of the research is all the students of eighth grade students of
MTs Islamiyah Palangka Raya, they are 62 Students in three classes; VIII(A),
VIII(B), and VIII(C).
Based on the last definition about the population, can be concluded that the
subject of all the study is all of the students which have the same characteristics
and will be investigated through this research.
Table 2.1
Number of Eighth Grade Students in MTs Islamiyah Palangka Raya
2. Sample
To determine the study, the writer took what Arikunto suggested that
sample is a part of representative of population that are examined or
investigated.59 In order to take a smallest group, the writer used cluster
sampling. Cluster sampling is a sampling technique where the entire population
is divided into groups, or clusters, and a random sample of these clusters are
selected. In cluster sampling, instead of selecting all the subjects from the entire
population right off, the writer took several steps in gathering her sample
population. First, the writer selected groups or clustered, and then from each
cluster, the writer selected the individual subject by either simple random or
systematic random sampling.60
In this way, the writer only chose two classes that were class VIII(A) and
VIII(B) which related to this study. In this study, the English teacher had
recommended the writer to choose class VIII(A) as experimental class, VIII(B)
as control class, whereas VIII(C) as try out class because they have same
abilities in learning English.
59Ibid
.,P. 120. 60
F. Research Instruments 1. Test Type
The type of the test used to collect the data is in the form of writing test,
especially recount writing test using and without authentic materials as teaching
media. In this sense, the students were assigned to complete a recount text with
suitable words that provided. The allocated time to do each writing test was 40
minutes.
2. Test Construction
The construction was based on the objective of the study. The study was
aimed at finding the effect of using authentic materials media on students’ scores
in writing recount text at eighth grade students of MTs Islamiyah Palangka Raya.
To investigate the effect of using authentic materials media on students’ scores in
writing recount text at eighth grade students of MTs Islamiyah Palangka Raya, the
subjects were assigned to complete recount text. The result of two tests were
investigated using statistical analysis and the outcomes were compared to see the
effects of using authentic materials media on students’ scores.
To gain the appropriate writing test for the aim of this study, the writer did
some steps: (a). planning the writing test, (b). preparing the writing test, (c). trying
out (pre test) the test (d). analyzing the result, and (e). carrying out the test.
a. Planning the writing test
To produce a good writing test, the writer made plan on the test
writer decided the appropriate type of test. The test type and test objectives are
very close. The test objective cannot be achieved without having appropriate
test type. Then, the writer was caring for the adequacy of the content. The test
content should match with test types and objectives. Lastly, the time allocation
for the test administration plans as well as the instrument try out.
b. Preparing The Writing Test
The writing test was used to elicit the data covering direction and
instructions of what the subjects had to do. To make the instruction clear and
understood by the students, the instructions must simple.
To construct the directions, the writer took into account the guidelines
applied by Clouse as follows: (1).The question should be clear, (2). The
question should be brief, (3).The question should be definite, (4). Avoid
question requiring yes or no answers, (5). Average students should be able to
write answer to the questions, (6). The vocabulary used and the concepts
expressed should not be too difficult for ordinary students to understand
immediately, (7). The instructions should provide an organizing principle for
composition.61
The writing instructions were designed to measure the students’ writing
ability. The students’ ability was scored on the basis of the marking scheme that
61
are if the students’ answer is right then it is given score 10, while if the
students’ answer is wrong or there is no answer then it is given score 0.
c. Test Try Out
In order to prove the test is suitable to the students who were the sample
of this study, the writer had conducted a try out test. The writer chose students
in the same school but different class to try out the test. The try out test was
conducted to MTs Islamiyah Palangka Raya, Class VIII(C) as the try out class
with 20 students. The result is valid, it means that the test items (10 questions)
as the instrument of this study is suitable to be given.
3.Research Instrument Validity
Validity is a measurement which shows the grades of number of an
instrument. A valid Instrument must have high validity, it means that an
instrument which lacks validity is said to be invalid instrument.
An instrument is called a valid one when it can measure something which is
wanted by covering the variable studied exactly. The method used in measuring
the validation of the instrument is called content validity. A test or a measurement
can be called a content test when it measures the special purpose which is equal
with the material or content given.
a. Face Validity
The types of face validity, if the test items look right to other testers,
teacher, indicators and test. The types of test items, which used in this research,
For face validity of the test items as follow:
1) The test used written test in completing test instruction.
2) The evaluation test based on scoring system.
3) Kind of the test is completing recount text.
4) The Language of items used English
5) The test is suitable with syllabus of English writing for eighth grade
students at MTs Islamiyah Palangka Raya.
b. Content Validity
This kind of validity depends on a careful analysis of the language
being tested and of the particular course objective. The test should be so
constructed as to contain a representative sample of the course, the relationship
between the test items and the course objective always being apparent.62 The
instrument which was using test, the testing of content validity was done by
asking the opinion of the judgment experts about the instrument is able to try
out or not.
c. Construct Validity
It is capable of measuring certain specific characteristics in accordance
with a theory of language behavior and learning. This type of validity assumes
the existence of certain learning theories or constructs underlying the
acquisition of abilities and skill.63 After the instrument checked by the
62
J. B. Heaton, Writing English Language tests, New York: Longman, 1974, P. 154. 63
judgment experts, continued testing of construct validity. It was conducted by
field test. The test is text completion. It is a test that used for beginning step
suits to syllabus. The writer used this test as instrument because the sample that
she studied is in beginner level (Eighth Grade Students). The test is formed in
new paragraph and the students were asked to complete the paragraph with the
suitable words that provided. The categories of missing words in the box
consist three content words; 3 nouns, 4 verbs , and 3 adjectives. In order to find
the validity, product moment Correlation was used as the formula to calculate
from the result of try out, it was also calculated using SPSS program.
The formula is as follows.64
(∑ ) (∑ )(∑ )
√* ∑ (∑ ) +* ∑ (∑ ) +
Where:
rxy : The coefficient of correlation
∑X : Total Value of Score X
∑Y : Total Value of Score Y
∑XY : Multiplication Result between Score X and Score Y
N : Number of Cases
Furthermore, it calculated using T-testCalculation as follows:65
tobserve = MD SEMD
64
Riduan, Metode dan teknik Menyusun Thesis, Bandung: Alfabetap, 2004, P. 110.
65
where:
MD = Mean of Difference
SEMD = Standard Error of Mean of Difference
The distribution of ttable at alpha 5% and the degree of freedom (n-2) with the
measurements of validity using the criteria below:66
To know the validity level of the instrument, the result of the test interpreted
to the criteria below:67
Reliability is a necessary characteristic of any good test for it to be valid at
all. A test must first be reliable as a measuring instrument. It is the degree of
consistency with which it measures whatever it is measuring.68 Reliability is the
66
Ridwan, Metode dan Teknik Penyusun Tesis, Bandung: Alfabeta, 2009, P. 110. 67ibid.,
P.111. 68
Donald Ary et al, Introduction to Research in Education, 8thedition, P. 236.
rxy>tt= Valid
extent of consistency and stability of the measuring instrument. In this case, to
score the students’ tasks as fairly and consistently as possible, the writer used KR
20 or (Kuder–Richardson Formula 20) method (test of reliability). These are
alternative formulas for calculating how consistent subject responses are among
the questions on an instrument. Items on the instrument must be dichotomously
scored (0 for incorrect and 1 for correct). The Formula is as follow:69
KR20 = [n/(n - 1)] x [1 - (Σpq)/Var]
Where:
KR20 = estimated reliability of the full-length test
n = number of items
Var = variance of the whole test (standard deviation squared)
Σpq = sum the product of pq for all n items
p = proportion of people passing the item
q = proportion of people failing the item (or 1-p)
KR-20 (Kuder–Richardson Formula 20) is an index of the internal
consistency reliability of a measurement instrument, such as a test, questionnaire,
or inventory. Although it can be applied to any test item responses that are
dichotomously scored, it is most often used in classical psychometric analysis of
psychoeducational tests and, as such, is discussed with this perspective. Values of
KR-20 generally range from 0.0 to 1.0, with higher values representing a more
internally consistent instrument. In very rare cases, typically with very small
69
samples, values less than 0.0 can occur, which indicates an extremely unreliable
measurement. A rule-of-thumb commonly applied in practice is that 0.7 is an
acceptable value or 0.8 for longer tests of 50 items or more. Squaring KR-20
provides an estimate of the proportion of score variance not resulting from error.
Measurements with KR-20 <0.7 have the majority of score variance resulting.70
Furthermore, the realibility of try out test was also calculated using SPSS program
and the result shown that the test is reliable to be given.
G.Data Collection
In collecting the data of this study, the writer took the data from pre-test and
post-test. Pre-test had been given to the subjects before doing teaching and learning
process (treatment). Meanwhile, post-test had been given after applying teaching and
learning process (treatment).
In this study, the writer applied steps as follow:
1. The writer observed the school (MTs Islamiyah Palangka Raya).
2. The writer tried out the test to class VIII(C). Kind of the test try out is asking
students to complete a recount text with the suitable words that provided.
3. The writer checked the result of the test try out.
4. The writer divided the students (sample) into two classes (experimental and
control) by using cluster sampling.
5. The writer gave a pre-test to both classes (experimental and control).
70
6. The writer checked the result of pre-test of experimental and control classes.
7. After the pre-test given, the writer taught the students in experimental class
about recount text by using authentic materials and control class without using
authentic materials. Experimental and control classes were taught using
grammar translation method. The treatment was done four times.
8. After doing the treatment, the writer gave the post-test to both classes.
9. Then, the writer checked the students’ answers in the post-test.
10. The writer gave scores to students’ answers by using scoring rubric. In this
case, the writer applied T-test for correlated samples to examine the significant
difference scores between experimental and control classes.
11. Finally, the writer compared the students’ scores in the pre-test and post-test.
It is done to know whether the use of authentic material is effective in
improving students’ abilities in writing recount paragraphs or not.
H.Data Analysis
1.Techniques of Data Analysis a. Normality Test
It is used to know the normality of the data that is going to be
analyzed whether both groups have normal distribution or not. The normality of
the data was also analyzed using SPSS program and the result shown that the
Lilifors is used here71
F(Zi)−S(Zi)
Notice:
F(Zi) : 0,5 – the value of Zi table
S(Zi) : fk –ƩA1
b. Homogenity Test
It is used to know whether experimental group and control group, that
were decided, come from population that has relatively same variant or not.
The homogenity of the data was analyzed using SPSS program and the result
shown that the data were taken from homogeny samples.
2. Data Analysis Procedures
The data of this study is students’ writing scores in experimental and control
classes. Therefore, the data are in quantitative data. The data were analyzed by
means of inferential statistics. This statistical analysis is suitable to use to answer
the research problem. In this case, the researcher applied T-test for correlated
samples to examine the significant difference score between experimental class
that taught using authentic materials and control class that taught without using
authentic materials in completing recount text.
In Order to analyze the data, the writer did some procedures:
a. The writer collected the students’ written scores of pre-test and post test
71
b. The writer arranged the obtained score into the distribution of frequency of
score table.
c. The writer calculated mean by using this formula:72
∑fX
d. The writer calculated Median by using formula:73
½N – fkb ½N – fka
Anas Sudijono, Pengantar Statistik Pendidikan, P.40. 73
e. The writer calculated Modus by looking score that has highest frequency:74
f. The writer calculated Deviation Standard by using formula:75
SD = √ ∑fx2
g. The writer calculated T-testfor two samples that have correlation each others to
answer the problem of the study, whether authentic materials gives effect
toward students’ scores of experimental class in completing recount paragraph.
Formula that used to find “t” or to (t-observed) for two samples that have
correlation each others is as follows:76
to= MD
SEMD
Where:
1) MD = Mean of Difference = Average score from deviation between score
variable I and score variable II that can be found by using formula:
2) ∑D = The Total Score of deviation between score variable I (variable X)
and score variable II (variable Y), and D is found by using formula: D =
X – Y.
3) N = Number of Cases = the total subject that is studied.
4) SEMD = Standard Error of Mean of Difference that found by formula:
SEMD = SDD √ N – 1
5) SDD = Standard Deviation of difference between score variable I and
Score variable II that can be found by formula:
SDD= √ ∑D2 – ∑D 2
N N
Procedures that done in order to find the value of to (t-observed)continuously
are as follow:77
6) The writer found D (Difference) between score variable I and score
variable II. If variable I is given symbol X then variable II is given
symbol Y, so: D = X – Y.
7) The writer totalized D till get ∑D.
8) The writer found Mean of Difference by formula: MD= ∑D / N.
9) The writer squared D: then totalized till find ∑D2.
77
10) The writer found Standard Deviation of Difference (SDD) by formula:
SDD= √ ∑D2 – ∑D 2
N N
11) The writer found Standard Error of Mean of Difference, that is SEM ,
by using formula:
13) The writer gave interpretation to “to” by following these steps:
(a)First, Alternative Hypotheses (Ha) and Null Hypotheses (H0).
(b)The writer examined significant of to, by comparing the value of to (“t”
result of observation or “t” result of calculation) with tt (critic value “t”
that is found in Null Tabel “t”) by first set its degrees of freedom (df)
that can be found by formula: df = N – 1.
otherwise Alternative Hypotheses is accepted. It means there is
(2)If to is smaller than tt, then Null Hypotheses is accepted and
Alternative Hypotheses is rejected. It means that there is no
significant difference between both variables that studied.
(e)The writer gave conclusion from the result.
h. The writer interpreted the result of analyzing
i. The writer made discussion to clarify the research finding.