Minor and trace elements in bornite and associated
Cu–(Fe)-sulfides: A LA-ICP-MS study
Nigel J. Cook
a,b,⇑, Cristiana L. Ciobanu
a, Leonid V. Danyushevsky
c, Sarah Gilbert
caCentre for Tectonics, Resources and Exploration (TRaX), School of Earth and Environmental Sciences, University of Adelaide, SA 5005, Australia
bSouth Australian Museum, Adelaide, SA 5000, Australia cCODES, University of Tasmania, Australia
Received 4 May 2011; accepted in revised form 10 August 2011
Abstract
In situ laserablation inductively-coupled mass spectroscopy (LA-ICP-MS) has been used to provide a baseline dataset on the minor element contents in hypogene bornite and accompanying Cu-sulfides from 12 deposits with emphasis on syn-meta-morphic Cu–vein systems in Norway, and skarn, porphyry and epithermal systems in SE Europe.
Bornite contains significant concentrations of both Ag and Bi, especially in the vein and skarn deposits studied and has the potential to be a major Ag-carrier in such ores. Concentrations of up to >1 wt.% of both elements are documented. Measured concentrations appear to be independent of whether discrete Ag- and/or Bi-minerals are present within the analyzed sulfide. Where bornite and chalcocite (or mixtures of Cu-sulfides) coexist, Ag is preferentially partitioned into chalcocite over co-exist-ing bornite and Bi is partitioned into the bornite. Bornite is a relatively poor host for Au, which mimics Ag by beco-exist-ing typically richer in coexisting chalcocite. Most anomalous Au concentrations in bornite can be readily tracked to micron- and submi-cron-scale inclusions, but bornite and chalcocite containing up to 3 and 28 ppm Au in solid solution can be documented. Sele-nium and Te concentrations in bornite may be as high as several thousand ppm and correlate with the abundance of selenides and tellurides within the sample. Selenium distributions show some promise as a vector in exploration, offering the possibility to track a fluid source. Bornite and chalcocite are poor hosts for a range of other elements such as Co, Ni, Ga and Ge, etc. which have been reported to be commonly substituted within sulfides. Hypogene bornite and chalcocite may have significantly different trace element geochemical signatures from secondary (supergene) bornite.
Ó2011 Elsevier Ltd. All rights reserved.
1. INTRODUCTION
After chalcopyrite, bornite (Cu5FeS4) is among the most common Cu-sulfides. Bornite is a major Cu-carrier in many high-sulfidation epithermal deposits (White and Heden-quist, 1990), sedimentary-hosted copper deposits such as the Kupferschiefer of northern Europe (e.g., Piestrzynski and Sawlowicz, 1999) and some porphyry–Cu deposits and associated Cu- and polymetallic skarns (e.g., Ertsberg
District, Indonesia; Rubin and Kyle, 1997). Simon et al. (2000), Kesler et al. (2002)andKesler (2004)contend that high-temperature bornite may, at least initially, host a sig-nificant amount of the total gold budget in some porphyry deposits. Bornite can also be a major mineral in parts of some volcanogenic massive sulfide (VMS)-type deposits (e.g., Neves Corvo, Portugal; Gaspar, 2002). Importantly, together with chalcocite (Cu2S), bornite is the dominant Cu-carrier in iron oxide–copper–gold (IOCG) deposits, such as Olympic Dam, Prominent Hill and others in the Gawler Province of South Australia (e.g., Skirrow et al., 2002; Skirrow and Davidson, 2007).
Understanding of Cu–(Fe)-sulfide mineral chemistry has both processing and exploration implications in all the
0016-7037/$ - see front matterÓ2011 Elsevier Ltd. All rights reserved.
doi:10.1016/j.gca.2011.08.021
⇑ Corresponding author at: Centre for Tectonics, Resources and Exploration (TRaX), School of Earth and Environmental Sciences, University of Adelaide, SA 5005, Australia.
E-mail address:[email protected](N.J. Cook).
www.elsevier.com/locate/gca
Available online at www.sciencedirect.com
above deposit types. This is because knowledge of the min-or and trace elements carried by a host sulfide, including bornite, is essential to evaluate the distribution and parti-tioning of potential economically-valuable components, such as Au, Ag or In, between co-existing minerals. Such information can be used to optimize processing and thus ensure improved recoveries of by-products. The minor and trace element concentrations in sulfides and their distri-butions have potential as vectors to assist in mine-scale exploration. Understanding how supergene processes affect bornite and Cu–(Fe)-sulfides and influence their surface properties also has implications for minerals processing and environmental geochemistry (e.g., Vaughan et al., 1987; Harmer et al., 2005).
The Cu-rich corner of the system Cu–Fe–S is complex, featuring many low-T phases but a large field of solid-solu-tion (bornitess) at high temperature (Yund and Kullerud,
1966), which covers the compositional range Cu2S– Cu5FeS4–Cu9S5. From the latter, hexagonal, high-T chalco-cite becomes stable below 435°C and the bornitess field splits into two, where the larger part is the bornite–digenite solid solution and the smaller is the chalcocite solid solution field. Monoclinic low-T chalcocite (<104°C) and djurleite (Cu1.97S) are structurally related to high-T chalcocite. Upon cooling, a series of bornite superstructures are formed at T< 265°C (Pierce and Buseck, 1978). Super-structures are larger Super-structures with a distinct structural sub-motif expanded in 1, 2 or 3 dimensions, in which one feature in the motif varies an ordered manner, e.g. the arrangement of metal vacancies in 2a, 4a or 6a bornite (Pierce and Buseck, 1978). Digenite (Cu1.8S) superstruc-tures result from further cooling below 75°C when com-bined with changes in the Fe/Cu and M/S ratios. This complexity is also reflected in the presence of fine inter-growths with varying textures in natural samples. It is often difficult to distinguish exsolution sequences from supergene low-T replacement relationships. Despite numerous studies (Morimoto and Kullerud, 1961; Brett, 1964; Morimoto, 1964; Yund and Kullerud, 1966; Sugaki et al., 1975; Putnis and Grace, 1976; Kanazawa et al., 1978; Durazzo and Tay-lor, 1982; Grguric and Putnis, 1999; Grguric et al., 2000; Fleet, 2006), there are still some uncertainties as to the sta-bility of bornite and associated phases and how exsolution textures develop, especially in the low-temperature part of the system. On the other hand, the central part of the sys-tem Cu–Fe–S also contains an important field of solid solu-tion (iss), which diminishes in size from >600°C to below 400°C and which is linked by tie-lines with bornitess(Cabri,
1973).
Bornite commonly hosts inclusions of mineral phases, notably Ag-, and more rarely, Bi-bearing chalcogenides, gold grains, and even platinum-group minerals (PGM). Can such inclusions be exsolved from high-temperature bornite (bornitess) containing structurally-bound Ag, Bi, Au, etc.? Alternatively, are they the result of later replace-ment during interaction with fluids? Sugaki et al. (1984)
found that bornite can incorporate >10 wt.% Bi at 300°C, coexisting with wittichenite exsolved at 395°C; chalcocite incorporates rather less Bi. Relatively little is known about the solubility limits and controls on
concen-tration of Ag and other elements in solid solution within bornite and co-existing Cu–(Fe)-sulfides. Even if bornitess hosts structurally-bound minor elements, how would they be partitioned within different fields of exsolution at critical points during cooling, and how are they retained in the structures of Cu–(Fe)-sulfides across phase transforma-tions? Determination of minor and trace element concen-trations in bornite and associated Cu–(Fe)-sulfides from deposits of different types, and displaying diverse types of exsolution and inclusions, is thus a first step towards under-standing the mechanisms controlling exsolution relative to retention of elements in the crystal structure.
Our study provides a set of baseline data on the minor element contents in bornite and accompanying Cu-sulfides from ores with an apparently relatively simple geological history usingin situ laser-ablation inductively-coupled mass spectroscopy (LA-ICP-MS). Thirty-two samples from 12 deposits were analyzed. A total of 28 isotopes were moni-tored (49Ti,51V, 53Cr,55Mn, 57Fe,59Co,60Ni,65Cu,66Zn, 69Ga, 72Ge, 75As, 77Se, 93Nb, 95Mo, 107Ag, 111Cd, 115In,
118Sn, 121Sb, 125Te, 182W, 185Re,197Au, 205Tl, 208Pb,209Bi
and238U) from which element concentrations were calcu-lated. The trends within this data are compared with pub-lished data and interpreted in terms of both observed textures and phase diagrams. Our purpose is to identify the more common trace elements in these minerals and to establish common trends in the data.
2. DEPOSITS AND SAMPLE SUITE
Sample material (Table 1) was selected from deposits in which chalcophile (Ag, Bi ± Au, As, Sb) and chalogenide elements (Se, Te) give a prominent geochemical and miner-alogical signature closely tied to hypogene bornite and Cu– (Fe)-sulfides. Our sample suite encompasses bornite (±chal-cocite) assemblages formed in a single event, i.e., without significant overprinting, replacement or supergene alter-ation which might influence trace element patterns.
The samples are from two distinct geological terranes: (i) Late Proterozoic metamorphic Cu–vein systems in southern Scandinavia; and (ii) magmatic hydrothermal deposits (skarn, porphyry and epithermal systems) from the one of the metallogenetic belts in SE Europe, the Late Cretaceous Banatitic Magmatic and Metallogenetic Belt, BMMB; Cio-banu et al., 2002). One sample of bornite (Museum collec-tion, South Australian Museum) from the Proterozoic Olympic Dam IOCG deposit, South Australia, was ana-lyzed for purposes of comparison. In contrast to the other samples, this consists of equal amounts of bornite and chal-copyrite and is free of any mineral inclusions containing chalcophile or chalcogenide elements.
2.1. High-temperature hypogene bornite and chalcocite from Cu–vein systems (Type-A)
Table 1
Sample suite for analyzed Cu–(Fe)-sulfides.
Locality Geology Samples Ore mineralogy Reference(s)
Metamorphosed Late Proterozoic veins,Southern Scandinavia
Tinnsja˚, Telemark, Norway
Late Proterozoic amphibolites-associated vein Cu–Ag deposit
Tsj1, Tsj1a, Tsj2 (open pit) Tsj5, Tsj6, Tsj7 (lower dump) Tsj9 (upper adit)
Mo1, Mo2, Mo6 (dumps next to upper adits) Mo3 (dump next to lower adits)
Bornite, chalcocite, digenite, chalcopyrite (Mo2 only), molybdenite, wittichenite (except Mo3), galena–clausthalite, native gold, hessite, petzite, cervelleite (Mo3), Bi–tellurides
Gr1, Gr2, Gr3 (dumps next to adits) Bornite, chalcocite, digenite, chalcopyrite, wittichenite, minor molybdenite, hessite,
Veinlets in basalts Tj1 (roadside dump) Hematite, bornite, wittichenite Nordrum (1972)
Glava, Sweden Sveconorwegian (ca. 1.15–0.9 Ga) Cu– Ag–Au veins in granitic gneisses, Mjøsa-Va¨nern belt
GL99.5 (dump next to adit) Magnetite, bornite, chalcocite and
covellite (supergene), native gold, Au–Ag and Bi–tellurides
Oen and Kieft (1981)
Late Cretaceous Banatitic Magmatic and Metallogenetic Belt,Se Europe (Ciobanu et al.,2003) North Apuseni Mts. (Romania)
Baitßa Bihor Cu–Mo–(Pb–Zn) skarn BB20A (garnet-diopside
skarn, central part of Antoniu Nord orepipe) BB19CB (diopside-wollastonite skarn, Antoniu Nord orepipe) BB13F (garnet skarn at marble contact, Antoniu Nord orepipe)
BB13B (pyroxene Di80Hed15Joh5– wollastonite skarn,
outer marble contact, Antoniu Nord orepipe) BB3 (humite skarn, deeper level, Antoniu Nord orepipe)
BB170B (humite skarn, Antoniu Nord orepipe) BB171 (humite skarn, Antoniu Nord orepipe)
Bornite
Bornite, mm- to cm-sized sphalerite (exsolved)
All samples contain exsolved chalcopyrite and wittichenite
Ciobanu et al. (2002, 2003)
Banat (Romania)
Ocna de Fier Fe–Cu–(Zn–Pb) skarn CuSI (forsterite skarn, Simon Iuda orebody, proximal Cu skarn)
CuPP SI (diopside skarn, Petru-Pavel – Simon Iuda orebody, proximal Cu skarn)
Sasca Montana˘ Cu–Au skarn SM2 (roadside dump) Pyrite, bornite Ciobanu et al. (2002)
(continued on next page)
Bornite
mineral
chemistry
and Grusen deposits. The two deposits are 700 m apart and are hosted at the contact between massive amphibolite and sheared, micaceous pegmatites within a sequence of meta-morphosed sedimentary units intruded by granitoids, which are considered responsible for mineralization. Likewise, bornite is the main sulfide in the Tinnsja˚ (100 km NE of Moberg/Grusen) and at Tjøstølflaten (40 km NE of Mo-berg/Grusen) deposits, where mineralization also contains Fe-oxides (magnetite and hematite), and is hosted within and at the margin of amphibolites within a similar type of metamorphic suite, but without clear genetic relationships with granite. Glava, Sweden, is representative of Cu–Ag– Au mineralization in the Mjøsa-Va¨nern belt of probable Sveconorwegian age (Alm and Sundblad, 1994). Here, veins are emplaced in shear zones within a granite gneiss terrane. Besides bornite, Cu–(Fe)-sulfides are also major compo-nents of the ores, i.e., chalcocite at Tinnsja˚, digenite at Mo-berg and Grusen; chalcopyrite is a relatively minor component of some samples only. Exsolution relationships between bornite and the Cu-sulfides (Fig. 1a–c) indicates a hypogene origin for the latter in all deposits except Glava, where the subordinate chalcocite is clearly secondary. The more complex exsolution sequence in a type of bornite from Moberg (Mo2) is, however, more difficult to interpret. This bornite has chalcocite only as fine mesh-like symplectites, with their density varying across the grain and appears later than the exsolution of chalcopyrite followed by galena-clausthalite (Fig. 2a and b). In this study, we address ele-ment partitioning between bornite and chacocite and born-ite and digenborn-ite in the Tinnsja˚, Moberg and Grusen deposits.
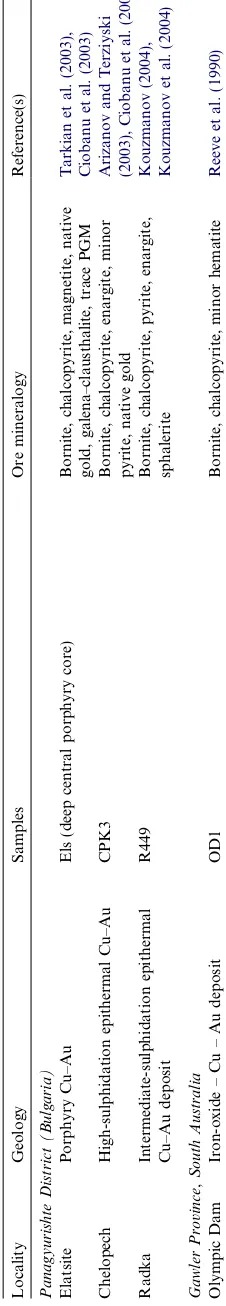
All the Cu-ores have a prominent Bi-rich signature and wittichenite (Cu3BiS3), is a conspicuous component in all except Glava (Fig. 2a–c). Bornite from the Moberg, Grusen and Glava deposits contains abundant telluride, tellurosul-fide and telluroselenide phases of the tetradymite group (Fig. 2d and e; Cook et al., 2007a; Ciobanu et al., 2009a) and at Moberg, also the aleksite group (Cook et al., 2007b), as well as Au–Ag–tellurides and tellurosulfides (hessite, petzite and the Ag–tellurosulfide cervelleite;Cook and Ciobanu, 2003;Fig. 2f), altaite, clausthalite and other species (volynskite, kostovite) in Glava (Bonev et al., 2005). On the other hand, bornite from Tinnsja˚ (Cook et al., 2010), and Tjøstølflaten, lacks tellurides or gold but contains, in Tinnsja˚, various Ag-and Bi-minerals (stromeye-rite, larosite and bismuthinite derivatives). The nine sam-ples from Tinnsja˚ are representative of the 500 m vertical extent of the vein system; all samples contain both bornite and chalcocite (Fig. 1c), but the latter is absent in sample Tsj13. Chalcopyrite is appreciably more abundant in mate-rial from upper levels (Tsj9), where bismuthinite derivatives and molybdenite are also observed.
In the Tinnsja˚ occurrence, a transmission electron microscope (TEM) crystal-chemical investigation of laro-site and host Cu–(Fe)-sulfides has shown a coherency be-tween the exsolved Ag-minerals and varieties of Cu–(Fe)-sulfides present. Boundary zones between host and exsolved phases feature sub-microscopic intergrowths of chalcocite, djurleite and low-temperature bornite superstructures inti-mately intergrown with the exsolved larosite, as well as
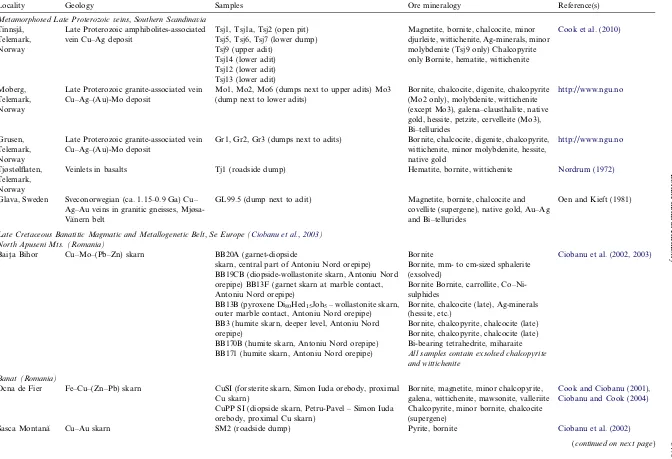
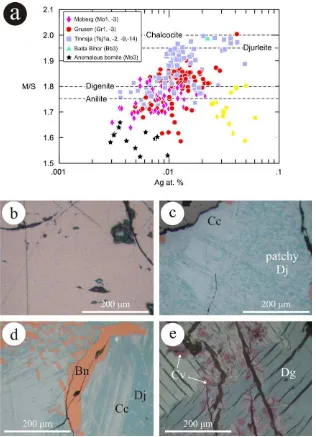
Fig. 1. Photomicrographs in reflected light. (a–c) Typical primary bornite–chalcocite associations in the Norwegian hypogene sulfide samples. Dark spots are LA-ICP-MS craters. (a) Digenite (Dg), with formation of supergene covellite (Cv) along fractures; Moberg, sample Mo1. Bn: bornite. (b) Detail of a larger area of coarse symplectite between bornite (Bn) and Cu-sulfides showing that the latter consist of a fine mixture of chalcocite (Cc) and digenite (darker bluish color on image). Note how fine symplectites surround larger areas of Cu-sulfides; Grusen, sample Gr1. (c) Worm-like intergrowth of bornite (Bn) and chalcocite (Cc); Tinnsja˚, sample Tsj9. (d–f) Aspects of bornite in skarn ores. (d) Typical, oriented type of exsolutions of wittichenite (Witt) and chalcopyrite (Cp) in bornite (Bn) from Baita Bihor; sample BB1b. (e) Unusual, coarse symplectite of bornite (Bn) and In-bearing sphalerite (Sp) from Baita Bihor; sample BB19CB. Note marginal (secondary) chalcocite (Cc). (f) Typical galena (Gn) exsolution in Ocna de Fier bornite (Bn) and narrow veinlets composed of valleriite (Val, middle) and chalcocite + wittichenite (margins); sample CuSI. (g) Atoll-like textures composed of fine-grained, dusty bornite (atoll cores) and chalcopyrite/pyrite (on margins), Sasca Montana; sample SM2. (h) Pyrite showing atoll-like textures within a matrix of bornite (Bn) and coarse and bleb-like inclusions of native gold (Au), Chelopech; sample CPK3. (For interpretation of color mentioned in this figure the reader is referred to the web version of the article.)
oscillatory twinning. There is clearly crystal-structural control on nucleation of exsolved Ag and Bi from structur-ally-related Cu–(Fe)-sulfides. The TEM study also helped explain the wide variation in Cu/S ratio in the electron microprobe dataset and underlines the difficulty in giving
an unambiguous name to the Cu-phases analyzed by LA-ICP-MS.
The exsolution relationships in Moberg and Grusen indicate an origin for the bornite-bearing assemblages from the two solid solution fields in the system Cu–Fe–S above
400°C, i.e., chalcopyrite-bornite from iss and digenite– (bornite) and chalcocite from bornitess. Similarly, the born-ite–chalcocite and chalcocite–wittichenite relationships in the Tinnsja˚ samples can be ascribed to formation above 400°C (probably > 435°C). In the present study these are collectively considered as high-temperature (Type-A) bornites.
2.2. Hypogene mineralization in skarn and epithermal environments (Type-A)
Bornite is an ore component in all deposit types from across the magmatic-hydrothermal spectrum in the Late Cretaceous Banatitic Magmatic and Metallogenetic Belt (BMMB) of southeastern Europe (Ciobanu et al., 2002). This belt is also characterized by a prominent Bi–Te signa-ture, in particular within Ag–Au-rich ores (Ciobanu et al., 2003).
The Cu–Mo–Pb–Zn skarn at Baita Bihor consists of a dozen orepipes located some 1.2 km above a granitic bath-olith and hosted within a sequence of Triassic-Jurassic car-bonate units (Cioflica et al., 1977). There is a west-to-east metal zonation (Mo–Cu–Pb/Zn) across the orefield, but each orepipe also features similar zonation trends from core to the skarn-marble contact, sometimes with superposition due to telescoping. Such aspects are reflected in the four analyzed bornites from the Antoniu Nord orepipe, with positions from inner humite–diopside skarn (BB20A) to diopside–wollastonite skarn (BB19CB) to outer skarn-mar-ble contact (BB13F, 13B). Bornite contains a wide variety of exsolved assemblages which vary from sample to sample (Cook and Ciobanu, 2003). Wittichenite is nevertheless ubiquitous and is often present as exsolutions oriented along cleavage in bornite from the inner part of orepipes (BB20A;Fig. 2g). The abundance of Bi and intimate asso-ciation of Bi-minerals in the Cu-ores presents a significant problem in ore processing. Exsolutions of chalcopyrite are observed either together with wittichenite, or with chalco-cite (Fig. 1d). Baita Bihor bornite also displays more unu-sual textures, such as fine symplectites with galena (Fig. 2h) or Bi-tetrahedrite, mm-scale intergrowths with sphalerite (BB19CB;Fig. 1e), and rims of tennantite zoned with respect to Bi. Among other mineral inclusions abun-dant in bornite are native gold, hessite and cervelleite (see
Cook and Ciobanu, 2003). A range of more exotic minerals are also observed, including Sn-minerals (mawsonite in BB20A), Ag-sulfides and selenides, and Ni–Co-minerals (millerite, polydymite and vaesite in BB13B). Although Baita Bihor is well known for a wide range of Bi-sulfosalts and – tellurides, such minerals are rare in bornite. Unlike the above samples, specimens from deeper working levels in the deposit (BB3, BB170B, BB171) contain abundant chalcopyrite, as well as a late (possibly supergene) chalco-cite. Miharaite, an Fe-bearing Bi-sulfosalt is also conspicu-ous within bornite from deeper parts of the Antoniu Nord pipe (sample BB171).
The Ocna de Fier-Dognecea Fe–Cu–(Zn–Pb) skarn is a zoned, 10 km-long orefield tied to a granodiorite intrusion, with 15 orebodies located at the contact between Jurassic limestones and basement schists. Hypogene bornite,
associ-ated with magnetite and chalcopyrite, forms the early (high-temperature), proximal Cu–Fe core of the orefield (Cook and Ciobanu, 2001; Ciobanu and Cook, 2004). Bornite hosts lamellar exsolution of galena–(clausthalite) cross-cut-ting former valeriite–witichenite–chalcocite exsolutions (Fig. 1f. As at Baita Bihor, bornite also hosts a range of other minerals (coarse native silver, cobalt pentlandite, car-rollite, mawsonite, jalpaite and minor gold).
Bornite is also rarely present in the porphyry deposits of the BMMB. An exception is the bornite associated with magnetite from the high-temperature, potassic Cu–Fe core preserved in the Elatsite porphyry Cu–Au deposit. This bornite is remarkable for the occurrence of platinum-group minerals and gold (Tarkian et al., 2003), is rich in selenides (chiefly as an intermediate galena–clausthalite phase) but lacks any discrete Ag- or Bi-minerals.
The bornite from Baita Bihor is ‘Bi-saturated’; (fields of wittichenite exsolution) and thus formed above 400°C. Evi-dence for high-temperature bornite is also given for Ocna de Fier (Cook and Ciobanu, 2003; Ciobanu and Cook, 2004) and Elatsite, where the ore fluids had temperatures from 340 to >700°C (Tarkian et al., 2003). We regard these skarn and porphyry bornites as analogous to the Type-A bornites in the Scandinavian veins above.
2.3. Lower-temperature Cu-rich systems in skarn and epithermal environments (Type-B)
Bornite is not a major component of the Cu-skarns asso-ciated with porphyry mineralization in the BMMB, but we include a sample representing low-temperature, atoll-like, fine-grained bornite, forming the cores of collomorph arse-nian pyrite (Fig. 1g) from the Au-rich ore at Sasca Mon-tana (Constantinescu, 1980). Bornite contains neither Ag-nor Bi-minerals, but contains dusty, sub-microscopic As– Sb-bearing minerals. Although part of a skarn system, the bornite from Sasca Montana is clearly a late, low-tempera-ture mineral in the assemblage because of the fine-grain size and presence of atoll textures and dusty inclusions. We will here refer to it as Type-B, to clearly distinguish it from the higher-temperature bornite from the Scandinavian systems and from the Baita Bihor, Ocna de Fier and Elatsite depos-its above.
The Panagyurishte District in the BMMB hosts epither-mal systems with variable sulfidation states, but bornite is only present in the high- and intermediate-sulfidation deposits. In Chelopech, bornite forms part of the Au-rich ores, showing abundant inclusions and skeletal exsolutions of gold (Fig. 1h). Bornite is associated with spectacular col-lomorph arsenian pyrite, chalcopyrite and enargite. Fluid inclusions in enargite gave homogenization temperatures of 175–221°C (Moritz et al., 2004– but requiring a correc-tion upwards by 15–25°C;Moritz, 2006). In Radka, born-ite is known from several stages of mineralization, where it is considered late in the sequence following chalcopyrite and pyrite and brecciation events (T250°C;
Kouzma-nov, 2004). Similar to Chelopech, the bornite in our sample contains inclusions of enargite. Bornite is associated with minor chalcopyrite, sphalerite and galena and predates a generation of late, fine-grained, rounded, porous pyrite.
Bornite from the Chelopech and Radka epithermal systems and bornite from Sasca Montana are here considered as a relatively lower-temperature of bornite (Type-B).
3. ANALYTICAL METHODOLOGY
One-inch polished mounts were prepared from the se-lected samples. Optical and scanning electron microscopy (SEM) in back-scattered electron (BSE) mode was used to characterize each; generally, the phases analyzed by LA-ICP-MS were coarse-grained and, wherever possible, free of visible inclusions or exsolutions of ‘exotic’ minerals. Each sample was also studied by electron microprobe to ascertain the wt.% Cu content in bornite and Cu–(Fe)-sul-fides, and any minor elements present at elevated concentrations.
Electron probe microanalysis was carried out using a Cameca SX-51 instrument at Adelaide Microscopy. Oper-ating conditions were an accelerOper-ating voltage of 20 kV and a beam current of 20 nA. Standards used were: Bi2Se3 (Bi,Se), Ag2Te (Ag), CuFeS2(Cu,Fe,S), monitoring the fol-lowing spectral lines: Bi Ma, Se La, Ag La, Cu Ka, Fe Ka and S Ka. Count times were 20 s for all elements.
LA-ICP-MS analysis was made using Agilent HP4500 (2007 run) and 7700 (2009 run) Quadrupole ICP-MS instruments at CODES (University of Tasmania, Hobart, Australia). The instrument is equipped with a high-perfor-mance New Wave UP-213 Nd:YAG Q-switched laser abla-tion system equipped with MeoLaser 213 software. In our analytical routines, we have followed the methodology out-lined byDanyushevsky et al. (2011)and applied to studies of Bi-chalcogenides (Ciobanu et al., 2009b), pyrite (Cook et al., 2009a) and sphalerite (Cook et al., 2009b). We have monitored the following isotopes: 49Ti, 51V, 53Cr, 55Mn, 57Fe,59Co,60Ni,65Cu,66Zn,69Ga,72Ge,75As,77Se,93Nb,
95Mo, 107Ag, 111Cd, 115In, 118Sn, 121Sb, 125Te, 182W,
185Re,197Au, 205Tl, 208Pb, 209Bi and238U. A total of 204
spot analyses of bornite, and 87 of chalcocite/digenite (40–80lm diameter spot size) were made. Fifteen analyses of coexisting chalcopyrite were made for comparison. Total analysis time for each analysis (30 s pre-ablation and 60 s ablation time) was 90 s. Calibration was performed using the in-house standard (STDGL2b-2), see Danyushevsky et al., 2011). The composition of the bornite/chalcocite (from electron microprobe data) allowed us to use Cu as an internal standard to quantify the analyses.
Low Ge concentrations cannot be quantified with full confidence because of interference from40Ar32S in the stan-dard, and the Ge concentration in the standard is not high enough to ignore these interferences. For this reason, no Ge value is published for standard STDGL2b2 (Danyushevsky et al., 2011).
For the Type-A hypogene sulfides, our spot analyses measured element concentrations in clean grains of sulfide, except where sub-surface (collateral) inclusions were picked up during analysis. Finding and analyzing clean areas of the Type-B sulfides was more problematic and we conceded that, particularly in the cases of material from Sasca Mon-tana and Chelopech, the analyzed grains contained abun-dant micron- and su-micron-scale inclusions.
The LA-ICP-MS method is, essentially, a bulk analytical method in which a volume of sample material is ablated which may contain micron-scale inclusions exposed at or below the sample surface, as well as fine- or nanoparticles (100–2500 nm and <100 nm, respectively) that are invisible even under the SEM. The quest for low minimum detection limits means that the spot diameters (and thus analyzed vol-umes) need to be sufficiently large to generate an adequate count rate. We thus caution the reader that there is always a risk that measured elements interpreted to be lattice-bound may actually be present as ‘collateral’ inclusions only visible at the nanoscale. Although the method allows for resolu-tion of lattice-bound trace elements vs. sub-micron-scale inclusions, these inclusions need to be greater than a certain size to be visible on the time-resolved depth spectra (see dis-cussion inCiobanu et al., 2009b). Homogeneously distrib-uted nanoinclusions (<100 nm) of a discrete mineral will generally give a flat profile indistinguishable from that ob-tained if the elements in question are lattice-bound. These issues, and new data on trace element distributions in Sn– Ag-bearing ZnS, are highlighted in a recent paper in which LA-ICP-MS data are compared against high-resolution Fo-cused Ion Beam (FIB)-SEM, High-Angle Annular Dark Field (HAADF) STEM imaging and TEM studies ( Cio-banu and Cook, 2011). We recommend that LA-ICP-MS trace element data are checked against observations from other techniques permitting nanoscale resolution of the so-lid solution vs. nanoinclusion issue whenever possible. This has particular relevance for certain trace elements which, intuitively, do not appear to have an obvious position with-in a tetrahedral-metal domwith-inated structure. We also take the opportunity to remind the reader that a holistic appre-ciation of element incorporation at scales of observation be-tween the micron- and nanoscales is not available for most sulfides since application of nanoscale techniques to ore mineralogy is very much in its infancy at present.
4. RESULTS
4.1. Electron probe microanalysis
Electron probe microanalysis (EPMA data; Electronic Appendix A) was performed both before and after LA-ICP-MS analysis. The purpose of the EPMA runs prior to LA-ICP-MS analysis was to confirm the identity of the main phases, allow selection of grains for LA-ICP-MS and provide the necessary wt.% Cu values for quantitative analysis (see below). The runs after LA-ICP-MS analysis were made around the ablation spots targeting chalcocite and other Cu-sulfides in order to constrain some of the anomalous Ag and Fe values obtained. Throughout the data, only Ag and Bi were noted alongside the major ele-ments, at concentrations approximately comparable with those measured by LA-ICP-MS (see below).
Gray-white ‘chalcocite’ from Tinnsja˚ has a composition ranging from close to Cu2S (mean Cu1.95Ag0.04S1.01; M/ S= 1.97, sample Tsj9) to Cu1.931Ag0.015Fe0.016S1.034 (M/ S= 1.905, e.g., sample Tsj1a). As explained in Section
2.1, the high variability inM/Sratio can be attributed to some microscopic intergrowths between chalcocite, the ma-jor species present, and other Cu-sulfides, of which djurleite was identified (Ciobanu and Cook, 2011). Recalculation of the second mean to 2.94 atoms per formula unit gives
(Cu1.89Ag0.015Fe0.015)1.925S1.015, close to ideal djurleite, Cu1.94S.
A second population of a blue mineral, exemplified by samples Tsj2 and Tsj14 (Fig. 3c), has a mean composition and distinct M/S ratio (1.80) very close to digenite, (Cu1.78Ag0.01Fe0.01)1.80S1.00 if calculated to 2.8 atoms. We illustrate the variation inM/Sratio onFig. 3a, which also illustrates the variation in Ag content (as measured by EPMA) with M/Sratio. Although there are data outliers,
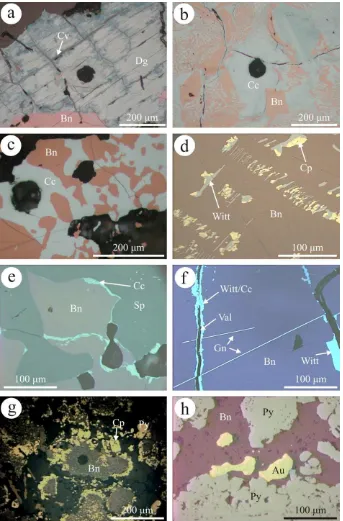
Fig. 3. (a) Diagram expressing electron probe microanalytical data for Cu–Fe–sulfides plotted asM/S(whereM= Cu + Fe + Bi + Ag) vs. atom.% Ag, showing variation inM/Sratio and apparent non-stoichiometry in Cu-sulfides. Yellow squares represent anomalous, Ag-rich Cu–Fe–Sulfide compositions we attribute to sub-microscopic inclusions of stromeyerite and other Ag-minerals rather than solid solution. (b– e) Reflected light photomicrographs of Norwegian hypogene sulfide specimens in immersion oil showing intergrowths among Cu–(Fe)-sulfides that explain some of the anomalous stoichiometry identified in (a). (b), Fine mesh of djurleite (blue) replacing bornite (pink, Bn) from sample Mo3 (Moberg). (c) Incipient and (d) advanced replacement of early Cu-sulfides (chalcocite, Cc) by patchy, fine-grained djurleite (Dj, darker blue); samples Gr1 (Grusen) and Tsj1a (Tinnsja˚), respectively. Note (in d) that replacement follows the chalcocite lamellae. (e) Pronounced anisotropy of digenite (Dg) replaced by covellite (Cv); sample Mo1 (Moberg). Note the homogeneity of the digenite. (For interpretation of color mentioned in this figure the reader is referred to the web version of the article.)
the diagram suggests that silver concentration would ap-pear to decrease withM/Sratio and it lowest in composi-tions approximating to digenite.
The Cu–(Fe)-sulfides from Moberg and Grusen have low-erM/Sratios than in Tinnsja˚, even though some individual analyses correspond to ideal chalcocite (Fig. 3a). In Grusen, for example, mean compositions vary between Cu1.925 -Ag0.015S1.06(M/S= 1.83) in Gr1 to Cu1.86Ag0.01Fe0.03S1.10 (M/S= 1.72) in Gr3. This confirms the identification of ‘digenite’ from optical microscopy (characteristic blue color;
Fig. 3d) even though the lamellar habit and pleochroism indicate that the phase(s) present are not necessarily cubic digenite but rather superstructures derived from digenite. These include anilite (Cu1.75S), which the mean composition in Gr3 approaches if expressed in terms of a formula unit of 2.75 atoms [(Cu1.70Ag0.01Fe0.03)1.74S1.01]. Recalculation of the mean composition in Gr1 to 2.8 atoms per formula unit gives [(Cu1.80Ag0.01)1.81S0.99].
The typically deep-blue Cu-sulfides from Moberg (Fig. 3e) gaveM/Sratios within the range of 1.64 to 1.82 and also characteristically higher Fe contents [mean (Cu1.86Ag0.01Fe0.04)1.91S1.01; M/S= 1.74]. Recalculated as anilite, this gives (Cu1.705Ag0.01Fe0.035)1.75S1.00. We suspect that some of the lowest M/S ratios could be explained by the presence of other phases such as spionkopite (Cu1.39S), yarrowite (Cu1.12S) or covellite (CuS), even if these have not been identified as such.
For the purposes of convenience in the present paper, we refer to the analyzed grains with composition Cu1.9-2.0S as chalcocite (e.g., in the Tinnsja˚ deposit) and those with com-position Cu<1.90S as digenite (e.g., in samples from Moberg and Grusen).
4.2. LA-ICP-MS data
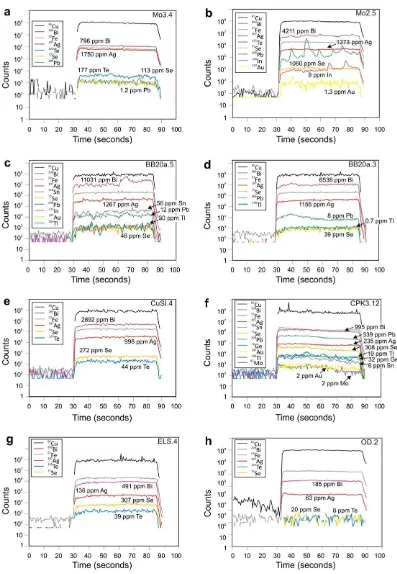
Results for the LA-ICP-MS spot analyses of bornite (204) and chalcocite/digenite (87) and chalcopyrite (15) are summarized inTables 2 and 3and inFigs. 4 and 5. Rep-resentative LA-ICP-MS downhole profiles are shown in
Figs. 6 and 7for bornite and chalcocite/digenite, respec-tively. Full details and statistical analysis of the dataset are given inElectronic Appendix A.
4.2.1. Silver
Silver has among the highest measured values of all ana-lyzed elements; all bornites were found to contain Ag (Fig. 3a), with mean concentrations in a given sample rang-ing from 71 (Olympic Dam) to8000 ppm (Tinnsja˚ Tsj-13). All the metamorphic Cu–veins in southern Scandina-via, except Glava, and most of the BMMB skarns, have comparable Ag concentrations (>1000 ppm). Bornite is clearly a major Ag-carrier in these deposits. Silver mimics the behavior of Cu in the time-resolved downhole profiles collected by LA-ICP-MS (Fig. 6), regardless of whether dis-crete Ag-minerals are present in the sample or not. This suggests that the element likely resides in solid solution. Standard deviations between laser spots from the same sample are typically <5% of the respective mean. Mean val-ues in different samples from a given deposit are always in
the same order of magnitude and distributions show ‘nor-mal’ Gaussian distributions on the histograms (Fig. 4a).
Silver concentrations in coexisting chalcocite/digenite from the Norwegian deposits are consistently higher than in bornite, although at the same order of magnitude (Table 3,Fig. 5a). Like for bornite, profiles are flat, indicating so-lid solution (Fig. 7). Mean concentrations for individual samples range from 3866 to 8164 ppm. The highest single analysis is 36,000 ppm in one grain from Grusen Gr3 (Fig. 7a).
Where both bornite and Cu-sulfides coexist the data show that Ag is concentrated into the Cu-sulfides. Bornite in sample Tsj13, the single sample from Tinnsja˚ in which chalcocite is conspicuously absent, has Ag concentrations as high as in chalcocite from the same locality.
4.2.2. Bismuth
As for Ag, significant concentrations of Bi were identi-fied in all analyzed bornites (hundreds or thousands ppm, in some cases up to 1 wt.%; Fig. 4b). Some variation ap-pears in samples from the same vein locality, e.g., Bi in bornite in samples Tsj13 and Tsj14 from Tinnsja˚ is around half that in the other samples, suggesting some vertical zonation in the system. The highest and most consistent concentrations were determined in all specimens from the Baita Bihor skarn, the locality with the most abundant fields of wittichenite exsolution. Otherwise, the presence of discrete Bi-minerals other than wittichenite does not ap-pear to influence Bi concentrations in bornite. Like Ag, the element always mimics the behavior of Cu in the time-re-solved downhole profiles (Fig. 6), indicating the measured Bi resides in solid solution. Standard deviations between spots from the same sample are low.
In Tinnsja˚, Bi concentrations in coexisting chalcocite are several orders of magnitude lower than bornite (Fig. 7c). The digenite from Moberg and Grusen appears somewhat higher (hundreds of ppm). The data indicate that Bi is always concentrated in bornite relative to both Cu-sulfides, but that digenite is a better Bi-carrier than chalcocite.
4.2.3. Gold
Measured Au values in bornite are low (rarely >0.1 ppm), although individual spots from Sasca Montana and Chelopech give values up to 4 and 6 ppm, respectively. Large signal variations in the time-resolved LA-ICP-MS downhole profiles for these spots suggest the concentrations relate to sub-lm inclusions.
Sample Mo2, with complex sequential exsolution (Fig. 2b), is anomalous in terms of Au content; concentra-tions in bornite range from 0.55 to 3.0 ppm – with smooth LA-ICP-MS downhole profiles (Fig. 6b), confirming that Au may still be locked within the bornite structure, espe-cially if Cu-sulfides are absent or minor in the sample.
In both Moberg and Grusen, coexisting Cu-sulfides may contain Au at concentrations at least one order of magni-tude higher than bornite (ElectronicAppendix A). Of note are concentrations of 1.6 to 24 ppm Au in digenite from Gr3 (the spot giving >36,000 ppm Ag gave 24 ppm Au;
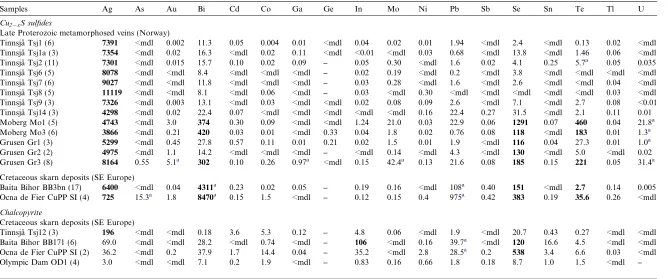
Table 2
Mean concentrations for minor and trace elements in bornite determined by LA-ICP-MS (ppm).
Sample Ag As Au Bi Cd Co Ga Ge In Mo Ni Pb Sb Se Sn Te Tl U
Late Proterozoic metamorphosed veins (Norway,Sweden)
Tinnsja˚ Tsj1 (6) 1366 <mdl 0.002 1085 0.02 0.01 0.01 0.50 0.51 0.03 <mdl 1.96 0.01 3.3 0.04 0.10 <0.01 0.002
Tinnsja˚ Tsj1a (3) 1701 <mdl <mdl 1017 0.02 <mdl <mdl 0.56 0.15 0.07 1.5a 1.35 0.02 15.3 <mdl 0.23 <mdl 0.01
Tinnsja˚ Tsj2 (4) 1609 <mdl <mdl 897 <mdl <0.05 <mdl – 0.84 <0.06 0.26 0.39 <mdl <3.5 <mdl 2.8 <mdl <mdl
Tinnsja˚ Tsj6 (5) 1574 2.5 <mdl 963 <mdl 0.02 <mdl – 0.44 0.09 0.14 1.1 <mdl 2.8 <mdl <mdl 0.01 <mdl
Tinnsja˚ Tsj7 (8) 1325 <mdl <mdl 987 <mdl <mdl <mdl – 0.38 0.07 <mdl 1.4 0.03 4.0 <mdl 0.30 0.02 <mdl
Tinnsja˚ Tsj8 (5) 1329 <mdl 0.012 1238 <mdl <mdl <mdl – 1.3 <mdl <mdl 0.17 <mdl 3.2 <mdl 2.8 <mdl <mdl
Tinnsja˚ Tsj9 (6) 1167 <mdl 0.001 1449 0.03 0.02 0.01 0.52 0.75 0.02 0.01 30.0a <mdl 5.7 <mdl 3.8 0.02 <mdl
Tinnsja˚ Tsj13 (4)b 8079 <mdl 0.14 618 7.1a 0.32 0.29 0.72 0.15 2.7 0.18 19.4 0.02 12.9 0.18 2.3 0.20 3.8
Tinnsja˚ Tsj14 (6) 1594 0.38 0.001 494 0.17 0.004 0.55 0.61 0.15 1.2 0.02 6.7 <mdl 16.7 0.05 0.18 0.01 0.01
Moberg Mo1 (3) 1083 <mdl 0.007 2365 0.06 <mdl 0.06 0.68 5.6 <mdl 0.02 15.3 <mdl 1156 <mdl 27.3 0.01 <mdl
Moberg Mo2 (7) 1233 0.27 1.33 3045 0.06 0.02 0.01 0.53 5.9 31.1a 0.01 185a 0.11 879 0.31 86.1 0.08 6.5a
Moberg Mo3 (4)c 1724 <mdl 0.09 1214 <mdl 0.01 <0.01 0.41 0.10 0.14 0.01 1.8 <mdl 120 0.04 142 0.09 0.04
Moberg Mo6 (11)b 4189 <mdl 4.9 17366 <mdl 0.60 <mdl – 0.32 <mdl <mdl 40.2 <mdl 4617 0.65 63.9 <mdl <mdl
Grusen Gr1 (3) 1240 <mdl 0.013 2611 0.24 0.01 0.01 0.61 2.3 0.03 0.02 4.8 0.01 128 0.22 80.3 <mdl 0.08
Grusen Gr2 (5) 1102 <mdl 0.27a 1526 0.26 0.35 <mdl – 0.95 7.0a 0.19 115a 0.09 103 0.43 7.9 0.13 5.1a
Grusen Gr3 (3) 1411 <mdl 0.05 1873 0.03 0.01 0.18 0.52 2.0 0.25 0.01 18.0 <mdl 143 0.09 16.2 0.02 0.13
Tjøstølflaten Tj1 (5) 1115 – 0.10 657 <mdl 2.0 12.3a 1.6 0.21 0.32 4.8a 9.3 0.10 29.7 0.45 43.4 1.3 –
Glava Gl99.5 (10) 282 – 0.14 1078 1.6 0.01 0.02 1.1 0.01 <mdl 0.04 403a 0.02 2224 0.10 402 0.20 –
Cretaceous skarn,epithermal and porphyry deposits (SE Europe)
Baita Bihor BBH13F (6) 1326 – <mdl 7685 1.6 0.04 0.03 1.1 4.2 <mdl 0.65 5.9 0.04 131 0.13 9.9 0.01 –
Baita Bihor BBH13B (6) 1698 – 0.008 7438 1.1 0.8 0.05 1.2 0.91 <mdl 16.4a 7.8 0.09 147 1.1 11.8 0.02 –
Baita Bihor BBH19CB (6) 1093 – 0.014 6561 0.38 0.09 <mdl 1.1 1.0 0.61 0.10 4.3 0.15 54.0 0.06 2.7 0.04 –
Baita Bihor BBH20A (6) 1193 – <mdl 7666 1.9 0.02 0.02 1.1 1.2 <mdl <mdl 11.8 0.19 40.2 40.1a 6.9 0.56 –
Baita Bihor BB3 (11) 1262 <mdl 0.06 4671 <mdl <mdl <mdl – 0.08 <mdl 0.14 15.1 <mdl 209 <mdl 2.2 0.07 <mdl
Baita Bihor BB170B (10) 1542 2.3 <mdl 1481 0.13 0.02 <mdl – <mdl 0.10 <mdl 49.5 0.08 244 0.33 85.7 0.02 <mdl
Baita Bihor BB171 (8) 1531 <mdl <mdl 1505 <mdl <mdl <mdl – 0.09 <mdl <mdl 43.0a 0.04 235 0.35 82.3 <mdl <mdl
Ocna de Fier CuSI (6) 1107 – 0.09 2987 0.67 0.56 0.06 0.96 8.0a <mdl 0.08 9.2 0.21 268 0.14 43.5 0.13 –
Ocna de Fier CuPP SI (8) 482 <mdl 0.08 5568 0.95 3.9a 0.01 – 8.0a 0.06 0.48 1916a 0.06 1046 0.67 148 0.26 0.003
Sasca Montana SM2 (6) 469 310a 1.8 332 168a 115 22.1 31.1 35.1 5.6 62.3 188 44.2 225 77.1 105 1.5 4.3
Chelopech CPK3 (12) 194 – 1.2 839 1.1 0.01 47a 6.4a 0.1 1.2 0.20 151a 11a 299 2.0a 75.3 6.2 –
Radka R449 (4) 121 8.1 0.001 134 0.11 <mdl 12.5 19.5 1.6 0.22 <mdl 14.7 0.44 1.5 1.0 0.16 0.24 <mdl
Elatsite Els (6) 131 – 0.05 424 0.48 <mdl <mdl 1.1 0.08 <mdl <mdl 3.4 0.01 277 0.32 27.4 0.09 –
Iron oxide – copper – gold (Gawler Craton,South Australia)
Olympic Dam OD1 (10) 70.5 <mdl <mdl 204 0.52 233a 0.03 0.82 0.03 <mdl 36.8a 0.46 0.13 18.8 0.20 9.5 <mdl –
Number in brackets indicates No. of individual spot analyses.
Mean minimum detection limits, mean standard deviations, maxima, minima, mean precisions (%) and mean stage error (%) are given inElectronic Appendix A, together with supplementary data for Fe and Zn not included in this table.
a Time-resolved profile indicates presence of inclusions in some spot analyses; – not analyzed.
b No co-existing chalcocite.
c Anomalous, low-Fe bornite.
Bornite
mineral
chemistry
Table 3
Mean concentrations for minor and trace elements in Cu2xS sulfides and chalcopyrite determined by LA-ICP-MS (ppm).
Samples Ag As Au Bi Cd Co Ga Ge In Mo Ni Pb Sb Se Sn Te Tl U
Cu2xS sulfides
Late Proterozoic metamorphosed veins (Norway)
Tinnsja˚ Tsj1 (6) 7391 <mdl 0.002 11.3 0.05 0.004 0.01 <mdl 0.04 0.02 0.01 1.94 <mdl 2.4 <mdl 0.13 0.02 <mdl
Tinnsja˚ Tsj1a (3) 7354 <mdl 0.02 16.3 <mdl 0.02 0.11 <mdl <0.01 <mdl 0.03 0.68 <mdl 13.8 <mdl 1.46 0.06 <mdl
Tinnsja˚ Tsj2 (11) 7301 <mdl 0.015 15.7 0.10 0.02 0.09 – 0.05 0.30 <mdl 1.6 0.02 4.1 0.25 5.7a 0.05 0.035
Tinnsja˚ Tsj6 (5) 8078 <mdl <mdl 8.4 <mdl <mdl <mdl – 0.02 0.19 <mdl 0.2 <mdl 3.8 <mdl <mdl <mdl <mdl
Tinnsja˚ Tsj7 (6) 9027 <mdl <mdl 11.8 <mdl <mdl <mdl – 0.03 0.28 <mdl 1.6 <mdl 2.6 <mdl <mdl 0.04 <mdl
Tinnsja˚ Tsj8 (5) 11119 <mdl <mdl 8.1 <mdl 0.06 <mdl – 0.03 <mdl 0.30 <mdl <mdl <mdl <mdl <mdl 0.03 <mdl
Tinnsja˚ Tsj9 (3) 7326 <mdl 0.003 13.1 <mdl 0.03 <mdl <mdl 0.02 0.08 0.09 2.6 <mdl 7.1 <mdl 2.7 0.08 <0.01
Tinnsja˚ Tsj14 (3) 4298 <mdl 0.02 22.4 0.07 <mdl <mdl <mdl <mdl <mdl 0.16 22.4 0.27 31.5 <mdl 2.1 0.11 0.01
Moberg Mo1 (5) 4743 <mdl 3.0 374 0.30 0.09 <mdl <mdl 1.24 21.0 0.03 22.9 0.06 1291 0.07 460 0.04 21.8a
Moberg Mo3 (6) 3866 <mdl 0.21 420 0.03 0.01 <mdl 0.33 0.04 1.8 0.02 0.76 0.08 118 <mdl 183 0.01 1.3a
Grusen Gr1 (3) 5299 <mdl 0.45 27.8 0.57 0.11 0.01 0.21 0.02 1.5 0.01 1.9 <mdl 116 0.04 27.3 0.01 1.0a
Grusen Gr2 (2) 4975 <mdl 1.1 14.2 <mdl <mdl <mdl – <mdl 0.14 <mdl 4.3 <mdl 130 <mdl 5.0 <mdl 0.02
Grusen Gr3 (8) 8164 0.55 5.1a 302 0.10 0.26 0.97a <mdl 0.15 42.4a 0.13 21.6 0.08 185 0.15 221 0.05 31.4a
Cretaceous skarn deposits (SE Europe)
Baita Bihor BB3bn (17) 6400 <mdl 0.04 4311a 0.23 0.02 0.05 – 0.19 0.16 <mdl 108a 0.40 151 <mdl 2.7 0.14 0.005
Ocna de Fier CuPP SI (4) 725 15.3a 1.8 8470a 0.15 1.5 <mdl – 0.12 0.15 0.4 975a 0.42 383 0.19 35.6 0.26 <mdl
Chalcopyrite
Cretaceous skarn deposits (SE Europe)
Tinnsja˚ Tsj12 (3) 196 <mdl <mdl 0.18 3.6 5.3 0.12 – 4.8 0.06 <mdl 1.9 <mdl 20.7 0.43 0.27 <mdl <mdl
Baita Bihor BB171 (6) 69.0 <mdl <mdl 28.2 <mdl 0.74 <mdl – 106 <mdl 0.16 39.7a <mdl 120 16.6 4.5 <mdl <mdl
Ocna de Fier CuPP SI (2) 36.2 <mdl 0.2 37.9 1.7 14.4 0.04 – 35.2 <mdl 2.8 28.5a 0.2 538 3.4 6.6 0.03 <mdl
Olympic Dam OD1 (4) 3.0 <mdl <mdl 7.1 0.2 1.9 <mdl – 0.83 0.16 0.66 1.8 0.18 8.7 1.0 1.5 <mdl –
Number in brackets indicates no. of individual spot analyses. Mean minimum detection limits, mean standard deviations, maxima, minima, mean precisions (%) and mean stage error (%) are given inElectronic Appendix AElectronic, together with supplementary data for Fe and Zn not included in this table.
a Time-resolved profile indicates presence of inclusions in some spot analyses; – not analyzed.
N.J.
Cook
et
al.
/
Geochi
mica
et
Cosmoch
imica
Acta
75
(2011)
6473–64
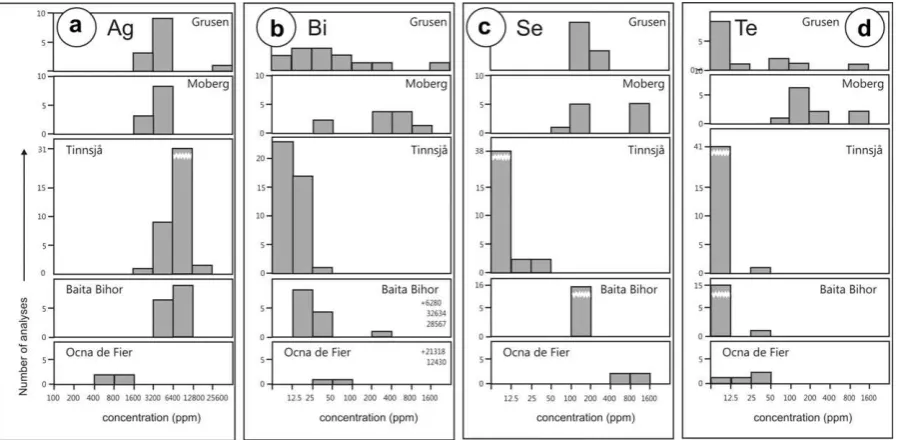
Fig. 4. Histograms (semi-logarithmic scale) illustrating variation in concentrations of (a) Ag, (b) Bi, (c) Se, and (d) Te in bornite from the different deposits in the sample suite.
Fig. 5. Histograms (semi-logarithmic scale) illustrating variation in concentrations of (a) Ag, (b) Bi, (c) Se, and (d) Te in chalcocite and digenite from the different deposits in the sample suite.
In both these samples, Au shows smooth LA-ICP-MS downhole profiles. The data suggest that Au is concentrated in Cu-sulfides over coexisting bornite.
4.2.4. Lead and thallium
Concentrations of up to several hundred ppm Pb have been measured in bornite (Table 2). In most samples values vary from point to point within a given sample over several orders of magnitude. This characteristic, as well as the roughness of the depth profiles and pronounced spikes (e.g., Fig. 6b), suggests that little of the measured Pb is likely to be in the sulfide structure, but is rather contributed by microinclusions of galena and sulfosalts. We exclude any analytical interference since measured208Pb (in cps) is only two orders of magnitude higher than205Tl. Our interpreta-tion is corroborated by the presence of exsolved galena– (clausthalite) solid solution in several specimens. In Sasca Montana, Radka, Elatsite and especially Chelopech, how-ever, the majority of profiles are flat, suggesting that he measured Pb is in solid solution (e.g., Fig. 6e and f). In the four exceptions consistent Pb concentrations of tens or hundreds of ppm are seen with flat downhole profiles. In deposits where irregular profiles dominate, however, flat profiles are also obtained for some spots, e.g., Moberg and Baita Bihor (Fig. 6a and c).
Thallium patterns mimic those of Pb throughout the dataset but at much lower concentrations (typically <1 ppm). However, values >1 ppm are recorded in bornite from Sasca Montana and Chelopech; the latter giving as much as 19.4 ppm Tl in individual spot analyses. In such cases, the time-resolved depth profiles are flat (e.g.,
Fig. 6c), but this may also be interpreted as due to the pres-ence of homogeneously-distributed Pb–Tl–sulfosalts.
4.2.5. Cobalt and nickel
Cobalt and Ni concentrations in bornite and chalcocite are typically around the minimum detection limits (mdl). In sample BB13B from Baita Bihor, where inclusions of Ni–(Co)-bearing phases are observed, anomalous concen-trations in some points (Electronic Appendix A) are tied to such inclusions. Evidence of Co and Ni incorporation in bornite is seen only from the Sasca Montana sample, in which reasonably smooth time-resolved downhole pro-files, averaging 115 ppm Co (range 69–243 ppm) and 62 ppm Ni (range 28–102 ppm) are noted. In line with the behavior of Co and Ni in other common sulfides, we as-sume there must be a degree of substitution of the two ele-ments into the Fe site within bornite.
4.2.6. Gallium, germanium and indium
Concentrations of Ga in bornite are low to extremely low (<0.5 ppm if not <mdl) in all samples except those from Sasca Montana, Radka and Chelopech. In Sasca Montana and Radka, the smooth ablation depth profiles and small relative variation in concentrations are suggestive of solid solution, with mean concentrations of 22 and 13 ppm, respectively. Erratic higher Ga concentrations in other sam-ples (e.g., some analyses from Chelopech) are best attrib-uted to fine inclusions of discrete Ga-bearing phases (e.g., gallite).
Bornite from Sasca Montana, Radka and Chelopech is also enriched in Ge (means 31, 20 and 6 ppm, respectively), again with smooth profiles;Fig. 6f), concentrations <1 ppm are typical of the other samples. Both Ga and Ge are typi-callymdl in chalcocite and digenite. The low Ge concen-trations cannot be quantified with full confidence because of isotopic interference (Danyushevsky et al., 2011).
Our data show that bornite and chalcocite are very poor hosts for In; concentrations rarely exceed a couple of ppm. Exceptions are seen in the Moberg, Grusen, Baita Bihor,
Fig. 7. Representative time-resolved LA-ICP-MS depth profiles for hypogene chalcocite/digenite from (a) Grusen, (b) Moberg, and (c) Tinnsja˚. From left, the background count is 30 s, followed by 60 s ablation time, which is integrated. Parts-per-million concen-trations are given for selected elements. Note flat profiles for many elements, including Mo, U and Pb, suggesting residence (at least in part) in solid solution.
Ocna de Fier and Sasca Montana datasets, with concentra-tions of up to the low tens of ppm. Depth profiles such as that inFig. 6b, with spikes superimposed on otherwise flat spectra indicate that measured In is contributed both by microscopic inclusions of In-bearing minerals (probably sphalerite) and solid solution. In sample BB19CB (Baita Bi-hor), in which sphalerite is apparently exsolved from born-ite, In is strongly partitioned into the sphalerite (800 ppm;
Cook et al., 2009b). A study of In distribution in sphalerite– chalcopyrite–bornite Cu–In veins from Korsvik, Finland (Cook et al., 2011), has shown that In is present as the discrete In-mineral roquesite, followed by sphalerite (>2000 ppm) and chalcopyrite (mean 688 ppm), in order of importance; co-existing bornite contains only around 15 ppm In, even when sharing grain boundaries with roquesite and In-bearing sphalerite. The few chalcopyrite analyses included here are significantly enriched in indium relative to bornite or chalcocite.
4.2.7. Arsenic, antimony and tin
Arsenic concentrations are generally at or below mdl for bornite and chalcocite/digenite from the Fennoscandian deposits for which we have As data. Arsenic was detected in bornite from Sasca Montana. Values of 38–883 ppm were measured, in some cases with relatively flat profiles; others were, however, irregular and probably relate to dusty inclusions of arsenian pyrite.
Antimony concentrations seldom exceed 0.1 ppm in bornite or chalcocite, except in two bornite populations (Sasca Montana and Chelopech) which, as noted above, are characterized by anomalous concentrations of several elements. In these samples, Sb has rough depth profiles sug-gestive of microscale inclusions of Sb-bearing minerals.
Tin concentrations in bornite are also typically <0.2 ppm. Exceptions are the clearly anomalous concentra-tions in bornite with apparently smooth depth profiles from Sasca Montana (14–212 ppm). High Sn values were ob-tained from BB20A and although many show a consistent, irregular profile, correlating with inclusions of Sn-minerals (stannite or mawsonite), some have relatively flat profiles (20 ppm;Fig. 6c).
4.2.8. Molybdenum and uranium
Detectable concentrations of Mo were observed in chal-cocite from Moberg and Grusen, many of which correlate with inclusions of molybdenite. However, several profiles are flat (e.g., 11 ppm;Fig. 7b), suggesting that the measured Mo is in solid solution. Similar flat profiles, albeit an order of magnitude lower, were seen in bornite from Chelopech (e.g.,Fig. 6f).
In both bornite and chalcocite, measurable U concentra-tions (a few ppm) were detected in cases where molybdenite inclusions are present. However, flat profiles for U were observed, in those cases where the Mo profile was also flat (e.g., 8 ppm U; Fig. 6b). We doubt however, whether these large ions are really within solid solution and suspect, based on our ongoing work on other minerals, that U, in particular, may be concentrated as fine inclusions or nano-particles along microstructural discontinuities (grain boundaries within an aggregate, twin planes, etc.
4.2.9. Selenium and tellurium
Bornite and chalcocite from those deposits characterized by the presence of selenides and tellurides show measured values of Se (up to >2000 ppm; Fig. 4c) and Te (up to >400 ppm; Fig. 4d). Variation within a given deposit ap-pears greater than for Ag or Bi (e.g., differences of as much as an order of magnitude between different samples from Moberg; Figs.4c, d and 5c and d). There is no statistical difference between concentrations of the two elements mea-sured in bornite and those in coexisting chalcocite/digenite, suggesting that neither element undergoes partitioning. Selenium always mimics Cu in the LA-ICP-MS downhole profiles, suggesting residence in solid solution (Figs. 6 and 7), but Te, although typically flat, especially at lower concentrations, may also show irregular profiles when inclusions of Bi–tellurides are abundant. The divergent behavior of the two elements with respect to retention in the lattice is seen from Glava, where Se remains in solid solution, whereas Te does not, even though inclusions of both selenides and tellurides are present. Although consis-tent in spots from the same sample, variation in Se across samples from inner skarn to skarn marble contact, as ob-served in the pipe at Baita Bihor (Fig. 8), indicate that this element is sensitive to fluid–rock interaction and thus has potential to track proximal to distal zonation in deposits where metal precipitation is mainly controlled by such a process.
4.2.10. Other elements
Titanium, V, Cr, Mn, Nb and W are consistently at or around mdl throughout our dataset (see footnote toTable 2), except in cases where spikes on the time-resolved down-hole profiles can be related to the presence of inclusions of gangue and oxide minerals containing these elements.
Zinc concentrations fluctuate considerably from a few ppm up to3 wt.% and appear to reflect sphalerite inclu-sions (e.g., in the Sasca Montana sample). Smooth profiles are observed only at concentrations not exceeding around 2 ppm. Cadmium concentrations are generally well below 1 ppm. Erratic higher values, typically with rough profiles, are noted where inclusions of sphalerite are present, sug-gesting that Cd is never present within the bornite lattice.
We monitored105Pd in an attempt to obtain Pd concen-trations in bornite, but values were flawed due to interfer-ence from Cu–Ar interaction in the laser chamber (65Cu + 40Ar).
4.3. Data trends
Silver and Bi are two of the chalcophile elements that are clearly in solid solution and present in high concentrations across the dataset. The relationship between the two ele-ments warrants assessment. The plot of Ag vs. Bi for Type-A high-temperature bornite and coexisting chalco-cite/digenite from the Scandinavian deposits (Fig. 9a) shows a clear discrimination between the minerals, with the bornite data showing a roughly positive correlation and located in the lower right of the plot and the data for chalcocite/digenite clustered into the upper left. This trend clearly indicates that Ag is partitioned into the chalcocite/ digenite whereas Bi is concentrated in the bornite. Bornite data from sample Tsj13 (arrowed), the only sample from Tinnsja˚ in which chalcocite is absent, plot as an outlier
on Fig. 9a, showing that Ag is retained within bornite in the absence of exsolved Cu-sulfides. A second cluster plot-ting away from the other data (also arrowed onFig. 9a) is from one sample from Moberg (Mo6) which also contains no coexisting chalcocite/digenite. Both these sub-popula-tions are interpreted as ‘unexsolved’ high-temperature bornite.
Silver–Bi relationships in Cu–Fe–Sulfides in samples from the Southeastern Europe deposits are shown in
Fig. 9b (with the Olympic Dam data also added for com-pleteness). There is generally a strong positive correlation between the two elements in bornite from associations with-out exsolved chalcocite/digenite and overall, similar trends as inFig. 9a are observed. Type-A bornite is typically richer in both elements than the lower-temperature Type-B popu-lation. A limited number of bornite–chalcocite pairs from Baita Bihor and Ocna de Fier are, however, not concordant with the overall partitioning of Ag into chalcocite and Bi into bornite, with chalcocite being richer in Bi (and Ag) than the coexisting bornite. Our observations of restricted pockets of native copper within Cu-ores at Baita Bihor led us to speculate that these ‘outliers’ (arrowed on
Fig. 9b) are not hypogene in origin and have instead re-sulted from non-equilibrium, presumably supergene enrich-ment processes.
There are a number of element pairs where a positive correlation might be expected because of the geochemical affinity of the elements concerned and observed trends in other sulfides and related compounds (e.g., Ciobanu et al., 2009b). Examples would include Ag and Au or Au and Bi, show either no clear pattern, or even a weak nega-tive correlation (e.g., Au and Bi,r=.328). One element pair where a correlation might have been expected is be-tween Ag and Se. In this case (Fig. 10a), there is no corre-lation, and even the suggestion of a negative correlation within individual deposit-specific subsets. Although no gen-eral trend is seen for Bi vs. Te, stronger positive correlations are recognizable within data subsets for individual deposits or groups of deposits. The strong Bi–Te in Glava, for exam-ple, is concordant with the presence of abundant micro-scopic inclusions of Bi–tellurides.
One of the aims of our work was to identify trace ment pairs which might suggest that the presence of one ele-ment might assist incorporation of the other. There is a positive correlation between Se and Te in the total dataset, i.e., in both bornite and chalcocite (r= 0.64;Fig. 10b), in that sulfide grains richer in Se are generally also richer in Te. Subsets for individual deposits can be readily picked out as clusters with varying Te within more limited ranges of Se concentration. There is a relatively weak correlation between Au and Te (Fig. 10c), albeit with a Au:Te ratio of 1:100. We speculate that this trend can be explained by the presence of sub-microscopic inclusions of Au–Ag– tellurides or composite inclusions of gold/electrum and other tellurides. Although we do not have As data for all samples, there is no observable correlation between As and either Au, Ag or any other elements.
We observe a modest correlation between Sn and In (Fig. 10d) in which the correlation is particularly strong among bornites from the Scandinavian deposits. The
Fig. 9. Log–log plot of Bi vs.Ag concentrations in bornite and chalcocite/digenite in: (a) hypogene vein ores (Type-A) from Scandinavian deposits sampled in this study; and (b) deposits from southeastern Europe (Types – A and – B) and Olympic Dam. In (a), most bornite data plots within the pink area and all chalcocite/digenite data plots within the light gray area. Exceptions to this are the anomalously Ag-rich bornites in samples Tsj13 and Mo-2 (both arrowed). In both cases, there is no coexisting chalcocite or digenite, leading to their interpretation as ‘unex-solved’ high-temperature bornite. (For interpretation of color mentioned in this figure the reader is referred to the web version of the article.)
surprisingly good correlation between Mo and U across the dataset (r= 0.84;Fig. 10e) can most readily be related to the presence of inclusions of intergrown molybdenite/urani-nite, although as mentioned above, both elements also seem to enter the structure of the Cu–(Fe)-sulfides in low concen-trations. We also observe a good correlation between Pb and Tl (r= 0.56; Fig. 10f), the correlation between the two elements being particularly strong for subsets from the lower-temperature Type-B epithermal bornites from Chelopech and Radka as well as the Sasca Montana Cu-skarn.
5. DISCUSSION
The multi-element data in this paper represent a first at-tempt to compare the minor and trace element signatures of Cu–(Fe)-sulfides formed (with a few exceptions) at rela-tively high temperature from hydrothermal fluids of either orogenic or magmatic origin. We have not sought to mea-sure trace elements Cu–(Fe)-sulfides from geologically com-plex deposits or where there is widespread evidence of supergene processes in Cu–Fe–sulfide formation. Our data complement published data from other deposits obtained
by EPMA and SIMS methods as well as LA-ICP-MS, even if this is generally focused on a more limited range of ele-ments. Below we evaluate our data in the light of: (i) pub-lished experimental work on relevant phase systems; and (ii) published data on natural bornite and Cu–(Fe)-sulfides. Our objectives with doing this are to interpret the patterns within our datasets and to correlate the patterns with the observations on texture and paragenesis in the individual deposits.
5.1. Insights from experimental work
Studies covering the solubility of Bi, Ag and Au in born-ite and chalcocborn-ite at a broad range of temperature are incomplete. This impedes interpretation of measured trace element concentrations and observed exsolution textures.
5.1.1. Bismuth
The work ofSugaki et al. (1981, 1984)in the system Cu– Fe–Bi–S at 300 and 420°C has relevance for understanding Bi behavior in bornite and Cu-sulfides. The experimental work shows substantial Bi incorporation into bornite, as much as 17 wt.% at 420°C and 10 wt.% at 300°C, the latter retained in the bornite even after exsolution of wittichenite. In the sub-system Cu–Bi–S, chalcocite will coexist with wit-tichenite below 395°C (Sugaki and Shima, 1972). An intermediate phase (Cu9BiS6) occupies a solid solution field above this temperature, but has not been identified in nat-ure. It was also not found in the experimental work of
Buhlmann (1971), who instead identified broad solid solu-tion between Cu2S and Cu3BiS3(see alsoChang and Hoda,
1977). However,Tomeoka and Ohmasa (1982)synthesized Cu9BiS6 and again refuted the idea of solid solution be-tween Cu2S and Cu3BiS3on the basis of crystal-structural constraints of accommodation of the large Bi atoms into either type of chalcocite. They admitted, however, that some degree of solid solution may exist for hexagonal high-temperature chalcocite (>435°C). Decomposition of a Cu9BiS6 phase would result in chalcocite–wittichenite exsolutions according to:
Cu9BiS6$3Cu2SþCu3BiS3
We believe that characteristic chalcocite–wittichenite exsolutions seen within areas of square section in Tinnsja˚ (Fig. 2c) may represent the breakdown of a Cu9BiS6phase. In our dataset the higher Bi concentrations (thousands of ppm) are found in skarn bornite that contains exsolution of wittichenite, and the highest values (approaching 10,000 ppm) are seen in Baita Bihor where these are the most abundant. Such values are, however, still an order of magnitude lower that those reported in the experimental work (Sugaki et al., 1984). Lower Bi concentrations in Type-A bornite (hundreds of ppm) are seen in bornite that has only minor wittichenite or where wittichenite is tied to exsolution in chalcocite. The lowest Bi concentrations are recorded in Type-B bornite, including that from Olympic Dam. The subsets for Glava, Chelopech and Elatsite plot somewhat anomalously on Fig. 9b with respect to any
direct temperature control on Bi concentration. The lower values in Glava may be explained by abundant Bi-tellu-ride/selenide inclusions that could have nucleated within bornite with an initially much higher Bi concentration dur-ing orogenic reworkdur-ing. The unexpected inversion in abso-lute abundances between Chelopech and Elatsite (a paired porphyry–epithermal system) can be commented in terms of multi-component assemblage in the first case relative to the second, for example the effect of excess Fe in the system to stabilize a higher Bi content in the bornite (Sugaki et al., 1984). Alternatively, the hydrothermal fluids may have undergone fractionation with respect to Bi with that ele-ment concentrated in the epithermal (Chelopech) part of the system relative to the porphyry (Elatsite).
In contrast to bornite, chalcocite exsolving wittichenite is generally very poor in Bi. Among the Cu-sulfides, we note, however, that digenite appears to retain Bi at concen-trations of similar magnitude to those of Type-A bornites, although coexisting bornite in the same sample will be ri-cher still.
Certain elements may have a role in stabilizing certain types of exsolution products, e.g., the availability of Pb, Ag, to form miharaite (Sugaki et al., 1980). The latter is ob-served in some samples from Baita Bihor bornite (though not in the analyzed samples) and co-exists with wittichenite and chalcopyrite.
5.1.2. Silver
Three ternary phases are known in the system Cu2S– Ag2S (jalpaite, mckinstryite and stromeyerite). Each has a relatively narrow compositional range (e.g., mckinstryite;
Kolitsch, 2010). Extensive solid solution in the portion of the Ag2S–Cu2S join between stromeyerite and chalcocite is commonly illustrated at elevated temperature (e.g.,
“face-centered cubic solid solution” at 500°C; Chang
et al., 1988) and becomes complete above 592°C (Skinner,
1966).Harlov and Sack (1995)infer that Ag+and Cu+do not directly substitute for one another in Ag-poor hexago-nal close-packed (Cu,Ag)2S (i.e., between 103 and 435°C). The limits of solid solution remain unknown, largely due to the difficulty of conducting experiments on the crystal-chemically complex phases in the system Cu2S–Ag2S and between Cu2S and CuS and the widespread presence of minor Fe in some natural minerals that may influence their stability.
There is, unfortunately, an acute lack of experimental work in the quaternary Ag2S–Cu2S–FeS system and the limits of Ag substitution in bornite are unknown at the present time.
5.1.3. Gold
Simon et al. (2000)have summarized the solubility of Au in bornite at temperatures from 400 to 700°C. Solubility drops rapidly from several thousand (1280 to 8200) ppm at 600°C to 13 to 80 ppm at 400°C. Dependence on the bornite composition was demonstrated; stoichiometric bornite apparently carrying the highest Au concentrations. Earlier, Makovicky et al. (1995)demonstrated substantial solid solution (up to 1.5 at.% Au) in the system Cu–Fe– Au–S at 700°C.