67
RANDOM ADJUSTMENT - BASED CHAOTIC METAHEURISTIC ALGORITHMS FOR IMAGE CONTRAST ENHANCEMENT
Vina Ayumi, L. M. Rasdi Rere, Mochamad I. Fanany, and Aniati M. Arymurthy
Faculty of Computer Science, Universitas Indonesia, Kampus UI, Depok, 16424, Indonesia E-mail: [email protected], [email protected]
Abstract
Metaheuristic algorithm is a powerful optimization method, in which it can solve problems by exploring the ordinarily large solution search space of these instances, that are believed to be hard in general. However, the performances of these algorithms significantly depend on the setting of their parameter, while is not easy to set them accurately as well as completely relying on the problem’s characteristic. To fine-tune the parameters automatically, many methods have been proposed to address this challenge, including fuzzy logic, chaos, random adjustment and others. All of these methods for many years have been developed indepen- dently for automatic setting of metaheuristic parameters, and integration of two or more of these methods has not yet much conducted. Thus, a method that provides advantage from combining chaos and random adjustment is proposed. Some popular metaheuristic algo- rithms are used to test the performance of the proposed method, i.e. simulated annealing, particle swarm optimization, differential evolution, and harmony search. As a case study of this research is contrast enhancement for images of Cameraman, Lena, Boat and Rice. In general, the simulation results show that the proposed methods are better than the original metaheuristic, chaotic metaheuristic, and metaheuristic by random adjustment.
Keywords: metaheuristic, chaos, random adjustment, image contrast enhancement
Abstrak
Algoritma Metaheuristic adalah metode pengoptimalan yang hebat, di mana ia dapat memecahkan masalah dengan menjelajahi ruang pencarian solusi yang biasanya besar dari contoh-contoh ini, yang diyakini sulit dilakukan secara umum. Namun, kinerja algoritme ini sangat bergantung pada pengaturan parameter mereka, namun tidak mudah untuk menetapkannya secara akurat serta sepenuhnya bergantung pada karakteristik masalah. Untuk menyempurnakan parameter secara otomatis, banyak metode telah diajukan untuk mengatasi tantangan ini, termasuk logika fuzzy, kekacauan, penyesuaian acak dan lain-lain. Semua metode ini selama bertahun-tahun telah dikembangkan secara terpisah untuk penentuan parameter metaheuristik secara otomatis, dan integrasi dua atau lebih dari metode ini belum banyak dilakukan. Dengan demikian, metode yang memberikan keuntungan dari penggabungan kekacauan dan penyesuaian acak pun diusulkan. Beberapa algoritma metaheuristik populer digunakan untuk menguji kinerja metode yang diusulkan, yaitu simulasi anil, optimasi partikel, evolusi diferensial, dan pencarian harmonis. Sebagai studi kasus penelitian ini adalah peningkatan kontras untuk citra Cameraman, Lena, Boat and Rice. Secara umum, hasil simulasi menunjukkan bahwa metode yang diusulkan lebih baik daripada metaheuristik asli, metaheuristik kacau, dan metaheuristik dengan penyesuaian acak.
Kata Kunci: metaheuristik, chaos, penyesuaian acak, peningkatan kontras gambar
1. Introduction
Image enhancement is one of the main concerns in image processing that aims to improve the appearance of an image, to enhance their vis-ual qvis-uality on human eyes, including to sharp-en the features and to increase the contrast. Image enhancement it is useful to further image appli-cation, such as facilitating image segmentation, recognizing and interpreting useful information from the image, but does not increase nor
decrea-se the esdecrea-sential information of the original image. In general, the image enhancement methods can be divided into four classes, i.e. contrast enhan-cement, edge enhanenhan-cement, noise enhancement and edge restoration [1]. Among those techniques, contrast enhancement is the focus of this paper.
contrast stretching employs a linear transform-ation that remaps the gray-levels in a given image to fill the full range of values, and histogram equalization applies a transformation that produ-ces a close to uniform histogram for the relative frequency of the gray-levels in the image [2].
In recent times, many metaheuristic methods have been developed for image processing appli-cations, including image enhancement problems. Some paper [2-4] report that these methods outperform for image contrast enhancement than classical point operation. Based on some princi-ples of biology, physics or ethology; almost all of metaheuristic are nature-inspired. Other classifi-cations form of this method is single-solution and population-based based metaheuristic [5].
Three main purposes of metaheuristic algo-rithm: solving large problems, solving prob- lems faster, and obtaining robust algorithms [6]. parameters of metaheuristic automatically . Liu and Lampinen [7] proposed FADE (fuzzy adap-tive differential evolution), where the fuzzy logic is used to ad the param- eter controls of mutation and crossover. Di and Wang [8] use harmony search with chaos for training RBFNN (radial basis function neural network). Coelho et al. [1] use chaos to optimize DE for image contrast enhancement. Ferens et al [9] proposed CSA (chaotic simulated annealing) for task allocation in a multiprocessing system. Noman et al. [10] proposed adaptive DE (aDE) based on random adjustment, where the strategy is by com- paring the objective of spring with the average value of the current generation. Li et al. [11] introduced market-oriented task-level scheduling in cloud workflow systems using chaos to particle swarm optimization (PSO).
All of that methods have each of advantage on automatically adjusting of metaheuristic para-meters, however, integration two or more of them are rarely conducted. In this paper, we integrate 2 methods, chaos and random adjustment for attaining benefit from both of them. Chaos can be used to avoid being trapped into a local minimum and to enrich the searching behavior. On the contrary, random adjustment can be applied to achieve greater accuracy. Four types of meta-heuristic algorithms are selected to represent all categories for test the proposed method perform-ance: physics phenomena and a single solution based represent by SA, biology phenomena and population-based represent by DE, ethologic phe-nomena and also population-based represent by
PSO, and musical phenomena as well as popu-lation-based, represents by HS.
This paper is organized as follows: Section 1 is introduction; Section 2 gives description of image contras enhancement; Section 3 describe the proposed methods; Section 4 we present simulation result; and conclusion of this paper in Section 5 (one blank single space line, 10 pt)
2. Methods
Image Contrast Enhancement
Contrast enhancement is applied to transform an image based on the psychophysical characteristics of the human visual system. Two techniques that are usually used for contrast enhancement are indirect and direct methods of contrast ment [12]. The indirect image contrast enhance-ment algorithms enhance the image without measuring the contrast. The direct local contrast enhancement algorithms create a criterion of contrast measure and improving the contrast measurement directly to enhance the images [1]. The proposed method in this paper are applied using a direct image enhancement approach to adjust the gray-level intensity transformation in the image. The setting up of a suitable image contrast measure is a critical step in direct image enhancement approach.
In spatial domain to the gray-level image, the enhancement uses transformation function. To generate the enhanced image, the transformation function generates a new intensity value for each pixel of original image as shown in equation(1).
ℎ(𝑖, 𝑗) = 𝑇[𝑓(𝑖, 𝑗)] (1) regarding the relative difference between a central region and a larger surrounding area of a given pixel. By some of the contrast enhancement functions, the contrast values are then enhanced. The enhancement function such as the square root function, the exponential, the logarithm and the trigonometric functions [12].
𝑇[𝑓(𝑖, 𝑗)] = (𝑠𝜎(𝑥, 𝑦) + 𝑞) .𝑀 [𝑓(𝑥, 𝑦)
− 𝑟. 𝑚(𝑥, 𝑦)] + 𝑚(𝑥, 𝑦)𝑝 (2)
where (x,y) and m(x, y) are the standard deviation and the gray-level mean respectively, computed in a neighborhood centered at (x, y). Where M is the global mean of the image, f(x, y) and g (x, y) is the level intensity and the pixels output gray-level intensity value of input image pixel at location (x, y) [1].
A nonzero value for q in (2) allows for zero standard deviation in the neighborhood while c allows for only a fraction of the mean m(x, y) to subtracted from the original pixels gray-level f(x, y). The last term m(x, y)p may have a brightening and smoothing effect on the image. The parameters of p, q, r and s defined over the positive real number and they are the same for the whole image [3]. According to an objective function that describes the contrast of the image, the task of metaheuristic in this formula is to find the combination of parameters p, q, r and s.
A criterion for enhancement method should be chosen to apply an automatic image enhan-cement technique, which does not require human intervention and no objective parameters are given by the user. This criterion will be directly related to the objective function of the meta-heuristic methods. The objective function adopted in this paper for an enhancement criterion shown in equation(3).
𝐹(𝑀) = 𝐥𝐨𝐠 (𝐥𝐨𝐠 (𝐸(𝐼(𝑀)))) .𝑛𝑒(𝐼(𝑀))𝑃𝐻. 𝑃𝑉 . 𝐻(𝐼(𝑀))
(3)
Function F(M) and I(M) denote an objective func-tion for maximizafunc-tion problem and the original image I with the transformation T in each pixel at location (x, y) applied according to Eq. (1). Where the respective parameters p, q, r, and s are given by the M = (p q r s). Furthermore, E(I(M)) is the intensity of the edges detected with a Sobel edge detector that is applied to the transformed image I(M). ne(I(M)) is the number of edge pixels as detected with the Sobel edge detector, PH and PV are the number of pixels in the horizontal and vertical direction of the image, respectively. Lastly, the entropy of the image I(M) measured by H(I(M)) [1].
Proposed Method
Most of the metaheuristic algorithms have rele-vant parameters, such as amplification factor (F) these parameters are usually sensitive, in while an improper setting of them can result in the poor performance of the system. Some studies have been conducted to adjust automatically these parameters based on the characteristic of the problems, including fuzzy logic, chaos, random adjustment, and others.
In this paper, we proposed a combination of chaos and random adjustment to improve the performance of some metaheuristic algorithms. Characteristic of chaos is nonlinear systems. Although it looks like to be stochastic, then it occurs in a deterministic nonlinear system under deterministic condition [13]. This method can avoid being trapped into local optimum and improve the performance of searching [1]. One of the systems is chaotic sequence, defined in behaves chaotically in an unpredictable pattern, or oscillates between a limited sequence of sizes. A very small difference in the initial value of x causes substantial differences in its long-time behavior. In this work, the variety of µ is 1 < µ < 4; x is distributed in the range [0, 1] provided the initial x(1) ∉ 0, 0.25, 0.50, 0.75, 1.
In case of random adjustment, for instances DE algorithms, the strategy by comparing object-ive value of the offspring f(𝑥𝑁𝑐ℎ𝑖𝑙𝑑) with the average of objective value in current generation favg . If f(𝑥𝑁𝑐ℎ𝑖𝑙𝑑) is better than favg , then mutation factor and crossover rate of the primary parent are retained in offspring, or else the parameters are changed randomly.
Random Adjustment-based Chaotic SA
Simulated annealing (SA) is a robust and compact technique was first proposed by Kirk-patrick et al. [14]. With a substantial reduction in computation time, SA provides excellent solutions to single and multiple objective optimization problems. The origin of this method is Metropolis algorithm [15]. Inspired by annealing technique, this method aims to obtain the solid state of minimal energy or ground states of matter. This technique consists in heating a material to the high temperature, then in lowering the temperature slowly.
probability of being in any particular state x is given by equation(5).
𝑝(𝑥) = 𝑒−∆𝑓(𝑥)𝑘𝑇 (5)
where f(x) is the energy of the configuration, k is Boltzmanns constant, and T is temperature. In this paper, we proposed 3 variant of methods for chaotic SA based on random adjustment. First is CSARA-1, where parameter of k is replaced by generating the value from chaotic sequence. Otherwise, the reduction factor parameter c is adjusted randomly. This value of c is used in a process when the result of the new objective function is better than the old objective function, or when the random value r is bigger than the Boltzmann distribution p(x). This process will continue until the desired criteria have been bigger than the value of p(x), the value of k is still used in the process.
The third variant is CSARA-3, in which the parameter of k is constant, and c is produced from a chaotic sequence. The value of c is not substituted, as long as the new objective function is better than the old objective function, or the random value of r is bigger than the value of p(x). Random Adjustment-based Chaotic DE
Differential Evolution (DE) is one of the latest evolutionary algorithms proposed by Price and Storn in 1995 that applied to a continuous optimization problem. This method proposed to solve the chebyshev polynomial fitting problem and have proven for many different tasks to be a very reliable optimization strategy [5]. Starts by sampling the search space at multiple, DE algorithm randomly selected search points and creates new search points through perturbation of the existing points. DE creates new search points which are evaluated against their parents using the operation of differential mutation and recombina- tion. Furthermore to promote the winners to the next generation, a selection mechanism is applied. Until the termination criterion is satisfied, this cycle is iterated [10]. Price et al. have suggested different variant of DE, which are conventionally named DE/x/y/z. DE/rand/1/bin is the classical version as shown in equation(6), the target vector is randomly selected in mutation process, and only one different vector is used. The acronym of
bin indicates a binomial decision rule that controlled the crossover.
𝑥𝐺𝑚𝑢𝑡= 𝑥𝐺𝑟1+ 𝐹(𝑥𝐺𝑟2− 𝑥𝐺𝑟3) (6)
In this paper, we proposed 3 variant methods for DE. First is CDERA-1, where CR parameter is generated by chaotic sequence and mutation factor F is created randomly. On condition that new objective function is better than the average of old objective function, parameter of F is kept in used in the process. However, if not the new parameter of F is created randomly. All of the procedure will continue until the termination cri-terion is satisfied. The second variant is CDERA-2, where F parameter is created by chaotic sequ-created from chaotic sequence. The value of CR is not replaced, as long as the new objective function is better than the average of old objective function. Otherwise, it uses the next value of chaotic sequence.
Random Adjustment-based Chaotic PSO
range [0,1], constant multiplier terms c1 and c2 are known as acceleration coefficients. They represent the attraction that a particle has either towards its own success or towards the success of its neighbors, respectively.
To overcome the premature convergence problem of PSO, the inertia weight ω is used. A large inertia weight encourages global exploration while a smaller inertia weight encourages local exploitation [5]. The position of each particle 𝑥𝑖𝑗 is also updated in every each iteration by adding the velocity vector 𝑣𝑖𝑗+1 to the position vector, using equation(8).
𝑥𝑖𝑗+1= 𝑥𝑖𝑗+ 𝑣𝑖𝑗+1 (8)
In this paper, we proposed three alternative methods for PSO. First is CPSORA-1, where parameters of r1 and r2 are replaced by generating their values from the chaotic sequence. These values of r1 and r2 are kept in used as long as the new objective function is better than average objective function. Otherwise, the next value of the chaotic sequence is used. This process will continue until the desired criteria have been achi-eved. The second variant is CPSORA-2, where r1 is a constant value, and r2 is created from the chaotic sequence. On condition that the new objective function is better than the average of old objective function, r2 is kept in used in the pro-cess. Otherwise, it uses the next value of chaotic sequence The third variant is CPSORA-3, where essentially is the same with the second variant, but in this case, r1 is created from the chaotic sequence, and r2 is a constant value.
Random Adjustment-based Chaotic HS
Harmony search (HS) proposed by Zong Woo Geem et al in 2001 is a search algorithm considered to be a population-based. By the musical process of searching for a perfect state harmony, this method is inspired. The optimization solution vector analogous to the har- mony in music, and the local and global search schemes in optimization techniques analogous to the musicians improvisations. The HS algorithm uses a stochastic random search that is based on the harmony memory considering rate (HMCR) and the pitch adjusting rate (PAR) so that derivative information is unnecessary [17].
Three possible options exist when a
musici-an improvises one pitch: (1) playing musici-any one pitch from his/her memory, (2) playing an adjacent pitch of one pitch from his/her memory, (3) playing a totally random pitch from the possible sound range. Similarly, when each decision variable chooses one value in the HS algorithm, it follows any one of three rules: (1) choosing any one value from HS memory (defined as memory considerations), (2) selecting an adjacent value of one value from the range (defined as pitch adjustments), (3) choosing the random value from the possible value range (defined as randomi-zation)[17].
In this paper, 3 alternative methods for HS are proposed. First is CHSRA-1, where parame-ters of HMCR and PAR are replaced by gene-rating their values from the chaotic sequence. These values are kept in used, as long as the new objective function is better than the averages the old objective function. Otherwise, the next value of the chaotic sequence is used. This process will continue until the desired criteria have been achieved. The second variant is CHSRA-2, where HMCR parameter is created by chaotic sequence and PAR parameter is selected randomly. In case of new objective function is better than average objective function; PAR is kept in used in process, else PAR is created randomly. The third variant is CHSRA-3, wherein essential is the same with the second variant. In this case, PAR is created from chaotic sequence, and HMCR is selected random-ly.
3. Results and Analysis
The optimization problem in this paper is to enha-nce the image contrast using chaotic metaheuristic algorithms based on random adjustment approach-es. The simulation objective is to increase the overall intensity at the edges, increasing the mea-surement of entropy, and maximize the number of pixel in the edges. Moreover, the simulation with original metaheuristic, metaheuristic use chaotic sequence, and metaheuristic by random adjust-ment are also conducted.
All of the algorithms were programmed and implemented in MatlabR211a, on personal com-puter with processor Intel Core i7-4500U, 8 GB RAM running memory, in Windows 8.1. To evaluate the image enhancements based on these proposed methods, four images were evaluated, i.e. Cameraman, Rice, Boat, and Lena; all of them have been resized at 256x256 pixels, and are converted into double precision for numerical computation. In case of contrast color image enhancement, at the first time, the RGB color spaces (red, green, blue) is converted into YIQ color space (luminance, hue, saturation), and then apply them to the methods only for the Q component. After that process, they convert back to the RGB color space
Simulation of SA, SARA, CSA and CSARA
Simulation of simulated annealing algorithm is carried out in 13 conditions. First, group is 3 simulations on the original of simulated anneal-ing: SA1 (k=1,c=0.2), SA2 (k=1,c=0.5), SA3 (k=1,c=0.8). Second is 4 simulations on SA by
random adjustment: SARA1 (k = RA, c = 0.2), SARA2 (k = RA, c = 0.5), SARA3 (k = RA, c = 0.8), SARA4 (k = c = RA). Third is 3 simulations on SA by chaotic: CSA1 (k = Ch, c = 0.2), CSA2 (k = Ch, c = 0.5), CSA3 (k = Ch, c = 0.8), and fourth is 3 simulations on the proposed methods, i.e. chaotic SA based on random adjustment: CSARA1 (k = Ch, c = RA), CSARA2 (k = RA, c = Ch), CSARA3 (k = 1, c = ChRA).
Simulation results for all SA algorithms are given in Table 1. These results show that mean objective function of the proposed methods achieves the higher value for all images: CSARA3 for image of Lena (M1 = 0.1554), CSARA1 for image of Boat (M2 = 0.1351), Cameraman (M3 = 0.1584) and rice (M4 = 0.2512). In case of computation time, the comparisons from the simulation results for SA algorithms shows that for all images, the best computa- tion time is SA1: Lena (T1 = 43.17s), Boat (T2 = 47.73s), Came-raman (T3 = 36.90s), , and Rice (T4 = 71.83s).
Moreover, the best objective function of proposed methods also gives better value for all images: CSARA1 with SARA3 for the image of
TABLE1
SIMULATION RESULTS OF SA,SARA,CSA, AND CSARA
Methods Lena Boat Cameraman Rice
M1 T1 M2 T2 M3 T3 M4 T4
SA1 0.1515 43.17 0.1323 36.89 0.1480 47.73 0.2494 71.83
SA2 0.1542 119.83 0.1346 78.48 0.1539 103.36 0.2500 104.44
SA3 0.1537 286.30 0.1342 212.42 0.1572 174.46 0.2494 317.36
SARA1 0.1544 259.12 0.1328 179.23 0.1545 239.78 0.2497 182.84
SARA2 0.1534 99.76 0.1330 75.64 0.1529 70.26 0.2508 68.43
SARA3 0.1544 232.97 0.1346 177.40 0.1589 238.57 0.2510 183.42
CSA1 0.1530 208.42 0.1323 181.72 0.1580 227.80 0.2510 187.95
CSA2 0.1545 89.19 0.1350 172.80 0.1527 94.58 0.2503 97.02
CSA3 0.1531 271.93 0.1336 227.02 0.1514 185.21 0.2500 240.01
CSARA1 0.1549 210.74 0.1343 206.11 0.1521 187.06 0.2510 183.05
CSARA2 0.1551 207.87 0.1351 180.32 0.1568 242.06 0.2508 121.18
CSARA3 0.1541 259.45 0.1331 175.00 0.1508 239.89 0.2510 191.98
TABLE2
SIMULATION RESULTS OF DE,DERA,CDE AND CDERA
Methods Lena Boat Cameraman Rice
M1 T1 M2 T2 M3 T3 M4 T4
DE1 0.1577 134.83 0.1343 112.89 0.1587 120.27 0.2536 117.23
DE2 0.1568 137.30 0.1412 87.54 0.1576 119.43 0.2529 118.70
DE3 0.1513 140.33 0.1310 113.39 0.1515 120.35 0.2476 118.37
DE4 0.1504 136.90 0.1344 113.88 0.1595 120.19 0.2481 115.91
DE5 0.1517 134.06 0.1352 111.89 0.1507 120.41 0.2477 91.82
DERA1 0.1549 134.10 0.1399 119.41 0.1562 120.68 0.2531 118.97
DERA2 0.1558 134.06 0.1400 115.87 0.1578 91.21 0.2515 119.50
DERA3 0.1565 134.82 0.1272 115.72 0.1580 116.59 0.2529 119.17
CDE1 0.1559 105.83 0.1418 86.41 0.1578 106.46 0.2529 91.67
CDE2 0.1568 134.63 0.1406 115.54 0.1582 120.70 0.2531 119.04
CDE3 0.1532 133.89 0.1413 113.29 0.1580 91.04 0.2530 118.46
Lena (0.1590); CSARA1 with SARA3, SARA4, and CSA2 for image of Boat (0.1436); CSARA3 for images of Cameraman (0.1703) and Rice (0.2539). In case of the worst objective function, the original of SA gives the less value for all images: SA1 for images of Lena (0.1301) and Cameraman (0.1154); SA2 for the image of Rice (0.2278); SA3 for the of Boat (0.1162).
Simulation of DE, DERA, CDE and CDERA
Simulation of differential evolution algorithm is carried out in 14 conditions. First, group is 5 simulations on the original differential evolution: DE1 (F = CR = 0.8), DE2 (F = CR = 0.5), DE3 (F = CR = 0.2), DE4 (F = 0.8, CR = 0.2), DE5 (F = 0.2, CR = 0.8). Second is 3 simulations on DE by random adjustment: DERA1 (F = CR = RA), DERA2 (F = RA, CR = 0.5), DERA3 (F = 0.5, CR = RA). Third is 3 simulations on chaotic DE: CDE1 (F = CR = Ch), DE2 (F = Ch, CR = 0.8), DE3 (F = 0.8, CR = Ch) and fourth is 3 simulations on the proposed methods, i.e. chaotic DE based on random adjustment: CDERA1 (F =
RA, CR = Ch), CDERA2 (F = Ch, CR = RA), CDERA3 (F = 1, CR = ChRA).
Simulation results for all DE algorithms are given in Table 2. These results show that, mean objective function of the proposed methods achi-eve the higher value only for 2 images: CDERA3 for image of Boat (M2=0.1420) and CDERA2 with DE1 for image of Cameraman (M3=0.1587). Other images are achieved for the higher value of mean objective function on DE1 for images of Lena (M1=0.1577) and Rice (0M4=0.2536). In case of computation times show that, the best computation time for Lena image is CDERA1 (T1=104.42s), Boat image is CDE3 (T2=91.04s), Cameraman image is CDE1 (T3=86.41s), and Rice image is CDERA1 (T4=88.26s).
Furthermore, the best objectives function of proposed methods, only for image of Rice (CDE-RA2, CDERA3 = 0.2538), together with DE1, DERA1, DERA3, CDE2 and CDE3. Other images are achieved for the higher value of the best objective function on DE1 for image of Lena (0.1592), CDE2 for image Boat (0.1436), and DERA2 for image of Cameraman (0.1655). In a
TABLE3
SIMULATION RESULTS OF PSO,PSORA,CPSO AND CPSORA
Methods Lena Boat Cameraman Rice
M1 T1 M2 T2 M3 T3 M4 T4
PSO1 0.1525 131.11 0.1361 111.94 0.1523 118.28 0.2509 116.52
PSO2 0.1515 132.71 0.1357 112.51 0.1505 115.84 0.2521 86.85
PSO3 0.1506 131.15 0.1333 113.85 0.1438 94.20 0.2508 86.86
PSO4 0.1508 133.16 0.1339 113.57 0.1527 98.16 0.2510 86.90
PSORA1 0.1533 107.80 0.1379 92.72 0.1557 95.61 0.2522 88.05
PSORA2 0.1550 104.60 0.1382 87.28 0.1559 91.54 0.2518 90.65
PSORA3 0.1539 100.81 0.1353 85.20 0.1544 90.20 0.2513 91.17
CPSO1 0.1512 105.62 0.1368 88.73 0.1572 92.60 0.2521 85.00
CPSO2 0.1549 103.26 0.1372 85.65 0.1573 92.05 0.2526 88.49
CPSO3 0.1513 101.99 0.1360 84.68 0.1525 89.31 0.2517 88.61
CPSORA1 0.1548 139.54 0.1387 120.00 0.1580 125.49 0.2524 124.54
CPSORA2 0.1557 101.07 0.1378 111.93 0.1586 89.26 0.2529 91.22
TABLE4
SIMULATION RESULTS OF HS,HSRA,CHS AND CHSRA
Methods Lena Boat Cameraman Rice
M1 T1 M2 T2 M3 T3 M4 T4
HS1 0.1409 7.84 0.1298 6.32 0.1397 8.89 0.2354 6.68
HS2 0.1428 7.71 0.1297 6.37 0.1391 8.95 0.2359 8.68
HS3 0.1383 7.69 0.1290 6.49 0.1398 9.01 0.2418 14.47
HS4 0.1403 7.77 0.1245 6.59 0.1378 8.94 0.2355 10.28
HS5 0.1441 7.60 0.1279 6.53 0.1402 8.97 0.2385 6.70
HSRA1 0.1441 10.00 0.1287 8.65 0.1405 8.92 0.2407 8.88
HSRA2 0.1438 9.95 0.1272 6.44 0.1408 8.79 0.2403 6.66
HSRA3 0.1448 9.90 0.1303 8.29 0.1388 8.79 0.2421 6.63
CHS1 0.1440 9.81 0.1290 6.38 0.1403 8.93 0.2419 6.76
CHS2 0.1457 9.92 0.1294 8.41 0.1384 6.65 0.2423 8.63
CHS3 0.1441 7.56 0.1304 7.42 0.1384 6.67 0.2423 6.52
case of worst objective function, the original DE gives the less value for all images: DE3 for images of Boat (0.1191), Cameraman (0.1364) and Rice (0.2293) as well as DE5 for image of Lena (0.1281).
Simulation of PSO, PSORA, CPSO and CPSORA
Simulation on particle swarm optimization algo-rithm is performed in 13 conditions. First group is 4 simulations on the original particle swarm opti-mization: PSO1 (r1 = r2 = 1.3), PSO2 (r1 = r2 = 1.0), PSO3 (r1 = r2 = 0.5), PSO4 (r1 = r2 = 0.2). Second is 3 simulations on PSO by random adjustment: PSORA1 (r1 = r2 = RA), PSORA2 (r1 =0.8, r2 = RA), PSORA3 (r1 =RA, r2 = 0.8). Third is 3 simulations on chaotic PSO: CPSO1 (r1 = r2 = Ch), CPSO2 (r1 = 1.3, r2 = Ch), CPSO3 (r1 = Ch, r2 = 1.3), and fourth is 3 simulations on the proposed methods: CPSORA1 (r1 = r2 = ChRA), CPSORA2 (r1 =Ch, r2 = RA), CPSORA3 (r1 = RA, r2 = Ch).
Simulation results for all PSO algorithms are given in Table 3. These results show that, mean objective function of the proposed methods achi-eve the higher value for all images: CPSORA2 for images of Lena (M1 = 0.1557), CPSORA1 for ima-ge of Boat (M2 = 0.1387), Cameraman (M3 = 0.1586) and Rice (M4 = 0.2529). In case of the comparison of computation times shows that the best computation time for Lena image is PSORA3 (T1 = 100.81s), Boat image is CPSORA3 (T2 = 86.71s), Cameraman image is CPSO3 (T3 =
84.68s), and Rice image is CPSO1 (T4 = 85.00s). Moreover, the best objective functions of proposed methods give a higher value for 3 images: CPSORA1 for image of Cameraman (0.1697); CPSORA1, CPSORA2, CPSORA3 for images Boat (0.1436) and Rice (0.253). In a case of the worst objective function, the original PSO gives the less value for images of Boat (0.1243) and Cameraman (0.1269); CPSO1 for the image of Lena (0.1368); CPSO3 for image of Rice (0.2418).
Simulation of HS, HSRA, CHS and CHSRA
Simulation of harmony search algorithm is cond-ucted in 14 conditions. First, group is five simula-tions on the original harmony search: HS1 (H = P = 0.8), HS2 (H = P = 0.5), HS3 (H = P = 0.2), HS4 (H = 0.8, P = 0.2), HS5 (H = 0.2, P = 0.8). Second is 3 simulations on HS by random adjustment, HSRA1 (H = P = RA), HSRA2 (H = RA, P = 0.5), HSRA3 (H = 0.5, P = RA). Third is 3 simulations on chaotic HS: CHS1 (H = P = Ch), CHS2 (H = Ch, P = 0.5), CHS3 (H = 0.5, P = RA), and fourth is 3 simulations on the proposed methods: CHSRA1 (H = P = ChRA), CHSRA2 (H = Ch, P = RA), CHSRA3 (H = RA, P = Ch).
Simulation results for all HS algorithms are given in Table 4. These results show that, mean objective function of the proposed methods achieve the higher value for all images: CHSRA1 for images of Lena (M1=0.1460), Cameraman (M3=0.1416) and Rice (M4=0.2424) as well as CHSRA2 for image of Boat (M2=0.1307). In case
of computation times for HS algorithms show that Lena image is CHS3 (T1=7.56 s), Boat image is CHSRA2 (T2=6.63 s) Cameraman image is HS1 (T3=6.32 s), and Rice image is CHS3 (T4=6.52 s).
Moreover, the best objective function of proposed methods gives higher value only for 2 images, which is CHSRA1 for images of (0.1418) and Cameraman (0.1600). The others are HS2 and HSRA2 for images of Lena (0.1565) as well as HSRA1 for the image of Rice (0.2526). In case of the worst objective function, the original HS gives the less value for 3 images: HS1 for image of Rice (0.2068), HS4 for images of Boat (0.1018) and Cameraman (0.1217). Another is CHS1 for the image of Lena (0.1026).
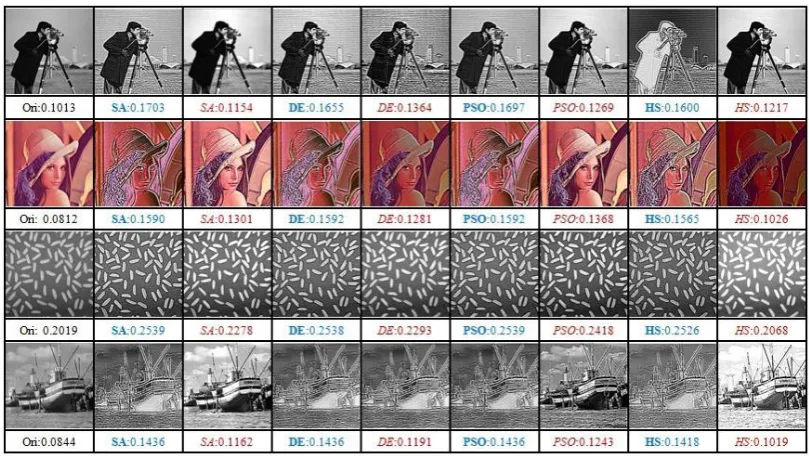
Comparison of images for the original (Ori), the best objective function and the worst objective function on all algorithms are shown in figure 1. Moreover, some examples for combination of parameters p, q, r and s are presented in relation to objective function F as well as intensity of edge E(I(M)) that is detected by Sobel edge detector, number of edge pixels ne(I(M)) and entropy of the images H(I(M)). Simulation results parameters for the best objective function (BOF) are given in Table 5 and for the worst objective function are shown in Table 6.
4. Conclusion
The objective of these proposed methods has been achieved to enhance the detail and the contrast of images. The indicator from the proposed methods
is the objective function are better than the original of images. As an example, the mean objective function of Lena image on CSARA1 is 0.1551, while on the original is 0.0812.
Based on the mean objective functions from simulation results, the performance of the proposed methods for all images is better than the original of metaheuristic, metaheuristic with chaos, and metaheuristic by Random adjustment, except Lena and Rice images in DE algorithms. In this case, mean objective function of DE1 for images of Lena (0.1577) and Rice (0.2536) are better than the proposed methods, i.e. CDERA1 (Lena: 0.1558, Rice: 0.2529), CDERA2 (Lena: 0.1557, Rice: 0.2533) and CDERA3 (Lena: 0.1573, Rice: 0.2531).
The probabilities of this case, since setting parameters of DE1 are fit with the characteristic of Lena and Rice images. The performance of metaheuristic algorithms depends on their para-meter settings. As an example, the best objective function of Lena image (0.1592) is DE1 (F = CR = 0.8). However, the worst objective func-tion of this image (0.1281) is variant of DE1, which is DE5 (F=0.2, CR=0.8). In case of compu-tation time, the best computation time of Lena image is SA1 (43.17 s). However, the worst computation time is the variant of this method, that is SA3 (286.30 s).
Moreover, the performance of metaheuristic algorithms also depends on characteristic of the problem, in this case is images of Lena, Camera-man, Boat and Rice. For example, the best object-ive function of Lena (0.1590) and Boat (0.1436)
TABLE5
PARAMETER OF BEST OBJECTIVE FUNCTION
Parameter Cameraman Lena Rice Boat
p 0.6619 0.0644 0.9837 0.0240
q 0.0297 0.8691 2.0000 1.5732
r 1.0065 1.0623 0.9989 1.1124
s 1.2237 29.9987 22.1640 30.0000
E(I(M)) 197.8765 366.4818 551.4762 213.6350
ne(I(M)) 4057 3732 4989 3685
H(I(M)) 7.6171 6.8348 7.6135 6.9511
F(M) 0.1703 0.1592 0.2539 0.1436
TABLE6
PARAMETER OF WORST OBJECTIVE FUNCTION
Parameter Cameraman Lena Rice Boat
p 1.4707 0.9561 1.1610 0.7113
q 0.3764 1.1091 1.9994 1.9278
r 0.5000 1.2690 0.6547 0.9401
s 0.8521 5.7182 7.2831 29.6184
E(I(M)) 193.5467 85.9574 339.8672 228.6044
ne(I(M)) 2813 3546 4944 3352
H(I(M)) 7.4834 6.6190 6.7967 5.3437
images are CSARA1. However, the best objective function image of Rice (0.2539) is CSARA2 as well as image of Cameraman (0.1703) is CSARA3.
Acknowledgements
This work is supported by Indonesian Directorate General of Higher Education (DIKTI) scholarship BPPDN 2013 for LMRR’s study.
References
[1] C. L. J. G. Sauer, M. Rudek, Differential evolution optimization combined with chaotic sequences for image contrast enhancement, Chaos, Solitons and Fractals 42 (2009) 522– 529.
[2] C. Munteanu, A. Rosa, Towards automatic image enhancement using genetic algorithms, IEEE Congress on Evolutionary Computation (2000) 1535–1542.
[3] C. Munteanu, A. Rosa, Gray-scale enhancement as an automatic process driven by evolution, IEEE Transaction on systems, man, and cybernetics Part B: Cybernetics 34 (2) 1292–1298.
[4] A. Gorai, A. Ghosh, Gray-level image enhancement by particle swarm optimization, Congress on Nature Biologically Inspired Computing (2009) 72 77.
[5] I. Boussaid, J. Lepagnot, P. Siarry, A survey on optimization metaheuristics, Information Science 237 (2013) 82 117.
[6] El-Ghazali Talbi, Metaheuristics From Design to Implementation, John Wiley Sons, Hoboken, New Jersey, 2009.
[7] J. Liu, J. Lampinen, A fuzzy adaptive differential evolution algorithm, Soft Computing - A fusion of Foundations, Methodologies and Applications 9 (6) (2013) 448–462.
[8] J. Di, N. Wang, Harmony Search algorithm with Chaos for training RBFNN, Academy Publisher, 2013, pp. 2231–2237.
[9] K. Ferens, C. D., K. W., Chaotic simulated annealing for task allocation in multiprocessing system, IEEE International Conference on Cognitive Informatics Cognitive Computing (ICCI-CC), 12 (2012) 26–35.
[10]N. Noman, D. Bollgala, H. Iba, An adaptive differential evolution algorithm, IEEE Evolutionary Computation (2011) 2229– 2236.
[11]X. Li, J. Xu, Y. Yang, A chaotic particle swarm optimization - based heuristic for market-oriented task-level scheduling in cloud workflow systems, Computationnal Intellignece and Neuroscience 2015 (2015) 11 pages.
[12]H. Cheng, H. Xu, A novel fuzzy logic approach to contrast enhancement, Pattern Recognition 33 (2000) 809–819.
[13]M. El-Santawy, A. Ahmed, R. El-Dean, Chaotic differential evolution optimization, Computing and Information System Journal 16 (2) (2012) 1–4.
[14]S. Kirkpatrick, C. Gelatt, M. Vecchi, Optimization by simulated annealing, Science, New Series 220 (4598) (1983) 671– 680.
[15]B. Suman, P. Kumar, A survey of simulated annealing as a tool for single and multiobjective optimization, Journal of the Operation research Society 577 (2006) 1143– 1160.
[16]R. Eberhart, J. Kennedy, A new optimizer using particle swarm theory, Sixth International Symposium on Micro Machine and Human Science (1995) 39–43.