Refer to Important disclosures on the last of this report
Stock DataTarget price (Rp) Rp1,600
Prior TP (Rp) Rp2,700
Shareprice (Rp) Rp1,380
Upside/downside (%) +15.9
Sharesoutstanding (m) 3,561
Marketcap. (US$ m) 329
Government of Indonesia 51.0%
Public 49.0%
Estimate Change; Vs. Consensus 2018 2019
PT Indo Premier Sekuritas [email protected] +62 21 5793 1168
Strong 2H18 result, slightly above
Strong 1H18 result of Rp213bn (+62% yoy), above historical average
Major new contract of Rp9tn from toll road concession
Expect higher DER from investment in several unsolicited toll roads
Maintain Buy with lower TP of Rp1,600 (target P/E of 7.8x)
Strong result with margin expansion all across the board. ADHI reported
relatively strong earnings of Rp213bn in 1H18 (+62% yoy), which came above
expectation forming 29% of our FY18F earnings forecast (Consensus: 26%). The
strong earnings was above ADHI’s 5-year 1H’s achievement average of 25%,
which mainly supported by margin expansion all across the board due to better
margin from LRT Jabodebek and TOD projects. ADHI booked gross margin of
15.8% in 1H18, which was company best performance ever. In quarterly basis,
ADHI booked a strong earnings of Rp139bn in 2Q18 (+90% qoq, +24% yoy),
supported by high net margin of 4.7% in 2Q18 (2Q17:3.8%; 1Q18 2.3%).
Concession holder for Solo-Yogyakarta-Kulonprogo toll road
.
ADHI formed
a consortium with Gama Group and PT Daya Mulia Turangga as the initiator for
the development of Solo-Yogyakarta-Kulonprogo toll road with total investment of
Rp22.5tn. ADHI will take 40% ownership on the consortium, which will contribute
at least Rp9tn construction work which accounts to 39% of ADHI’s FY18 new
contract guidance of Rp23tn (Ours: Rp21tn). We believe making a direct
investment in a toll road project will hurt operating cash flow position and
exposing company to higher debt & financing cost. Assuming 30:70
debt-to-equity financing scheme, ADHI will need total fund of Rp6.3tn of debt-to-equity. However
we are still positive towards the investment in the long run as
Solo-Yogyakarta-Kulonprogo toll road is perceived as a high density track, which will provide
attractive IRR as well as provide construction work for ADHI for the next 3 years.
Aggressive investment in unsolicited toll projects leads to higher DER.
ADHI is currently working on taking minority stakes in two unsolicited toll-road
projects, namely Cikunir-Ulujami (JORR III) and Bandung Outer Ring Road with
investment of Rp22.5tn and Rp6.3tn, respectively. Despite high investments
amount, we believe these project would be a huge contribution for ADHI’s new
contract post LRT Jabodebek completion in 3Q19. We forecast ADHI to increase it
DER ratio to 1.7-7.8x in FY18/19F (FY17: 1.4x) in order to fund this major
investment in these toll road projects.
Maintain Buy on ADHI with lower TP of Rp1,600 (from Rp2,700).
We
continue to like ADHI given its better margin and robust earnings growth of 25%
CAGR FY17-FY20FAs. However we forecast higher DER in FY18F going forward,
which led our DCF-based TP to decreased to Rp1,600, representing target PE of
7.8x. Key risk to our call might come from higher than expected debt issuance.
Adhi Karya
(
ADHI IJ
)
Source: ADHI, IndoPremier Share Price Closing as of : 26-Sept-2018
ADHI IJ Results Note
2
Refer to Important disclosures in the last page of this report
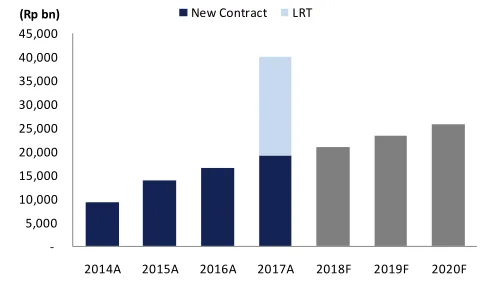
Fig. 1: 8M18 contract achievement Fig. 2: New contract trend FY12-FY20F
Source: Company, IndoPremier Source: Company, IndoPremier
Fig. 3: Revenue by segment Fig. 4: LRT Jabodebek reached 43.87% progress
Source: Company, IndoPremier Source: Company, IndoPremier
Fig. 5: Expect higher DER FY18F onwards Fig. 6: Margin trend FY14-FY20F
Source: Company, IndoPremier Source: Company, IndoPremier
48% 48%
(Rp bn) New contract % of FY target (Non LRT)
-2014A 2015A 2016A 2017A 2018F 2019F 2020F
(Rp bn) New Contract LRT
Construction
Cawang-Cibubur Cawang-Dukuh Atas Cawang-East Bekasi
LRT Progress as of 9M18
1.3
2014A 2015A 2016A 2017F 2018F 2019F 2020F
3
Refer to Important disclosures in the last page of this report
Year To 31 Dec (RpBn) 2016A 2017A 2018F 2019F 2020F
Income Statement
Net Revenue 11,064 15,156 18,434 20,344 23,313
Cost of Sales (9,949) (13,098) (16,034) (17,677) (20,347)
Gross Profit 1,115 2,058 2,400 2,667 2,966
SG&A Expenses (456) (581) (772) (799) (927)
Operating Profit 659 1,477 1,628 1,868 2,039
Net Interest (95) (341) (453) (448) (492)
Forex Gain (Loss) 64 7 0 0 0
Others-Net (15) (185) 93 91 156
Pre-Tax Income 613 957 1,268 1,510 1,703
Income Tax (298) (440) (538) (602) (692)
Minorities (2) (2) (2) (3) (3)
Net Income 313 515 727 905 1,008
Balance Sheet
Cash & Equivalent 3,365 4,131 4,815 4,272 4,316
Receivable 3,970 3,739 4,170 4,610 5,228
Inventory 131 3,683 3,677 3,887 4,247
Other Current Assets 9,368 13,264 15,040 16,984 19,101
Total Current Assets 16,835 24,818 27,702 29,752 32,893
Fixed Assets - Net 1,814 1,876 3,677 4,850 5,434
Goodwill 0 0 0 0 0
Non Current Assets 1,446 1,639 1,696 1,847 2,025
Total Assets 20,095 28,333 33,076 36,450 40,352
ST Loans 2,344 3,537 5,069 5,595 6,411
Payable 8,373 11,611 0 13,976 16,136
Other Payables 1,828 2,235 2,531 2,758 3,239
Current Portion of LT Loans 500 250 250 500 0
Total Current Liab. 13,044 17,633 19,792 22,829 25,786
Long Term Loans 1,428 4,665 6,625 6,242 6,423
Other LT Liab. 180 164 215 247 273
Total Liabilities 14,653 22,463 26,632 29,318 32,482
Equity 3,415 3,413 3,413 3,413 3,413
Retained Earnings 1,997 2,446 3,004 3,691 4,428
Minority Interest 10 11 12 13 14
Total SHE + Minority Int. 5,422 5,869 6,428 7,116 7,854
Total Liabilities & Equity 20,075 28,332 33,060 36,434 40,337
ADHI IJ Results Note
4
Refer to Important disclosures in the last page of this report
Year to 31 Dec 2016A 2017A 2018F 2019F 2020F
Cash Flow
Net Income (Excl.Extraordinary&Min.Int) 315 517 730 908 1,011
Depr. & Amortization 66 131 208 332 421
Changes in Working Capital 2,074 191 (223) 1,378 1,259
Others (301) (3,124) (3,381) (872) (1,140)
Cash Flow From Operating 2,154 (2,285) (2,667) 1,745 1,550
Capital Expenditure (1,257) (386) (2,066) (1,656) (1,183)
Others 163 104 145 169 150
Cash Flow From Investing (1,094) (283) (1,922) (1,488) (1,034)
Loans 1,153 4,181 3,492 392 497
Equity 1 0 0 0 0
Dividends (94) (94) (155) (218) (272)
Others (195) (447) (559) (594) (626)
Cash Flow From Financing 866 3,640 2,778 (421) (400)
Changes in Cash 1,926 1,072 (1,810) (163) 117
Financial Ratios
Gross Margin (%) 10.1 13.6 13.0 13.1 12.7
Operating Margin (%) 6.0 9.7 8.8 9.2 8.7
Pre-Tax Margin (%) 5.5 6.3 6.9 7.4 7.3
Net Margin (%) 2.8 3.4 3.9 4.4 4.3
ROA (%) 1.7 2.1 2.4 2.6 2.6
ROE (%) 5.9 9.1 11.8 13.4 13.5
ROIC (%) 5.2 5.2 5.3 5.7 5.8
Acct. Receivables TO (days) 84.8 70.2 60.9 60.9 59.3
Acct. Receivables - Other TO (days) 35.4 22.6 17.4 17.8 17.7
Inventory TO (days) 67.8 6.9 4.4 4.7 5.0
Payable TO (days) 272.6 278.4 268.1 267.6 270.1
Acct. Payables - Other TO (days) 0.0 0.0 0.0 0.0 0.0
Debt to Equity (%) 78.8 144.0 185.8 173.4 163.4
Interest Coverage Ratio (x) 0.4 0.3 0.4 0.3 0.3
Net Gearing (%) 16.7 73.6 110.9 113.3 108.4
Head Office
PT INDO PREMIER SEKURITAS
Wisma GKBI 7/F Suite 718
Jl. Jend. Sudirman No.28
Jakarta 10210 - Indonesia
p +62.21.5793.1168
f +62.21.5793.1167
INVESTMENT RATINGS
BUY : Expected total return of 10% or more within a 12-month period
HOLD : Expected total return between -10% and 10% within a 12-month period
SELL : Expected total return of -10% or worse within a 12-month period
ANALYSTS CERTIFICATION.
The views expressed in this research report accurately reflect the analysts personal views about any and all of the subject securities or issuers; and no part of the research analyst's compensation was, is, or will be, directly or indirectly, related to the specific recommendations or views expressed in the report.
DISCLAIMERS