LAMPIRAN
Lampiran 1 Daftar Populasi Perusahaan Makanan dan Minuman yang Terdaftar di BEI
No Kode
Emiten Nama Perusahaan
Kriteria
Daftar Sampel Penelitian Perusahaan Makanan dan Minuman yang Terdaftar di BEI
No Kode
Emiten Nama Perusahaan
1 ADES PT Akasha Wira International Tbk 2 AISA PT Tiga Pilar Sejahtera Food Tbk 3 CEKA PT Cahaya Kalbar Tbk
4 DLTA PT Della Djakarta TBK
5 ICBP PT Indofood CBP Sukses Makmur Tbk 6 INDF PT Indofood Sukses Makmur Tbk 7 MLBI PT Multi Bintang Indonesia 8 MYOR PT Mayora Indah Tbk
9 ROTI PT Nippon Indosari Corporindo Tbk 10 SKLT PT Sekar Laut Tbk
11 STTP PT Siantar Top Tbk
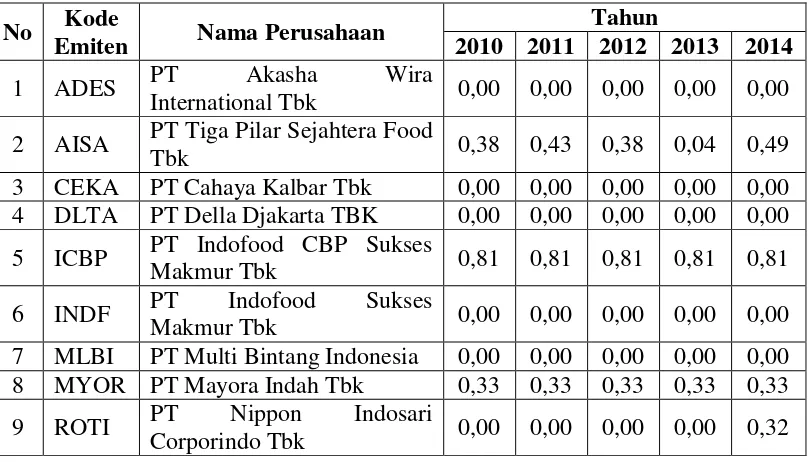
Lampiran 2 Tabel Hasil Perhitungan Kepemilikan Manajerial
No Kode
Emiten Nama Perusahaan
Tahun Tabel Hasil Perhitungan Kepemilikan Institusional
No Kode
Emiten Nama Perusahaan
10 SKLT PT Sekar Laut Tbk 0,26 0,26 0,26 0,26 0,26 11 STTP PT Siantar Top Tbk 0,57 0,57 0,57 0,57 0,57 12 ULTJ PT Ultrajaya Milk Industry
and Trading Company Tbk 0,37 0,37 0,37 0,37 0,37
Lampiran 4 Tabel Hasil Perhitungan Ukuran Perusahaan (Ln Total Aset)
No Kode
Emiten Nama Perusahaan
Tahun Industry and Trading Company Tbk
28,33 28,41 28,52 28,66 28,70
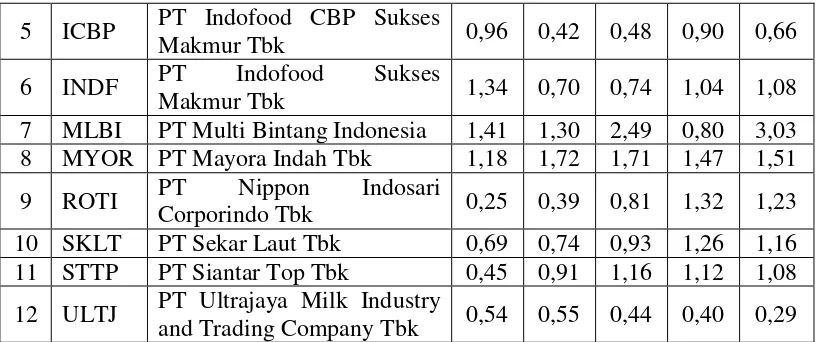
Lampiran 5 Tabel Hasil Perhitungan Leverage
No Kode
Emiten Nama Perusahaan
5 ICBP PT Indofood CBP Sukses Tabel Hasil Perhitungan Kinerja Perusahaan
No Kode
Emiten Nama Perusahaan
Tahun Industry and Trading Company Tbk
Lampiran 7 Output SPSS
Descriptives
Descriptive Statistics
N Minimum Maximum Mean Std. Deviation
ROA 60 .12 65.72 12.5137 12.03596 Kepemilikan Manajerial 60 .00 .18 .0175 .04877 Kepemilikan Institusional 60 .00 .81 .2350 .26473 Ukuran Perusahaan 60 20.36 32.08 27.8407 2.70954 Leverage 60 .04 3.03 1.0027 .59371 Valid N (listwise) 60
Uji Normalitas
One-Sample Kolmogorov-Smirnov Test
Unstandardized
Residual
N 60
Normal Parametersa,,b Mean .0000000
Std. Deviation 10.94832325
Most Extreme Differences Absolute .196
Positive .196
Negative -.111
Kolmogorov-Smirnov Z 1.518
Asymp. Sig. (2-tailed) .020
a. Test distribution is Normal.
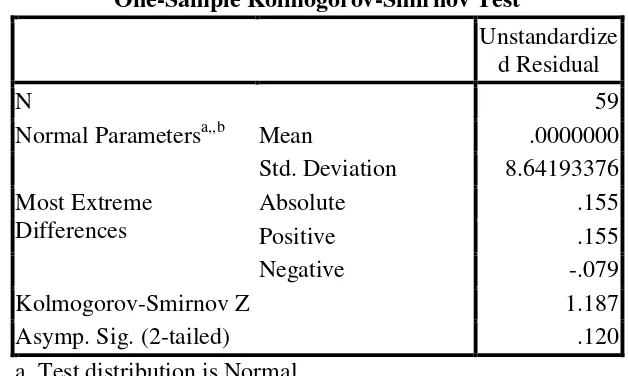
Uji Normalitas Setelah Data Menyimpang / Outlier Dihapus One-Sample Kolmogorov-Smirnov Test
Unstandardize d Residual
N 59
Normal Parametersa,,b Mean .0000000 Std. Deviation 8.64193376 Most Extreme
Differences
Absolute .155
Positive .155
Negative -.079
Kolmogorov-Smirnov Z 1.187
Asymp. Sig. (2-tailed) .120
a. Test distribution is Normal. b. Calculated from data.
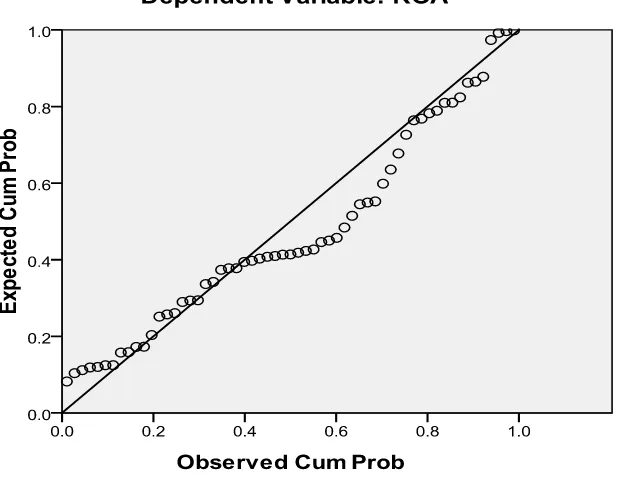
Grafik Normal Probability Plot
Uji Multikolinearitas
Coefficientsa
Model
Unstandardized Coefficients
Standardized Coefficients
t Sig.
Collinearity Statistics
B Std. Error Beta Tolerance VIF
1 (Constant) 49.273 12.929 3.811 .000
Kepemilikan Manajerial -12.067 25.757 -.060 -.469 .641 .864 1.158
Kepemilikan Institusional -6.086 5.010 -.163 -1.215 .230 .784 1.276
Ukuran Perusahaan -1.397 .506 -.386 -2.762 .008 .724 1.381
Leverage 2.880 2.251 .174 1.279 .206 .763 1.311
Uji Autokorelasi
Model Summaryb
Model R R Square
Adjusted R Square
Std. Error of the
Estimate Durbin-Watson
1 .486a .236 .179 8.95629 1.872 a. Predictors: (Constant), Leverage, Kepemilikan Institusional, Kepemilikan Manajerial, Ukuran Perusahaan
b. Dependent Variable: ROA
Uji Signifikasi F
ANOVAb
Model Sum of Squares df Mean Square F Sig.
1 Regression 1336.486 4 334.122 4.165 .005a
Residual 4331.615 54 80.215
Total 5668.101 58
a. Predictors: (Constant), Leverage, Kepemilikan Institusional, Kepemilikan Manajerial, Ukuran Perusahaan
b. Dependent Variable: ROA
Uji Signifikasi t
Coefficientsa
Model
Unstandardized Coefficients
Standardized Coefficients
t Sig.
Collinearity Statistics
B Std. Error Beta Tolerance VIF
1 (Constant) 49.273 12.929 3.811 .000
Kepemilikan Manajerial -12.067 25.757 -.060 -.469 .641 .864 1.158
Kepemilikan Institusional -6.086 5.010 -.163 -1.215 .230 .784 1.276
Ukuran Perusahaan -1.397 .506 -.386 -2.762 .008 .724 1.381
Leverage 2.880 2.251 .174 1.279 .206 .763 1.311