Lampiran I
Sampel Perusahaan
NO
KODE
PERUSAHAAN
1
DVLA
PT Darya-Varia Laboratoria Tbk
2
KLBF
PT Kalbe Farma Tbk
3
MERCK
PT MERCK Tbk
4
PYFA
PT Pyramida Farma Tbk
5
SQBB
PT Taisho Pharmaceutical Indonesia Tbk
6
TSPC
PT Tempo Scan Pacific Tbk
7
MBTP
PT Martina Berto Tbk & Subsidiaries
8
TCID
PT Mandom Indonesia Tbk
9
ADES
PT Akasha Wira International Tbk
10
CEKA
PT Cahaya Kalbar Tbk
11
DLTA
PT Delta Djakarta Tbk dan Entitas Anak
12
ICPB
PT Indofood CBP Sukses Makmur Tbk
13
MLBI
PT Multi Bintang Indonesia Tbk
14
MYOR
PT Mayora Indah Tbk
15
ROTI
PT Nippon Indosari Corpindo Tbk
16
SKLT
PT Sekar Laut Tbk
17
STTP
PT Siantar Top Tbk
18
ULTJ
PT Ultrajaya Milk Industry & Tranding Company Tbk
19
KICI
PT Kedaung Indah Can Tbk
20
GGRM
PT Gudang Garam Tbk
Lampiran 2
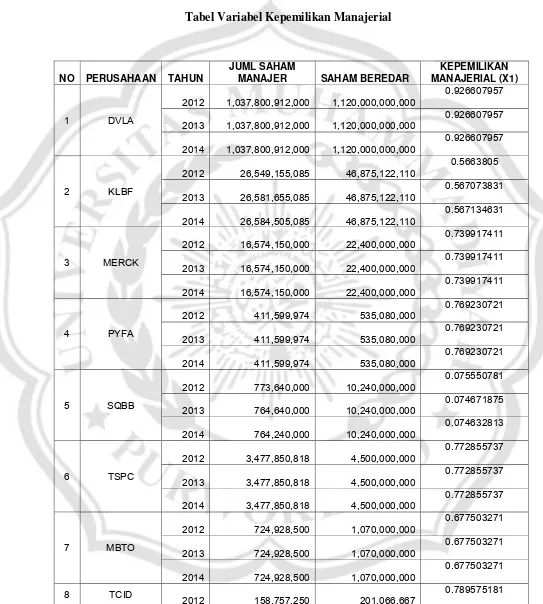
Tabel Variabel Kepemilikan Manajerial
NO PERUSAHAAN TAHUN
JUML SAHAM
MANAJER SAHAM BEREDAR
KEPEMILIKAN MANAJERIAL (X1)
1 DVLA
2012 1,037,800,912,000 1,120,000,000,000
0.926607957
2013 1,037,800,912,000 1,120,000,000,000
0.926607957
2014 1,037,800,912,000 1,120,000,000,000
0.926607957
2 KLBF
2012 26,549,155,085 46,875,122,110
0.5663805
2013 26,581,655,085 46,875,122,110
0.567073831
2014 26,584,505,085 46,875,122,110
0.567134631
3 MERCK
2012 16,574,150,000 22,400,000,000
0.739917411
2013 16,574,150,000 22,400,000,000
0.739917411
2014 16,574,150,000 22,400,000,000
0.739917411
4 PYFA
2012 411,599,974 535,080,000
0.769230721
2013 411,599,974 535,080,000
0.769230721
2014 411,599,974 535,080,000
0.769230721
5 SQBB
2012 773,640,000 10,240,000,000
0.075550781
2013 764,640,000 10,240,000,000
0.074671875
2014 764,240,000 10,240,000,000
0.074632813
6 TSPC
2012 3,477,850,818 4,500,000,000
0.772855737
2013 3,477,850,818 4,500,000,000
0.772855737
2014 3,477,850,818 4,500,000,000
0.772855737
7 MBTO
2012 724,928,500 1,070,000,000
0.677503271
2013 724,928,500 1,070,000,000
0.677503271
2014 724,928,500 1,070,000,000
0.677503271
8 TCID
2012 158,757,250 201,066,667
2013 48,806,917 201,066,667
0.242739971
2014 48,795,029 201,066,667
0.242680847
9 ADES
2012 542,347,113,000,000 589,896,800,000,000
0.919393211
2013 542,347,113,000,000 589,896,800,000,000
0.919393211
2014 542,347,113,000,000 589,896,800,000,000
0.919393211
10 CEKA
2012 273,735,500 297,500,000
0.920119328
2013 275,985,500 297,500,000
0.927682353
2014 275,985,500 297,500,000
0.927682353
11 DLTA
2012 9,341,223,000 16,013,181,000
0.58334587
2013 9,341,223,000 16,013,181,000
0.58334587
2014 9,341,223,000 16,013,181,000
0.58334587
12 ICBP
2012 4,695,839,000 5,830,954,000
0.805329454
2013 4,698,339,000 5,830,954,000
0.8057582
2014 4,698,339,000 5,830,954,000
0.8057582
13 MLBI
2012 16,064,390,000,000 21,070,000,000,000
0.762429521
2013 16,064,390,000,000 21,070,000,000,000
0.762429521
2014 16,064,390,000,000 21,070,000,000,000
0.762429521
14 MYOR
2012 253,472,012 766,584,000
0.330651321
2013 295,717,347 894,347,989
0.330651324
2014 295,717,347 894,347,989
0.330651324
15 ROTI
2012 764,862,700 1,012,360,000
0.755524418
2013 3,581,223,500 5,061,800,000
0.7075
2014 3,581,223,500 5,061,800,000
2013 743,600,500 1,310,000,000
0.567633969
2014 743,600,500 1,310,000,000
0.567633969
18 ULTJ
2012 1,865,392,526 2,888,382,000
0.645826115
2013 1,859,752,526 2,888,382,000
0.643873465
2014 1,862,473,526 2,888,382,000
0.644815515
19 KICI
2012 114,229,420 138,000,000
0.82774942
2013 114,936,620 138,000,000
0.832874058
2014 114,936,620 138,000,000
0.832874058
20 GGRM
2012 1,471,291,700,000 1,924,088,000,000
0.764669651
2013 1,471,291,700,000 1,924,088,000,000
0.764669651
2014 1,471,291,700,000 1,924,088,000,000
0.764669651
21 HMPS
2012 4,303,168,205 4,383,000,000
0.981786038
2013 4,303,168,205 4,383,000,000
0.981786038
2014 4,303,168,205 4,383,000,000
Lampiran 3
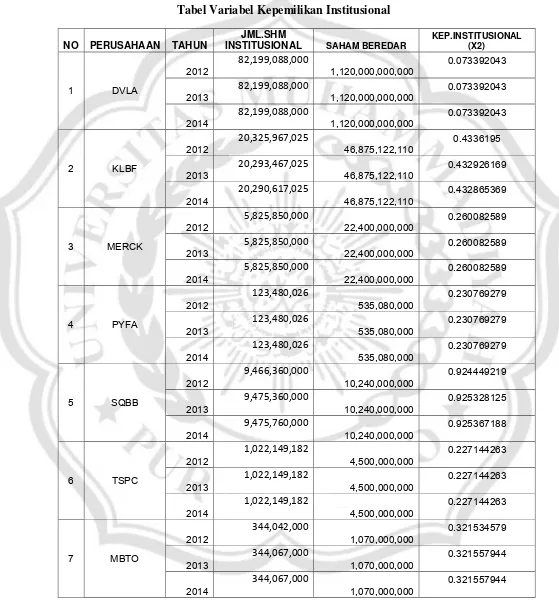
Tabel Variabel Kepemilikan Institusional
NO PERUSAHAAN TAHUN
JML.SHM
INSTITUSIONAL SAHAM BEREDAR
KEP.INSTITUSIONAL (X2)
1 DVLA
2012 82,199,088,000 1,120,000,000,000 0.073392043 2013 82,199,088,000 1,120,000,000,000 0.073392043 2014 82,199,088,000 1,120,000,000,000 0.073392043
2 KLBF
2012 20,325,967,025 46,875,122,110 0.4336195 2013 20,293,467,025 46,875,122,110 0.432926169 2014 20,290,617,025 46,875,122,110 0.432865369
3 MERCK
2012 5,825,850,000 22,400,000,000 0.260082589 2013 5,825,850,000 22,400,000,000 0.260082589 2014 5,825,850,000 22,400,000,000 0.260082589
4 PYFA
2012 123,480,026 535,080,000 0.230769279 2013 123,480,026 535,080,000 0.230769279 2014 123,480,026 535,080,000 0.230769279
5 SQBB
2012 9,466,360,000 10,240,000,000 0.924449219 2013 9,475,360,000 10,240,000,000 0.925328125 2014 9,475,760,000 10,240,000,000 0.925367188
6 TSPC
8 TCID 2012 42,309,417 201,066,667 0.210424819 2013 42,259,750 201,066,667 0.210177801 2014 42,271,638 201,066,667 0.210236926
9 ADES
2012 47,549,687,000,000 589,896,800,000,000 0.080606789 2013 47,549,687,000,000 589,896,800,000,000 0.080606789 2014 47,549,687,000,000 589,896,800,000,000 0.080606789
10 CEKA
2012 23,764,500 297,500,000 0.079880672 2013 21,514,500 297,500,000 0.072317647 2014 21,514,500 297,500,000 0.072317647
11 DLTA
2012 6,671,958,000 16,013,181,000 0.41665413 2013 6,671,958,000 16,013,181,000 0.41665413 2014 6,671,958,000 16,013,181,000 0.41665413
12 ICBP
2012 1,135,115,000 5,830,954,000 0.194670546 2013 1,132,615,000 5,830,954,000 0.1942418 2014 1,132,615,000 5,830,954,000 0.1942418
13 MLBI
2012 5,005,610,000,000 21,070,000,000,000 0.237570479 2013 5,005,610,000,000 21,070,000,000,000 0.237570479 2014 5,005,610,000,000 21,070,000,000,000 0.237570479
14 MYOR
2012 513,111,988 766,584,000 0.669348679 2013 598,630,642 894,347,989 0.669348676 2014 598,630,642 894,347,989 0.669348676
15 ROTI
16 SKLT 2012 26,136,000 690,740,500 0.037837654 2013 26,136,000 690,740,500 0.037837654 2014 26,136,000 690,740,500 0.037837654
17 STTP
2012 566,399,500 1,310,000,000 0.432366031 2013 566,399,500 1,310,000,000 0.432366031 2014 566,399,500 1,310,000,000 0.432366031
18 ULTJ
2012 1,022,989,474 2,888,382,000 0.354173885 2013 1,028,629,474 2,888,382,000 0.356126535 2014 1,025,908,474 2,888,382,000 0.355184485
19 KICI
2012 23,770,580 138,000,000 0.17225058 2013 23,063,380 138,000,000 0.167125942 2014 23,063,380 138,000,000 0.167125942
20 GGRM
2012 452,796,300,000 1,924,088,000,000 0.235330349 2013 452,796,300,000 1,924,088,000,000 0.235330349 2014 452,796,300,000 1,924,088,000,000 0.235330349
21 HMPS
Lampiran IV
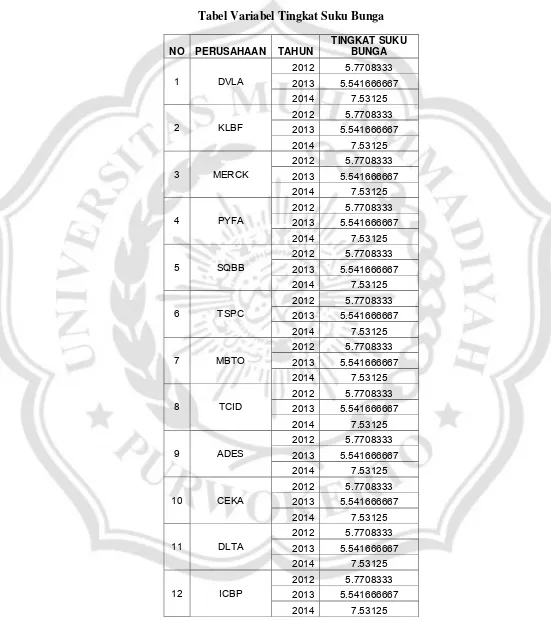
Tabel Variabel Tingkat Suku Bunga
NO PERUSAHAAN TAHUN
TINGKAT SUKU BUNGA
1 DVLA
2012 5.7708333 2013 5.541666667 2014 7.53125
2 KLBF
2012 5.7708333 2013 5.541666667 2014 7.53125
3 MERCK
2012 5.7708333
2013 5.541666667 2014 7.53125
4 PYFA
2012 5.7708333 2013 5.541666667
2014 7.53125
5 SQBB
2012 5.7708333 2013 5.541666667 2014 7.53125
6 TSPC
2012 5.7708333 2013 5.541666667 2014 7.53125
7 MBTO
2012 5.7708333
2013 5.541666667 2014 7.53125
8 TCID
2012 5.7708333 2013 5.541666667
2014 7.53125
9 ADES
2012 5.7708333 2013 5.541666667 2014 7.53125
10 CEKA
2012 5.7708333 2013 5.541666667 2014 7.53125
11 DLTA
2012 5.7708333 2013 5.541666667 2014 7.53125
12 ICBP
2012 5.7708333
13 MLBI
2012 5.7708333
2013 5.541666667 2014 7.53125
14 MYOR
2012 5.7708333 2013 5.541666667
2014 7.53125
15 ROTI
2012 5.7708333 2013 5.541666667 2014 7.53125
16 SKLT
2012 5.7708333 2013 5.541666667 2014 7.53125
17 STTP
2012 5.7708333
2013 5.541666667 2014 7.53125
18 ULTJ
2012 5.7708333 2013 5.541666667
2014 7.53125
19 KICI
2012 5.7708333 2013 5.541666667
2014 7.53125
20 GGRM
2012 5.7708333 2013 5.541666667 2014 7.53125
21 HMPS
Lampiran 4
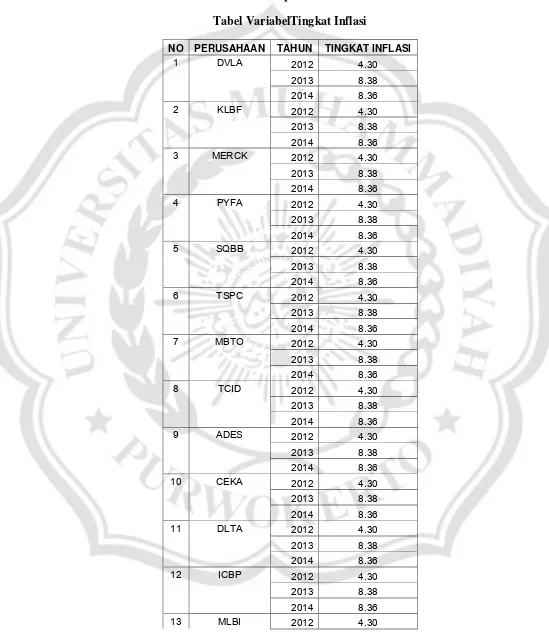
Tabel VariabelTingkat Inflasi
NO PERUSAHAAN TAHUN TINGKAT INFLASI
1 DVLA 2012 4.30
2013 8.38
2014 8.36
2 KLBF 2012 4.30
2013 8.38
2014 8.36
3 MERCK 2012 4.30
2013 8.38
2014 8.36
4 PYFA 2012 4.30
2013 8.38
2014 8.36
5 SQBB 2012 4.30
2013 8.38
2014 8.36
6 TSPC 2012 4.30
2013 8.38
2014 8.36
7 MBTO 2012 4.30
2013 8.38
2014 8.36
8 TCID 2012 4.30
2013 8.38
2014 8.36
9 ADES 2012 4.30
2013 8.38
2014 8.36
10 CEKA 2012 4.30
2013 8.38
2014 8.36
11 DLTA 2012 4.30
2013 8.38
2014 8.36
12 ICBP 2012 4.30
2013 8.38
2014 8.36
2013 8.38
2014 8.36
14 MYOR 2012 4.30
2013 8.38
2014 8.36
15 ROTI 2012 4.30
2013 8.38
2014 8.36
16 SKLT 2012 4.30
2013 8.38
2014 8.36
17 STTP 2012 4.30
2013 8.38
2014 8.36
18 ULTJ 2012 4.30
2013 8.38
2014 8.36
19 KICI 2012 4.30
2013 8.38
2014 8.36
20 GGRM 2012 4.30
2013 8.38
2014 8.36
21 HMPS 2012 4.30
2013 8.38
Lampiran 5
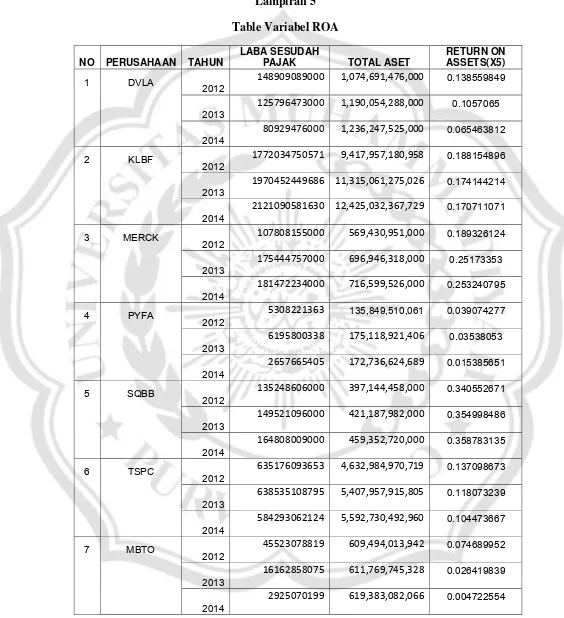
Table Variabel ROA
NO PERUSAHAAN TAHUN
LABA SESUDAH
PAJAK TOTAL ASET
RETURN ON ASSETS(X5)
1 DVLA
2012
148909089000 1,074,691,476,000 0.138559849
2013
125796473000 1,190,054,288,000 0.1057065
2014
80929476000 1,236,247,525,000 0.065463812
2 KLBF
2012
1772034750571 9,417,957,180,958 0.188154896
2013
1970452449686 11,315,061,275,026 0.174144214
2014
2121090581630 12,425,032,367,729 0.170711071
3 MERCK
2012
107808155000 569,430,951,000 0.189326124
2013
175444757000 696,946,318,000 0.25173353
2014
181472234000 716,599,526,000 0.253240795
4 PYFA
2012
5308221363 135,849,510,061 0.039074277
2013
6195800338 175,118,921,406 0.03538053
2014
2657665405 172,736,624,689 0.015385651
5 SQBB
2012
135248606000 397,144,458,000 0.340552671
2013
149521096000 421,187,982,000 0.354998486
2014
164808009000 459,352,720,000 0.358783135
6 TSPC
2012
635176093653 4,632,984,970,719 0.137098673
2013
638535108795 5,407,957,915,805 0.118073239
2014
584293062124 5,592,730,492,960 0.104473667
7 MBTO
2012
45523078819 609,494,013,942 0.074689952
2013
16162858075 611,769,745,328 0.026419839
2014
8 TCID
2012
150803441969 1,261,572,952,461 0.119536046
2013
160563780833 1,465,952,460,752 0.109528641
2014
174908419101 1,853,235,343,636 0.094380036
9 ADES
2012
83376000000 389,094,000,000 0.21428241
2013
55656000000 441,064,000,000 0.126185769
2014
31021000000 504,865,000,000 0.061444148
10 CEKA
2012
58344237476 1,027,692,718,504 0.056772065
2013
65068958558 1,069,627,299,747 0.0608333
2014
41001414954 1,284,150,037,341 0.031928835
11 DLTA
2012
213421077000 745,306,835,000 0.286353307
2013
270498062000 867,040,802,000 0.311978469
2014
288073432000 991,947,134,000 0.290412082
12 ICBP
2012
2282371000000 17,753,480,000,000 0.128559077
2013
2235040000000 21,267,470,000,000 0.105091955
2014
2531681000000 24,910,211,000,000 0.101632258
13 MLBI
2012
453405000000 1,152,048,000,000 0.393564331
2013
1171229000000 1,782,148,000,000 0.657200749
2014
794883000000 2,231,051,000,000 0.35628186
14 MYOR
2012
744428404309 8,302,506,241,903 0.089663095
2013
1088764111939 9,710,223,454,000 0.112125547
2014
16 SKLT
2012
11663883341 249,746,467,756 0.046702896
2013
11440014188 301,989,488,699 0.03788216
2014
16480714984 331,574,891,637 0.049704352
17 STTP
2012
74626183474 1,249,840,835,890 0.05970855
2013
114437068803 1,470,059,394,892 0.077845201
2014
123465403948 1,700,204,093,895 0.07261799
18 ULTJ
2012
353431619485 2,420,793,382,029 0.145998259
2013
325127420664 2,811,620,982,142 0.115637002
2014
283360914211 2,917,083,567,355 0.097138429
19 KICI
2012
2259475494 94,955,970,131 0.023794981
2013
7419500718 98,295,722,100 0.07548142
2014
4703508241 96,745,744,221 0.048617211
20 GGRM
2012
4068711000000 41,509,325,000,000 0.098019204
2013
4383932000000 50,770,251,000,000 0.086348441
2014
5395293000000 58,220,600,000,000 0.092669828
21 HMPS
2012
9945296000000 26,247,527,000,000 0.378904115
2013
10818486000000 27,404,594,000,000 0.394769067
2014
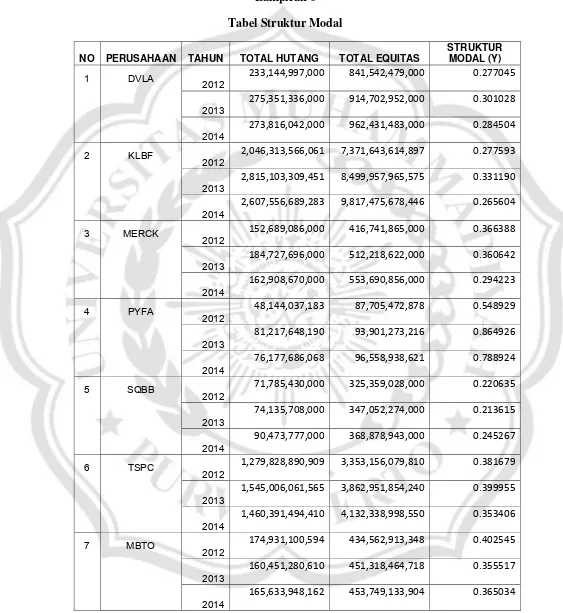
Lampiran 6
Tabel Struktur Modal
NO PERUSAHAAN TAHUN TOTAL HUTANG TOTAL EQUITAS
STRUKTUR MODAL (Y)
1 DVLA
2012
233,144,997,000 841,542,479,000 0.277045
2013
275,351,336,000 914,702,952,000 0.301028
2014
273,816,042,000 962,431,483,000 0.284504
2 KLBF
2012
2,046,313,566,061 7,371,643,614,897 0.277593
2013
2,815,103,309,451 8,499,957,965,575 0.331190
2014
2,607,556,689,283 9,817,475,678,446 0.265604
3 MERCK
2012
152,689,086,000 416,741,865,000 0.366388
2013
184,727,696,000 512,218,622,000 0.360642
2014
162,908,670,000 553,690,856,000 0.294223
4 PYFA
2012
48,144,037,183 87,705,472,878 0.548929
2013
81,217,648,190 93,901,273,216 0.864926
2014
76,177,686,068 96,558,938,621 0.788924
5 SQBB
2012
71,785,430,000 325,359,028,000 0.220635
2013
74,135,708,000 347,052,274,000 0.213615
2014
90,473,777,000 368,878,943,000 0.245267
6 TSPC
2012
1,279,828,890,909 3,353,156,079,810 0.381679
2013
1,545,006,061,565 3,862,951,854,240 0.399955
2014
8 TCID
2012
164,751,376,547 1,096,821,575,914 0.150208
2013
282,961,770,795 1,182,990,689,957 0.239192
2014
569,730,901,368 1,283,504,442,268 0.443887
9 ADES
2012
179,972,000,000 209,122,000,000 0.860608
2013
176,286,000,000 264,778,000,000 0.665788
2014
209,066,000,000 295,799,000,000 0.706784
10 CEKA
2012
564,289,732,196 463,402,986,308 1.217708
2013
541,352,365,829 528,274,933,918 1.024755
2014
746,598,865,219 537,551,172,122 1.388889
11 DLTA
2012
147,095,322,000 598,211,513,000 0.245892
2013
190,482,809,000 676,557,993,000 0.281547
2014
227,473,881,000 764,473,253,000 0.297556
12 ICBP
2012
5,766,682,000,000 11,986,798,000,000 0.481086
2013
8,001,739,000,000 13,265,731,000,000 0.603189
2014
9,870,264,000,000 15,039,947,000,000 0.656270
13 MLBI
2012
822,195,000,000 329,853,000,000 2.492610
2013
794,615,000,000 987,533,000,000 0.804647
2014
1,677,254,000,000 553,797,000,000 3.028644
14 MYOR
2012
5,234,655,914,665 3,067,850,327,238 1.706294
2013
5,816,323,334,823 3,839,300,119,177 1.514944
2014
6,190,553,036,545 4,100,554,992,789 1.509687
15 ROTI
2012
538,337,083,673 666,607,597,550 0.807577
2013
1,035,351,397,437 787,337,649,671 1.315003
2014
16 SKLT
2012
120,263,906,808 129,482,560,948 0.928804
2013
162,339,135,063 139,650,353,636 1.162468
2014
178,206,785,017 15,336,810,620 11.619547
17 STTP
2012
670,149,495,580 579,691,340,310 1.156045
2013
775,930,985,779 694,128,409,113 1.117849
2014
882,610,280,834 817,593,813,061 1.079522
18 ULTJ
2012
744,274,268,607 1,676,519,113,422 0.443940
2013
796,474,448,056 2,015,146,534,086 0.395244
2014
651,985,807,625 2,265,097,759,730 0.287840
19 KICI
2012
28,398,892,246 66,557,077,885 0.426685
2013
24,319,143,497 73,976,578,603 0.328741
2014
18,065,657,377 78,680,086,844 0.229609
20 GGRM
2012
14,537,777,000,000 26,605,713,000,000 0.546416
2013
21,353,980,000,000 29,416,271,000,000 0.725924
2014
24,991,880,000,000 33,228,720,000,000 0.752117
21 HMPS
2012
12,939,107,000,000 13,308,420,000,000 0.972250
2013
13,249,559,000,000 14,155,035,000,000 0.936032
2014
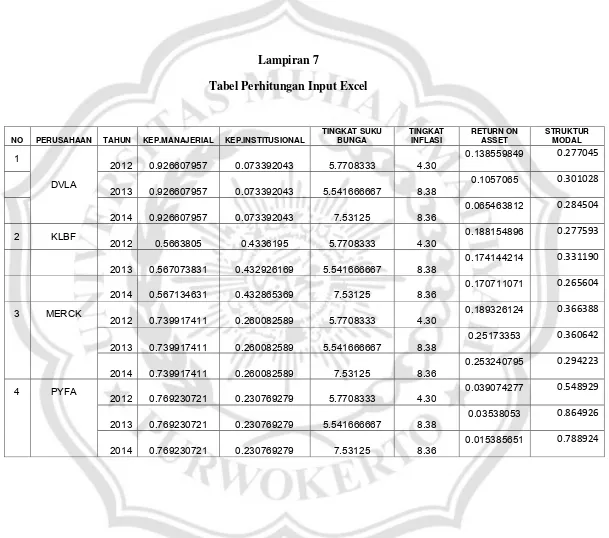
Tabel Perhitungan Input Excel
NO PERUSAHAAN TAHUN KEP.MANAJERIAL KEP.INSTITUSIONAL
TINGKAT SUKU BUNGA
TINGKAT INFLASI
RETURN ON ASSET
STRUKTUR MODAL
1
DVLA
2012 0.926607957 0.073392043 5.7708333 4.30
0.138559849 0.277045
2013 0.926607957 0.073392043 5.541666667 8.38
0.1057065 0.301028
2014 0.926607957 0.073392043 7.53125 8.36
0.065463812 0.284504
2 KLBF
2012 0.5663805 0.4336195 5.7708333 4.30
0.188154896 0.277593
2013 0.567073831 0.432926169 5.541666667 8.38
0.174144214 0.331190
2014 0.567134631 0.432865369 7.53125 8.36
0.170711071 0.265604
3 MERCK
2012 0.739917411 0.260082589 5.7708333 4.30
0.189326124 0.366388
2013 0.739917411 0.260082589 5.541666667 8.38
0.25173353 0.360642
2014 0.739917411 0.260082589 7.53125 8.36
0.253240795 0.294223
4 PYFA
2012 0.769230721 0.230769279 5.7708333 4.30
0.039074277 0.548929
2013 0.769230721 0.230769279 5.541666667 8.38
0.03538053 0.864926
2014 0.769230721 0.230769279 7.53125 8.36
2013 0.074671875 0.925328125 5.541666667 8.38
0.354998486 0.213615
2014 0.074632813 0.925367188 7.53125 8.36
0.358783135 0.245267
6 TSPC
2012 0.775248204 0.224751796 5.7708333 4.30
0.137098673 0.381679
2013 0.775248204 0.224751796 5.541666667 8.38
0.118073239 0.399955
2014 0.775248204 0.224751796 7.53125 8.36
0.104473667 0.353406
7 MBTO
2012 0.677503271 0.321534579 5.7708333 4.30
0.074689952 0.402545
2013 0.677503271 0.321557944 5.541666667 8.38
0.026419839 0.355517
2014 0.677503271 0.321557944 7.53125 8.36
0.004722554 0.365034
8 TCID
2012 0.789575181 0.210424819 5.7708333 4.30
0.119536046 0.150208
2013 0.242739971 0.210177801 5.541666667 8.38
0.109528641 0.239192
2014 0.242680847 0.210236926 7.53125 8.36
0.094380036 0.443887
9 ADES
2012 0.919393211 0.080606789 5.7708333 4.30
2013 0.927682353 0.072317647 5.541666667 8.38
0.0608333 1.024755
2014 0.927682353 0.072317647 7.53125 8.36
0.031928835 1.388889
11 DLTA
2012 0.58334587 0.41665413 5.7708333 4.30
0.286353307 0.245892
2013 0.58334587 0.41665413 5.541666667 8.38
0.311978469 0.281547
2014 0.58334587 0.41665413 7.53125 8.36
0.290412082 0.297556
12 ICBP
2012 0.805329454 0.194670546 5.7708333 4.30
0.128559077 0.481086
2013 0.8057582 0.1942418 5.541666667 8.38
0.105091955 0.603189
2014 0.8057582 0.1942418 7.53125 8.36
0.101632258 0.656270
13 MLBI
2012 0.762429521 0.237570479 5.7708333 4.30
0.393564331 2.492610
2013 0.762429521 0.237570479 5.541666667 8.38
0.657200749 0.804647
2014 0.762429521 0.237570479 7.53125 8.36
0.35628186 3.028644
14 MYOR
2012 0.330651321 0.669348679 5.7708333 4.30
0.089663095 1.706294
2013 0.330651324 0.669348676 5.541666667 8.38
0.112125547 1.514944
2014 0.330651324 0.669348676 7.53125 8.36
2013 0.7075 0.2925 5.541666667 8.38
0.086693488 1.315003
2014 0.7075 0.2925 7.53125 8.36
0.088001318 1.231897
16 SKLT
2012 0.962162346 0.037837654 5.7708333 4.30
0.046702896 0.928804
2013 0.962162346 0.037837654 5.541666667 8.38
0.03788216 1.162468
2014 0.962162346 0.037837654 7.53125 8.36
0.049704352 11.619547
17 STTP
2012 0.567633969 0.432366031 5.7708333 4.30
0.05970855 1.156045
2013 0.567633969 0.432366031 5.541666667 8.38
0.077845201 1.117849
2014 0.567633969 0.432366031 7.53125 8.36
0.07261799 1.079522
18 ULTJ
2012 0.645826115 0.354173885 5.7708333 4.30
0.145998259 0.443940
2013 0.643873465 0.356126535 5.541666667 8.38
0.115637002 0.395244
2014 0.644815515 0.355184485 7.53125 8.36
0.097138429 0.287840
19 KICI
2012 0.82774942 0.17225058 5.7708333 4.30
2013 0.764669651 0.235330349 5.541666667 8.38
0.086348441 0.725924
2014 0.764669651 0.235330349 7.53125 8.36
0.092669828 0.752117
21 HMPS
2012 0.981786038 0.018213962 5.7708333 4.30
0.378904115 0.972250
2013 0.981786038 0.018213962 5.541666667 8.38
0.394769067 0.936032
2014 0.981786038 0.018213962 7.53125 8.36
Lampiran 8
Table Hasil Output SPSS
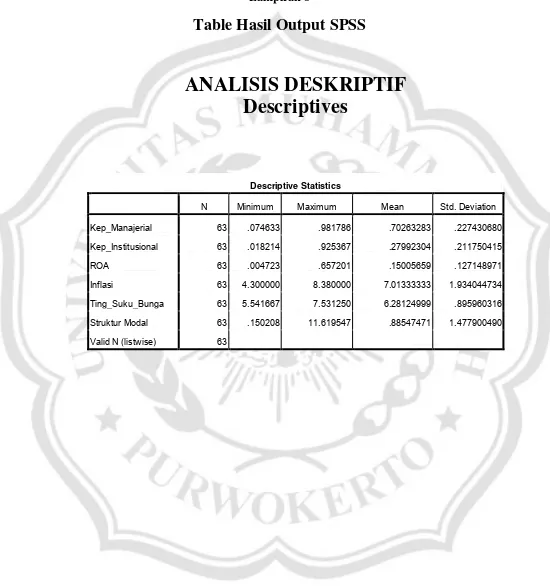
ANALISIS DESKRIPTIF
Descriptives
Descriptive Statistics
N Minimum Maximum Mean Std. Deviation
Kep_Manajerial 63 .074633 .981786 .70263283 .227430680
Kep_Institusional 63 .018214 .925367 .27992304 .211750415
ROA 63 .004723 .657201 .15005659 .127148971
Inflasi 63 4.300000 8.380000 7.01333333 1.934044734
Ting_Suku_Bunga 63 5.541667 7.531250 6.28124999 .895960316
Struktur Modal 63 .150208 11.619547 .88547471 1.477900490
UJI NORMALITAS
NPar Tests
One-Sample Kolmogorov-Smirnov Test data awal (N=63) Unstandardized
Residual
N 63
Normal Parametersa Mean .0000000
Std. Deviation 1.42403746
Most Extreme Differences Absolute .277
Positive .277
Negative -.202
Kolmogorov-Smirnov Z 2.201
Asymp. Sig. (2-tailed) .000
a. Test distribution is Normal.
One-Sample Kolmogorov-Smirnov Test data akhir (N=43) Unstandardized
Residual
N 43
Normal Parametersa Mean .0000000
Std. Deviation .21798877
Most Extreme Differences Absolute .115
Positive .115
Negative -.082
Kolmogorov-Smirnov Z .754
Asymp. Sig. (2-tailed) .620
Lampiran 9
DATA CASEWISE
Casewise Diagnosticsa Case
Number Std. Residual Struktur Modal Predicted Value Residual
37 1.187 2.492610 .73023480 1.762375203E0
39 1.136 3.028644 1.34211631 1.686527694E0
48 6.739 11.619547 1.61061354 1.000893346E1
a. Dependent Variable: Struktur Modal
Casewise Diagnosticsa Case
Number Std. Residual Struktur Modal Predicted Value Residual
2 -1.056 .301028 .72990138 -4.288733837E-1
3 -1.062 .284504 .71575084 -4.312468382E-1
20 -1.011 .355517 .76597913 -4.104621342E-1
22 -1.208 .150208 .64072081 -4.905128059E-1
28 1.303 1.217708 .68846560 5.292423986E-1
30 1.604 1.388889 .73733541 6.515535901E-1
38 1.079 .804647 .36656095 4.380860517E-1
40 2.641 1.706294 .63366083 1.072633171E0
41 2.027 1.514944 .69171575 8.232282469E-1
42 1.999 1.509687 .69798370 8.117033008E-1
44 1.441 1.315003 .72957962 5.854233847E-1
45 1.337 1.231897 .68876144 5.431355598E-1
49 1.206 1.156045 .66643232 4.896126817E-1
56 -1.022 .328741 .74394223 -4.152012335E-1
57 -1.210 .229609 .72120522 -4.915962169E-1
61 1.199 .972250 .48524228 4.870077152E-1
63 1.408 1.102563 .53068083 5.718821681E-1
UJI AUTOKORELASI
Model Summaryb
Model R R Square
Adjusted R
Square
Std. Error of the
Estimate Durbin-Watson
1 .268a .072 -.010 1.485182520 1.689
a. Predictors: (Constant), Ting_Suku_Bunga, Kep_Institusional, ROA, Inflasi,
Kep_Manajerial
b. Dependent Variable: Struktur Modal
UJI MULTIKOLENIARITAS
Model
Unstandardized Coefficients
Standardized
Coefficients Collinearity Statistics
B Std. Error Beta Tolerance VIF
1 (Constant) .286 .423
Kep_Manajerial .583 .314 .487 .241 4.151
Kep_Institusional .127 .366 .097 .213 4.691
ROA -.772 .428 -.283 .669 1.495
Inflasi .038 .020 .270 .837 1.195
Ting_Suku_Bunga -.054 .045 -.171 .814 1.228
UJI HETEROKESDASTISITAS
Coefficientsa
Model
Unstandardized Coefficients
Standardized Coefficients
t Sig.
B Std. Error Beta
1 (Constant) .054 .235 .227 .821
Kep_Manajerial .095 .174 .177 .544 .589
Kep_Institusional .040 .203 .068 .195 .846
ROA -.032 .238 -.026 -.134 .894
Inflasi .014 .011 .226 1.297 .203
Ting_Suku_Bunga -.008 .025 -.055 -.309 .759
ANALISIS REGRESI BERGANDA
Regression
Variables Entered/Removedb Model
Variables Entered
Variables
Removed Method
1 Ting_Suku_Bun
ga, ROA, Inflasi, Kep_Manajerial, Kep_Institusional
a
. Enter
a. All requested variables entered.
b. Dependent Variable: Struktur Modal
Model Summary
Model R R Square
Adjusted R Square
Std. Error of the Estimate
1 .623a .388 .306 .232251164
a. Predictors: (Constant), Ting_Suku_Bunga, ROA, Inflasi, Kep_Manajerial, Kep_Institusional
ANOVAb
Model Sum of Squares df Mean Square F Sig.
1 Regression 1.268 5 .254 4.701 .002a
Residual 1.996 37 .054
Total 3.264 42
a. Predictors: (Constant), Ting_Suku_Bunga, ROA, Inflasi, Kep_Manajerial, Kep_Institusional b. Dependent Variable: Struktur Modal
Coefficientsa
Model
Unstandardized Coefficients
Standardized Coefficients
t Sig.
B Std. Error Beta
1 (Constant) .286 .423 .676 .503
Kep_Manajerial .583 .314 .487 1.860 .071
Kep_Institusional .127 .366 .097 .348 .730
ROA -.772 .428 -.283 -1.801 .080
Inflasi .038 .020 .270 1.921 .062
Coefficientsa
Model
Unstandardized Coefficients
Standardized Coefficients
t Sig.
B Std. Error Beta
1 (Constant) .286 .423 .676 .503
Kep_Manajerial .583 .314 .487 1.860 .071
Kep_Institusional .127 .366 .097 .348 .730
ROA -.772 .428 -.283 -1.801 .080
Inflasi .038 .020 .270 1.921 .062
Ting_Suku_Bunga -.054 .045 -.171 -1.198 .238