A STATIC AND DYNAMIC TECHNIQUE CONTINGENCY
RANKING ANALYSIS IN VOLTAGE STABILITY
ASSESSMENT
Muhammad Nizam
Engineering Faculty Sebelas Maret University
(Ph.D Student of Electrical, Electronic and System Department Engineering Faculty, Universiti Kebangsaan Malaysia)
Email : [email protected]
ABSTRACT
The objective of the research is to compare between technique for determine the weak bus of the power system using static and dynamic contingency ranking analysis. Identification of the weak bus is very important for providing a proper control system to prevent for voltage collapse. Test system of this research is using the New England (IEEE 39 bus) power system. A severity ranking of the system is carried out on the study system to specify weak buses, in term of voltage instability. A contingency as a load increment is employed to examine the network buses condition and stability margin in the system. Three methods techniques as eigenvalue analysis of jacobian matrix is used as a static methods and a voltage collapse prediction index, and power transfer stability index as a dynamic methods are investigated. The result showed that the static analysis is giving more optimistic in evaluating loadability limit than dynamic. For the contingency ranking both static and dynamic give same trend in every bus. But for final decisions involving several consideration both planning and operation should be confirm by more accurate time domain simulation (dynamic) in which different characteristics of load, multiple controller, protection relays and coordinated them taken into account
Key words: contingency analysis, static and dynamic analysis, voltage stability
INTRODUCTION
Voltage instability and voltage collapse is became important concern to electric power industry in recent years. The voltage problems are often associated with contingencies like unexpected line and generator outages, insufficient local reactive power supply and increased loading of transmission lines (Hasani&Paniani, 2005; Balamourgan et. al. 2004; Nizam et. al.,2006). Voltage
collapse is usually characterized by an initial slow and progressive decrease and a final rapid decline in voltage magnitude at different buses (Hasani&Paniani, 2005; Kundur, 1994)
continuation power flow (Kundur, 1994; Dong et. al., 2004). These power flow-based static methods can provide a measure of degree of stability, like a proximity indicator, dominant eigenvalues, real and reactive power margin, etc. Dynamic simulations on the other hand, can produce the time response of system to a sequence of discrete events. Therefore it is able to shed light on the mechanism of voltage stability and also provide corrective strategies to improve voltage stabilities (Huang&Zhang., 2001). Several dynamic voltage collapse indicators, like a voltage collapse prediction index (Balamourgan, et.al., 2004) and power transfer stability index (Nizam et.al, 2006). Although different approaches have been proposed and employed for voltage collapse analysis till now, few literatures dealt with dynamics of this phenomenon in large interconnected power systems. Most of the methods that are applied to this network are of static type. Little work has been published on dynamic voltage stability analysis of the systems, and the differences between the results of two approaches have been rarely analyzed. This paper investigates the discrepancies between static and dynamic techniques for voltage collapse analyzing.
In this paper, the New England (IEEE 39 bus) power system is used as the test system. A severity ranking of the system is carried out on the study system to specify weak buses, in term of voltage instability. The contingency load increment at bus 15 is provided. For this contingency static and dynamic methods are employed to examine the network buses condition and stability margin with three methods techniques as eigenvalue analysis of jacobian matrix as a static methods and a voltage collapse prediction index, and
power transfer stability index as a dynamic methods.
VOLTAGE COLLAPSE ANALYSIS METHODS
Many aspects of voltage stability problems can be effectively analyzed by using static methods. These methods examine the viability of the equilibrium point represented by a specified operating condition of the power system. Static approach like sensitivity analysis for voltage stability assessment uses a system condition or snapshot for voltage stability evaluation. They usually solve power flow equation of the network with specific load increments until the point of voltage collapse is reached. The dynamic method is giving more clarifies of this phenomenon. It shows the time event of their chronologies leading the system to final phase of voltage collapse.
Eigen value Analysis
This methods calculates the relationship between voltage changes and reactive power changes at different buses using reduced Jacobian matrix (Kundur, 1994). From the power flow equation,
bus reactive power injection, is incremental in bus voltage angle and V is incremental change in bus voltage magnitude. The elements of Jacobian matrix give the sensitivity between power flow and bus voltage changes. In fact system voltage stability is affected by both P and Q. However at each operating point we may keep P constant and evaluate voltage stability by considering the incremental relationship between Q and V. Base on above considerations, equation (1), let P=0. Then equation (1) become
is the reduced V-Q Jacobian of the system. JR-1 is also called sensitivity of V-Q. A positive sensitivities represent stable operation; the smaller the sensitivity the more the stable the system. As stability decrease, the magnitude of sensitivity becoming infinite at the maximum loadability limit. Conversely, a negative V-Q sensitivity is indicative of unstable operation. A small negative sensitivity represents a very unstable operation. The magnitudes of sensitivities for different system conditions do not provide a direct measure of relative degree of stability. It is because of the non linear nature of the Q-V relationship (Kundur, 1994). Voltage stability characteristics of the system can be identified by computing the eigenvalues
and eigenvectors of the reduced jacobian matrix JR. Since the jacobian reduction matrix dimension is 1x1 then the eigenvalues is equal to value of jacobian reduction of the system.
Dynamic Analysis
An indices for detection of voltage stability index is the Power Transfer Stability Index (PTSI). The PTSI is calculated by knowing information of total load power, voltage and impedance at bus Thevenin equivalent system, where one of the buses is a slack bus connected to a load bus. The magnitude of load apparent power SL from equation (6) can be expressed as,
)
Substituting equations (6) and (7) into
ZThev is impedance Thevenin connected at bus α phase angle of Load bus
EThev is voltage Thevenin at bus
The other indices that have been proposed by other researchers namely VCPI are also described(Balamourgan et. al., 2004). The calculation of the voltage collapse prediction index (VCPI) requires voltage phasor information of the participating buses in a system and network admittance matrix.
k
k is the monitoring bus
m is the other bus connected to bus k
The value of VCPI varies between 0 and 1. If the index is zero, the voltage at
bus k is considered stable and if the index is unity, a voltage collapse is said to occur.
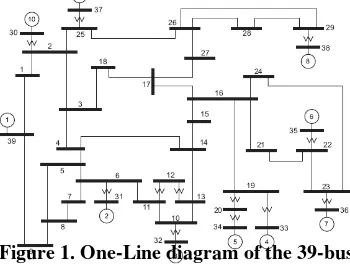
TEST SYSTEM AND MODELING This paper presented comparison technique of static and dynamic analysis for voltage collapse. The New England (IEEE 39 bus) power system shown in Figure 1 is used as the test system. Power System Analysis Toolbox is used in the simulation presented in this paper. For static power flow simulation, we followed the general methodology used for planning and operation in power system. The loads were represented mixed load as static and voltage sensitive load (Induction Motors). Reference (Hasani&Paniani, 2005) describes the general consideration of static analysis. which bus 31 is a slack bus. All generators are equipped with identical automatic voltage regulator (AVR), over excitation limiters (OEL) and turbine governor. The load and line data of the test system for steady state power flow calculation are given in appendix A.
Generator and Load Modeling
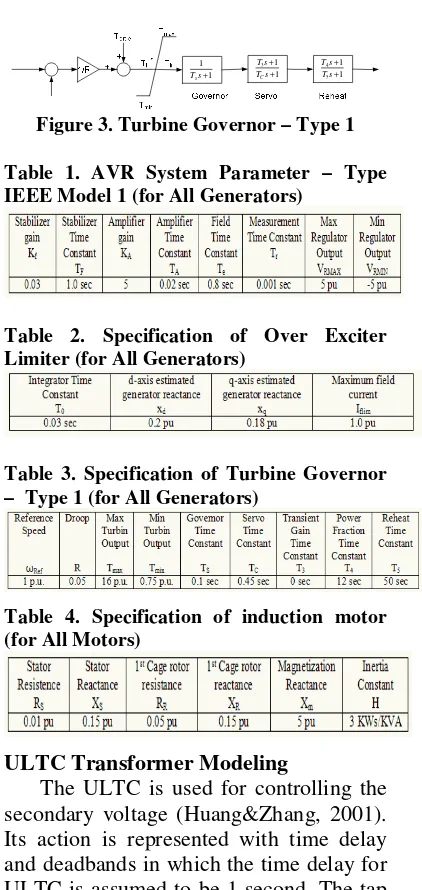
All the ten generators have identical dynamic characteristics using the sixth order synchronous machine model (two axes, with two windings on each axis) for each generator (Milano, 2005). The AVR of IEEE model 1, Over Exciter Limiter and the type 1 steam turbine governors as shown in Figure 2 and 3 are used in the study. Both AVR and over excitation limiter (OEL) regulate the voltage at the synchronous generator terminal by performing both regulating and excitation system stabilizing functions. Specification of AVR, OEL and Turbine governor is shown on table 1, 2 and 3. The AVR defines the primary voltage regulation of the synchronous generator while the OEL provides an additional signal to the reference voltage of AVR (Silva et.al, 2004). The turbine governor Type 1 (Milano, 2006) define the primary frequency regulation of the synchronous generators.
The entire system contains six induction motors which have identical dynamic characteristics. The type of induction motor used is the single cage induction motor model. These induction motors are connected at bus 4, 12, 16, 21 and 23 with ratings of 500 + j184 MVA, 8.5 + j88 MVA, 329 + j32.3 MVA, 274 + j115 MVA, and 23 of 247.5 + j84.6 MVA, respectively. Table 4 gives the detailed specification of each induction motor.
1
Figure 3. Turbine Governor – Type 1
Table 1. AVR System Parameter – Type IEEE Model 1 (for All Generators)
Table 2. Specification of Over Exciter Limiter (for All Generators)
Table 3. Specification of Turbine Governor – Type 1 (for All Generators)
Table 4. Specification of induction motor (for All Motors)
ULTC Transformer Modeling
IEEE 39 bus was used for contingency selection. This contingency selection is based on voltage instability in power system (Hasani&Paniani, 2005). The static analysis methods were used to select the most severe conditions corresponding to every load in load increment contingency at bus 15.
To find the loadibility margin of static and dynamic methods can be defined at one bus, one sub-area or the entire system. This paper the entire system loadability is calculated to find maximum power margin in the entire system. First for static analysis continuation power flow is used. A second for the dynamic analysis is using time domain simulation with increment load at bus 15 at a rate of 0.1 + j0.05 p.u. MVA/s with initial load of 3.20+j1.53 p.u. A third method to determine the maximum loadability is giving the disturbance as line outage between bus 4 and 14 and increment load at bus 15 at a rate of 0.1 + j0.05 p.u. MVA/s with initial load of 3.20+j1.53 p.u.
The technique to compare static and dynamic at voltage collapse point is using eigenvalue analysis as static analysis and power transfer stability index (PTSI) and voltage collapse prediction index (VCPI) as the dynamic tools analysis. To reach voltage collapse at system, the increment load at bus 15 at a rate of 0.1 + j0.05 p.u. MVA/s with initial load of 3.20+j1.53 p.u. is used as a contingency. Status of stability, voltage collapse and contingency ranking is calculated when the simulation is stop. Other contingencies also presented as a line outage between bus 3 and 4 and a generator outages at bus 30.
RESULT
In these four test cases is considered to evaluate the performance of static and dynamics analysis for voltage collapse.
Comparison of Static and Dynamic Methods to find Loadability Margins
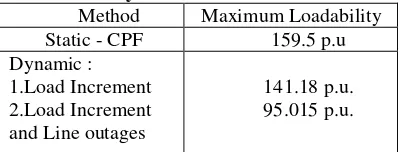
A first method, the continuation power flow, is used to find the maximum power margin in entire system. The initial value shows total load of 65.2843 p.u. MVA. The continuation power flow shows the margin in entire system to be 159.5 p.u. MVA.
A second method, increasing load is happened at bus 15 with a rate increase of 0.1 + j0.05 p.u. MVA/s with initial load of 3.20+j1.53 p.u. The initial value shows total load of 65.2843 p.u. MVA. Using the dynamic simulations by PSAT, the maximum loading of entire system was found 141.18 p.u. MVA.
A third methods to determine maximum loadability is giving the disturbance as line outage between bus 4 and 14 and increment load at bus 15 at a rate of 0.1 + j0.05 p.u. MVA/s with initial load of 3.20+j1.53 p.u. By following this methods the maximum loading of entire system was found to be 95.0147 p.u. MVA with initial value shows total load of 65.2843 p.u. MVA. The reason for the difference between two margins is the second method the load increase was only assigned to load impedance. Results of three method show on table 5.
From maximum loadability showed at table 5 indicate the static method is optimistic in evaluating the stability margin.
Table 5. Comparison Maximum Loadability of Static and Dynamic
Method Maximum Loadability
Static - CPF 159.5 p.u
Dynamic : 1.Load Increment 2.Load Increment and Line outages
Comparison of Static and Dynamic Methods to find Bus Ranking Identification.
In voltage stability control part is very important. The bus identification system is part of it. The bus identification is to find the weak area of the system. To compare the static and dynamic methods can be defined at every load bus in the entire system. First, the Eigen value analysis is used for static method analysis. The power transfer stability index (PTSI) and voltage collapse prediction index (VCPI) are used simulation stop or voltage collapse occurs. Result of the simulation showed that the voltage in time domain simulation at every load bus. The simulation end at t = 24 sec.
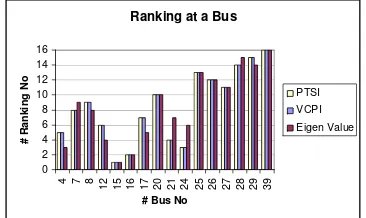
From this case the comparison result, static and dynamic contingency ranking analysis can be shown as a table 6.
At table 6 showed ranking at both static and dynamic analysis. Ranking arrange from the highest to lowest at PTSI and VCPI. The higher indicate the weaker bus. The Eigen value arrange from low to high. The lowest indicate the weaker bus.
From table 6 the weakest bus indicates at bus 15. Figure 5 shows the bar chart comparison between static and dynamic in every load buses.
Figure 4. Voltage vs Time at load increment contingency
Table 6. Ranking contingency for load increment at Bus 15
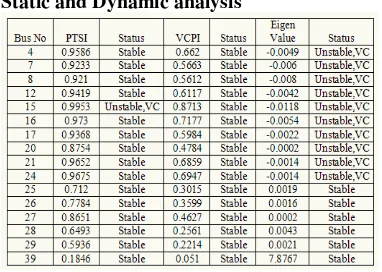
For stability ranking, there are two status of stability in every load bus. First, determine stable or unstable the system, second, determine voltage collapse in every load bus. Table 7 shows the status of stability in every load bus.
Ranking at a Bus
0
Table 7. Comparison Status of Stability for Static and Dynamic analysis
From the static and dynamic give same indicates. According to part 2.1 positive value of Eigen value indicate the system is stable when negative value is indicating system unstable. In dynamic indicator also give same indicate, especially for PTSI. The PTSI give more accurate than VCPI. In this case both static and dynamics analysis gives same trend.
It showed at Table 7, that the VCPI give all bus in stable authority and PTSI give one bus collapse when fifteen buses is in stable authority. It can be shown at table 7 Eigen value is giving ten buses are unstable and six more bus are still in stable authority. One bus said collapse when the Eigen value equal to zero. Negative Eigen value also mean a bus is collapsed. According to section 2.1 the least Eigen value is very unstable bus. In other word it can be said that negative part of Eigen value show which is the bus reach collapse
first. Compare to the PTSI, the trend is same as the Eigen value analysis. PTSI only show until value unity. The PTSI value near unity gives information that a bus is stable but nearly to voltage collapse. From load increment contingency showed that the static (Eigen value analysis) and dynamic (PTSI) is give most same of contingency ranking indicator at entire system. The more optimistic load ability at static give more buses collapse compare to the dynamic analysis.
CONCLUSIONS
References
Balamourgan V, T.S.Sidhu, M.S.Sachdev, 2004, Technique For Online Prediction of
Voltage Collapse. IEE Proc-Generation, Transmission, Distribution, 151(4) 453-460.
Dong F., Chowdhury B.H., Crow M., Acar L., 2004, Cause and Effect of Voltage
Collapse – Case Study with Dynamic Simulations, IEEE PES General Meeting, Vol
2, pp. 1806-1812
Hasani M and Parniani M., 2005, Method of Combined Static and Dynamic Analysis of
Voltage collapse in Voltage Stability Assessment, IEEE/PES Transmission and
Distribution Conference and Exhibition, China
Huang G., Zhang H., 2001, Detection Voltage Stability Reserve Study For Deregulated
Environment, Power System Engineering Research centre, http://www.pserc.wisc.
edu/ecow/get/publicatio/2001public/dynamicreserve.pdf
Kundur P., 1994, Power System Stability and Control, McGraw-Hills, Inc, New York.
Milano F., Power System Analysis Toolbox Documentation For PSAT version 2.0.0., http://thunderbox.uwaterloo.ca/~fmilano, (2006)
Nizam M., Mohamed A., Hussain A., 2006, Performance Evaluation of Voltage Stability
Indices for Dynamic Voltage Collapse Prediction, Journal of Applied Science 6 (5) :
1104-1113
Silva A.S., Lerm A.A.P., Irving M. , A Basic Study of Voltage Instability with Inclusion of
Limiters, IEEE/PES Transmission and distribution conference and Exposition, (2004)