November 2012, Vol. 11, No. 11, 1441-1449
Economic Valuation of Water Resources
Conservation Area in Surakarta City
This study aims to: (1) assess the types of sustainable conservation of water resources that can be done by the community; (2) determine the willingness to pay (WTP) community for the improvement of water resources conservation management; (3) determine the determinants that significantly affect the value of willingness to pay for additional benefits due to increased conservation of water resources management; and (4) development of economic instruments that include the community’s role in the mechanism of raising funds for conservation management of water resources. This study uses a sampling method with proportional stratified random sampling (random sampling proportional stratified). The target population of 42,000 so that the sample size of 350 respondents. The model used is a multiple regression model with double the natural log. The analysis shows that the types of activities that significantly influence the conservation of water resources are the infiltration wells, infiltration holes biopori (LRB), environmental awareness, water quality, ficus benjamina, and caesalpinia pulcherrima. The results of calculations willingness to pay for conservation of water resources in the household customers Surakarta are as follows: WTP for categories R2 at 5,000; R3 at 5,100; R4 at 5,200; and N1 of 21,000. Log regression results obtained the conclusion that the WTP for the conservation of water resources was tested with partial regression coefficients (t test) shows the six variables that affect the WTP conservation, namely, awareness of environmental functions, biopori, tough water quality, infiltration wells, ficus benjamina, and caesalpinia pulcherrima. Another variable are family income, family head education, age of marriage, home ownership, family size, sources of water used, length of stay, filter, filicium decipiens tree and pterocarpus indicus tree does not significantly affect the conservation of water resources.
Mugi Raharjo, I Gusti Putu Diva Awatara, Tulus Haryono, Edi Purwanto
Sebelas Maret University, Surakarta, Indonesia
Shalihudin Djalal Tanjung
Gadjah Mada University, Yogyakarta, Indonesia
Keywords: willingness to pay, conservation, water resources, infiltration wells, biopori
Introduction
Water is a vital need in the lives of living things. One cannot survive without water, because water is one
of the life support for humans. The fact happening today is the reduced availability of clean water. The larger of
Mugi Raharjo, Dr. Drs. M.Si, Faculty of Economic, Sebelas Maret University.
I Gusti Putu Diva Awatara, SP. M.Si, Postgraduate Student of Environmental Science, Sebelas Maret University. Tulus Haryono, Professor, Dr. M.Ec, Faculty of Economic, Sebelas Maret University.
Edi Purwanto, Professor, Dr. M.Sc, Faculty of Agriculture, Sebelas Maret University.
Shalihudin Djalal Tanjung, Professor, M.Sc Ph.D., Faculty of Biology, Gadjah Mada University.
Correspondence concerning this article should be addressed to Mugi Raharjo, Faculty of Economic, Sebelas Maret University, Surakarta, Ir. Sutami 36 A Surakarta, 57126, Indonesia. E-mail: [email protected].
the population, the greater demand for drinking water, thus diminishing the availability of clean water. Drinking water and sanitation services in Indonesia are also very poor, more than 49 million people (22.31
percent) of Indonesia’s population have no access to drinking water, and 72 percent of whom live in rural areas. Similarly, the use of sanitation, more than 97 million people (44%) of Indonesia’s population lacks access to
proper sanitation, about 70% live in rural areas. In achieving the Millennium Development Goals (MDG), progress in achieving access to safe drinking water in Indonesia in the urban areas is considered to decline, while the slow progress in rural areas (Harahap & Hartono, 2007). Issues concerning the management of water
resources in Indonesia are also experienced by the province of Central Java with a population of 30 million people. The problems are mainly related to water supplied to the household sector and industrial sector.
This problem mainly occurs in the dry season. Rapid population growth, increasing purchasing power, industrialization, and urbanization contribute greatly to the demand of water for the city. Increased demand for water is not followed by the improvement of infrastructure and facilities to improve water quality and water
quantity. Coverage of water supply for the city of Surakarta, for example, has only reached 61% of the urban population and dirty water (sanitation) has reached 10% (PDAM Surakarta, 2008).
Water resource management policy will be optimal if involves community participation in water resource management and development. Community involvement can be realized with the willingness to pay (WTP) as a form of public awareness of water resource management. The purpose of this study were to: assess the types of
sustainable water resource conservation that can be done by the community; determine the WTP for improved management of the conservation of water resources; define determinants that significantly affect the value of
WTP for additional materials obtained as water resource conservation and development of economic instruments that include the role of the community to contribute positively to the management of water conservation; and development of fund-raising mechanism for the management of water conservation.
The benefits of this research is to contribute to the relevant agencies—local water company (PDAM), Department of City Planning and Public Works Department in the determination of policy strategies, and the
development of conservation management of water resources in the city of Surakarta.
Literature Review
Conservation of Water Resources
The future challenges in water management (water management) are to achieve sustainable development in the face of population expansion and escalation of the continuity of economic activity as well as the
problems of poverty and environmental degradation. In the arid/dry and somewhat arid/dry in the developing world, water has been perceived as scarce, however in a rather moist and damp, the competition to take the available water is so tight and continue to increase. The time period of available water supplies with ease, with
the costs of economic, social, environmental development and low has passed. Now we are entering a period of “mature water economy”, with increased competition for access to the fixed supply, the growing risk of water
pollution, and a sharp increase of the costs of economic, social, and environmental development. For it is necessary to reorient the policy of only thinking about water supply, the demand-oriented policies for management, and water development. This trend requires new perspectives in water policies, particularly in
developing countries like Indonesia.
Connelly, Brown, and Brow (2007) in the study of water policy at the national level showed a conceptual
including public finance, agriculture, energy, industry and commerce, health, housing, transportation, and environment. His desire was to identify things that are important in a national water policy.
Catchment Area
Catchment area of a particular catchment area is used to incorporate rainwater into the ground. Air
infiltration in the town or larger areas, either in the form of rounded or elongated in shape path is more open without the use of the building (Romeon, 2009).
Ground water recharge area (recharge zone) is the area with water in the soil surface, either rainwater or
surface water runs into the process of infiltration (infiltration) by gravity through the soil pore hole/rock or cracks/fissures in the soil/rock (Loebis, 2006). Freeze and Cherry (1979) tried to give a definition and how to identify the groundwater recharge area as follows:
(1) Catchment area is the area where the entry of water into the saturated zone of water to form an imaginary line called the water table (water table) and associated with the flow of water in the saturated
condition towards the overflow area;
(2) In networking terminology depiction of groundwater flow (net flow) the stream network position will move away from the groundwater;
(3) Catchment has a composition of mineral salts and a little more than the composition of the overflow area in the ground water flow systems, which are the same;
(4) This area can be determined by looking at the distribution of plants;
(5) This area can be determined by looking at the reduction of water pressure against the overflow area that will increase water pressure (this condition can be applied when measuring the water pressure in a vertical
drill hole).
Environmental Analysis
When the environmental quality decreases, benefit will be reflected in the value spent on environmental
quality at the desired level. The estimation of direct damage has been limited on the market value. It will change and adapt to environmental pollution. It is difficult to measure by approach of direct damage. The
estimation should be used in basic concept to determine willingness to pay (Muharram, 2010). There are three ways to estimate WTP for improving environmental quality (King, 2009):
(1) Revealed WTP. This method reveals WTP by linking to market value. The economic valuation can be
done by estimating consumer surplus and producer as well as market goods. Revealed WTP includes three methods: productivity method; hedonic pricing method; and travel cost method.
(2) Imputed WTP. This method reveals WTP which spent to reduce the impact of poor environmental quality. Imputed WTP includes damage cost avoided, replacement cost, and substitute cost methods. They are used to estimate the value of non-market goods and non-market services. It bases on costs for avoiding loss of
non-market goods or services, costs for replacing environmental assets, and costs for providing services or goods on non-replacement market.
(3) Expressed WTP. This method reveals WTP by surveys on environmental quality change which base on hypothetical scenario.
Previous Researches
Several previous studies related to economic valuation of water resources conservation by:
with the institutional approach. The study was institutional and decision-makers must be synergy and sustainable strategies.
(2) Hosking and Preez (2004) conducted a study entitled The Valuation of Water for Conservation Projects in South Africa. The method used is the marginal cost and WTP the variable water demand, the cost of
water supply and water quality. The result of the study was the maintenance of water was positively correlated with the value of the benefits of water conservation in some locations. This study showed that water is something that needs to be maintained with the conservation of one of its sustainability. Value of the benefits of
water will increase water conservation in some locations.
(3) Seraj (2008) conducted a study Willingness to Pay for Improved Sanitation Services and Its
Implication on Demand Responsive Approach of BRAC Water, Sanitation and Hygiene Program with the WTP method to increase domestic water services. The result was 80% of households willing to pay for improved water services and fund-raising mechanism in Bangladesh.
(4) Calderon and Camacho (2008) conducted a study on A User Fee for Household Water in Metro Manila, Philippines with the CVM, and the logit model. Variable used is the cost of conservation, the additional cost of
conservation, age, and income. The results of this study showed that Metro Manila people have low awareness about water conservation.
(5) Nam and Son (2008) conducted a study titled Household Demand for Improved Water Services in Ho
Chi Minh City: A Comparison of Contingent Valuation and Choice Modeling Estimation, results showed that respondents are willing to pay more for improved quality of water supply services. This study used the WTP
and choice modeling on improving the quality of water supply services.
Research Method
Research Scope
The research was conducted at local water company’s customers (PDAM) Surakarta. The method of study used descriptive and statistical approaches.
Data Type
Data used in this study was primary data. The data was obtained by field survey in questioners to PDAM customer. Secondary data was obtained from PDAM and city government of Surakarta.
Sampling Techniques
Sampling was stratified random sampling using a proportional basis. It used stratified sample because of the large estimated WTP values that will be different for each PDAM customer group. Population used in this
study is the PDAM customer and samples used amounted to 350 customers.
Operational Definition of Variables
(1) Level of family income and expenditure.
Given the variety of livelihoods of respondents who were targeted, then the income in this study is the household income (head of the family, father, mother, children who are already working) as regular monthly
salaries, wages, and benefits, monthly family income variable are measured in rupiah (Rp). (2) Age of head family.
Variables used by his/her old age married respondents, rounded down and expressed in units of years. The
This leads to higher environmental awareness. WTP for conservation of water resources requires an understanding and awareness.
(3) Education of head family.
Education levels of education are classified based on the length of time taken. Education level variables
are thought to influence the WTP for conservation of water resources. The higher levels of education have greater WTP for conservation of water resources and this applies vice versa.
(4) Home ownership.
Home ownership variable is a dummy variable, to distinguish between self-owned homes and rental houses. This variable is thought to affect the WTP for conservation of water resources. Own home if given the
number 1 and the notation given a rental home notation 0.
(5) Number of family members who work and number of dependents.
Variable number of family members will determine the amount of water used per month. Quantity of
water used will be calculated in m3. The more the number of family members is working, the greater of the willingness to pay for conservation of water resources. The family members demand clean water, so the WTP
for conservation of water resources is higher. (6) Environmental awareness.
Variable of environmental awareness is expected to affect the WTP for conservation of water resources to
be measured with the Likert scale. The greater of the willingness to pay for conservation of water resources is due to the higher awareness of the availability of water for present and future.
(7) Sources of water used.
Variable sources of water used are distinguished from wells and PDAM only. For those who receive care facilities (water, sewage) from the PDAM, then allege to have awareness of environmental/conservation of
water resources. This variable is a dummy variable. If the water comes from PDAM and wells were numbers 1 and PDAM notation just given the notation 0.
(8) Expected length of stay in households.
This variable indicates that the longer a person’s expectations to live in a house, the greater the WTP for conservation of water resources due to high awareness of the availability of water for present and future.
(9) Water quality.
Water quality will determine whether people are willing to pay or not. If water quality is good, people are
willing to pay, and this is true vice versa. This variable is a dummy variable. If the water quality is given the number notation 1 (one), and poor water quality given the notation 0 (zero).
(10) Planting tree of filicium decipiens, caesalpinia pulcherrima, and ficus benyamina.
(11) Making of infiltration wells, catchments pit, biopori, and filtering tools.
Data Analysis
The model used in this study is multinomial logit models to determine the format of respondents WTP dichotomous choice valuation or discrete choice. Respondents were asked about their willingness to pay a sum of money to be used for purposes of improving water conservation management. Formula willingness to pay
for changes in environmental quality is:
log (PrWTP) = α + β1X1 + β2X2 + … + βmXm + βnA (1)
PrWTP is probabilitas WTP;
X1, X2, …, Xmis independent variables;
A is a certain amount on offer.
The average WTP was calculated using the formula:
The average WTP = α/β (2) Function of WTP is:
Y = f (X1, X2, X3, X4, X5, X6, X7, X8, X9, X10, X11) (3)
Explanation:
Y is willingness to pay increased water conservation management; X1 is income;
X2 is age;
X3 is education level;
X4 is home ownership;
X5 is number of family members;
X6 is environmental awareness;
X7 is sources of water used;
X8 is expected length of stay;
X9 is water quality;
X10 is planting of tree (filicium decipiens, pterocarpus indicus, caesalpinia pulcherrima, and ficus
benyamina);
X11 is making infiltration wells, biopori, and filtering tools.
Regression models for customer WTP increase in water quality management is:
log (PrY)= α + β1X1 + β2X2 + β3X3 + β4X4 + β5X5 + β6X6 + β7X7 + β8X8 + ε (4)
Result
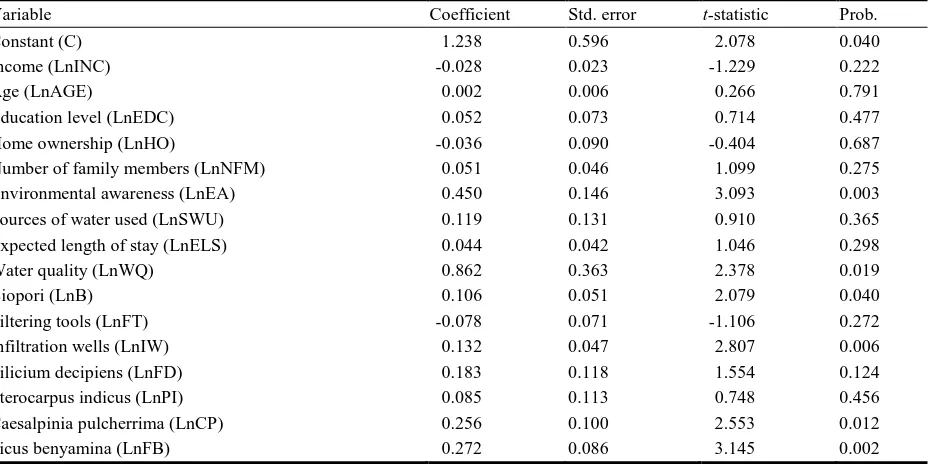
Variable regression model is the influences of family income, age of marriage, the family head education, home ownership, number of family members, environmental awareness, the source of water used, the expected
length of stay, water quality, biopori, filtering tools, infiltration wells, filicium decipiens, pterocarpus indicus, caesalpinia pulcherrima, and ficus benyamina toward the total WTP. Table 1 shows the results of regression analysis:
The model is:
LnWTP = 1.238 – 0.028LnINC + 0.002LnAGE + 0.052LnEDC – 0.036LnHO + 0.051LnNFM
+ 0.450LnEA + 0.119LnSWU + 0.044LnELS – 0.862LnWQ + 0.106LnB – 0.078LnFT + 0.132LnIW + 0.183LnFD + 0.085LnPI + 0.256LnCP + 0.272LnFB
(1) Income (INC)
The coefficient of income is -0.028. It means if the 1% increase of income in average, which will not have an impact on the increase of WTP.
(2) Age (AGE)
Tabel 1
The Result of Multiple Regression Analysis
Variable Coefficient Std. error t-statistic Prob.
Constant (C) 1.238 0.596 2.078 0.040
Income (LnINC) -0.028 0.023 -1.229 0.222
Age (LnAGE) 0.002 0.006 0.266 0.791
Education level (LnEDC) 0.052 0.073 0.714 0.477
Home ownership (LnHO) -0.036 0.090 -0.404 0.687
Number of family members (LnNFM) 0.051 0.046 1.099 0.275
Environmental awareness (LnEA) 0.450 0.146 3.093 0.003
Sources of water used (LnSWU) 0.119 0.131 0.910 0.365
Expected length of stay (LnELS) 0.044 0.042 1.046 0.298
Water quality (LnWQ) 0.862 0.363 2.378 0.019
Biopori (LnB) 0.106 0.051 2.079 0.040
Filtering tools (LnFT) -0.078 0.071 -1.106 0.272
Infiltration wells (LnIW) 0.132 0.047 2.807 0.006
Filicium decipiens (LnFD) 0.183 0.118 1.554 0.124
Pterocarpus indicus (LnPI) 0.085 0.113 0.748 0.456
Caesalpinia pulcherrima (LnCP) 0.256 0.100 2.553 0.012
Ficus benyamina (LnFB) 0.272 0.086 3.145 0.002
Note. Source: Data analysis, 2010.
(3) Education (EDC)
The coefficient of education is 0.052. It means if the 1% increase of education level in average, which will
not have an impact on the increase of WTP. (4) Home ownership (HO)
The coefficient of home ownership is -0.036. It means if the 1% increase of home ownership in average, which will not have an impact on the increase of WTP.
(5) Number of family members (NFM)
The coefficient of number of family members is 0.051. It means if the 1% increase of number of family members in average, which will not have an impact on the increase of WTP.
(6) Environmental awareness (EA)
The coefficient of environmental awareness is 0.450. It means if the 1% increase of environmental awareness in average, which will have an impact on the increase of WTP. The higher the environmental
awareness of customer PDAM for water resource availability is, the greater the WTP conservation of water resources is.
(7) Sources of water used (SWU)
The coefficient of sources of water used is 0.119. It means if the 1% increase of sources of water used in average, which will not have an impact on the increase of WTP.
(8) Expected length of stay (ELS)
The coefficient of expected length of stay is 0.044. It means if the 1% increase of expected length of stay
in average, which will not have an impact on the increase of WTP. (9) Water quality (WQ)
will have an impact on the increase of WTP. The better of the water quality of customer PDAM is, the growing WTP conservation of water resources in the city of Surakarta is.
(10)Biopori (B)
The coefficient of biopori is 0.106. It means if the 1% increase of biopori in average, which will have an
impact on the increase of WTP. The more holes making biopori especially in urban areas with a population and building houses, hotels, and malls is increasing, which will cause the vacant land less, then increasing the WTP conservation of water resources in the city of Surakarta.
(11) Filtering tools (FT)
The coefficient of filtering tools is -0.078. It means if the 1% increase of filtering tools in average, which
will not have an impact on the increase of WTP. (12) Infiltration wells (IW)
The coefficient of infiltration wells is 0.132. It means if the 1% increase of infiltration wells in average,
which will have an impact on the increase of WTP. The more wells that are made as infrastructure for the conservation of water resources is, the increasing willingness to pay (WTP) conservation of water resources in
the city of Surakarta is.
(13) Filicium decipiens (FD)
The coefficient of Filicium decipiens is 0.183. It means if the 1% increase of Filicium decipiens in average,
which will not have an impact on the increase of WTP. (14) Pterocarpus indicus (PI)
The coefficient of Pterocarpus indicus is 0.085. It means if the 1% increase of Pterocarpus indicus in average, which will not have an impact on the increase of WTP.
(15) Caesalpinia pulcherrima (CP)
The coefficient of Caesalpinia pulcherrima is 0.256. It means if the 1% increase of Caesalpinia pulcherrima in average, which will have an impact on the increase of WTP. Caesalpinia pulcherrima trees can
be accepted by customers PDAM in the city of Surakarta for urban greening as well as be able to absorb CO2
that could also enhance the aesthetic beauty of the city. (16) Ficus benyamina (FB)
The coefficient of Ficus benyamina is 0.272. It means if the 1% increase of Ficus benyamina in average, which will have an impact on the increase of WTP. Ficus benyamina trees can be accepted by customers
PDAM in the city of Surakarta for storing more water with stronger roots.
Discussion
Conservation of water resources in the city of Surakarta can be done through increasing environmental awareness by the public action on an ongoing basis, maintain the quality of ground water through management
of water resources as well. Making holes biopori increasingly disseminated infiltration in urban areas with the more narrow the amount of land, besides, the manufacture of wells to be an obligation to the people who will
build residential, hotel and other buildings. Caesalpinia pulcherrima trees required for planting absorb CO2 and
enhance the beauty of the city. Ficus benyamina trees planted are required by the river.
Conclusions
pulcherima tree in the city of Surakarta and ficus benyamina planted in the river.
The average amount of WTP for the group of households reached to Rp. 5,200 (USD 0.56) and trade
group of Rp. 21,000 (USD 2.31). Results of regression analysis showed that variable environmental awareness (EA), water quality (WQ), bipori (B), infiltration wells (IW), Caesalpinia pulcherima (CP) and Ficus
benyamina (FB) have a significant influence on WTP.
References
Brown, K. (2002). Innovations for conservation and development. The Geographical Journal, 168, 6-17.
Calderon, M. M., & Camacho, L. D. (2008). A water user fee for households in Metro Manila. Research Report. Philippines. Connelly, N. A., Brown, T. L., & Brow, J. W. (2007, August). Measuring the net economic value of recreational boating as water
level fluctuate. Journal of The American Water Resources Association, 43(4), 1016-1023. Freeze, R. A., & Cherry, J. A. (1979). Groundwater. Englewood Cliffs, N.J.: Prentice Hall.
Harahap, B. N., & Hartono, J. (2007). Analysis of pay and willingness factors affecting availability of drinking water and sanitation in Indonesia, hedonic price model applications and logistics model. Jakarta: FE-UI.
Hosking, S. G., & Preez, M. (2004, June). The valuation of water for conservation projects in South Africa. Journal of Development Southern Africa, 21(2), 385-398.
King, M. (2009) Valuation of ecosystem services. Retrieved July 10, 2009, from http://www.ecosystemvaluation.org Local Water Company. (2008). Business plan 2009-2013. Surakarta: PDAM office.
Loebis, R. F. (2006). Technology increases production capacity of water in small island. In Proceedings of the National Seminar on Management of Coastal Ecosystems of the Islands and Small Island States in the Context. Yogyakarta: Faculty of Geografi.
Muharram, R. (2010). Willingness to pay for service users and public transportation bus rapid transit (brt) corridor I in Surakarta: Application of contingent valuation method (Unpublished thesis, Sebelas Maret University, Surakarta).
Nam, O. K., & Son, T. V. H. (2008). Household demand for improved water services in Ho Chi Minh City: A comparison of contingent valuation and choice modeling estimates. Research Report, Vietnam.
Romeon, K. (2009). Community participation in urban water catchment area of space utilization in the city of ambon (Dissertation, UGM, Yogyakarta).