MULTIOBJECTIVES ANALYSIS OF WASTEWATER MANAGEMENT SYSTEM IN TAPIOCA STARCH INDUSTRY: CASE STUDY - CIAMIS DISTRICT, WEST JAVA
(Analisis Multiobyektif Sistem Pengelolaan Air Limbah Industri Tapioka: Studi Kasus Kabupaten Ciamis, Jawa Barat)
Mochammad Chaerul*dan Astried Sunaryani
Faculty of Civil and Environmental Engineering, Institut Teknologi Bandung Jl. Ganesha 10 Bandung 40132 Indonesia
*
Penulis korespondensi. Email: [email protected]
Diterima: 12 November 2013 Disetujui: 6 Februari 2014
Abstract
Ciamis district is one of the industrial centers of tapioca starch in West Java. Industry has been utilizing solid waste into by-products, fertilizers and animal feeds, but the wastewater which consist a lot of organic substances still discharged directly into the water that potentially cause water pollution. This study aims to determine the wastewater treatment system that can be applied in tapioca starch industry based on five scenarios proposed by using fuzzy goal programming approach. The first objective is the achievement of stream standard (DO-dissolved oxygen and BOD-biochemical oxygen demand) and wastewater quality standards. The second objective is to minimize the cost of wastewater treatment. Wastewater treatment system that proposed, consists of a primary, secondary and collective treatment that shared by some of the industries in one segment with 20% efficiency of BOD removal for primary, 60% for secondary and 85% for collective treatment. The results show that scenario five, which consists of primary, secondary and collective wastewater treatment is chosen for all industries by considering economic and environmental aspects. There was some improvement of water quality for theCijolangmiddle-stream segment with DO 7.35 mg/L and BOD 3.68 mg/L;Citanduymiddle-stream segment with DO 6.24 mg/L and BOD 2.37 mg/L, and also forCitanduy down-stream segment with DO 6.11 mg/L and BOD 5.52 mg/L. The fulfillment of BOD pollutant load limits obtained with achieving BOD concentration of 6.32 to 27.89 mg/L of each industry with total cost incurred is IDR 62,689 per day. Fuzzy goal programming approach provides a solution in achievement and as useful information for decision-makers to improve the quality of the environment, especially in the district of Ciamis.
Keywords: fuzzy goal programming, tapioca waste, waste water treatment, tapioca starch industry
Abstrak
Kabupaten Ciamis merupakan salah satu sentra industri tapioka di Jawa Barat. Industri tapioka menghasilkan limbah cair dan limbah padat. Pelaku industri sudah memanfaatkan limbah padat menjadi produk samping, pupuk dan makanan ternak, namun limbah cair belum diolah dengan baik dan masih dibuang langsung ke badan air yang berpotensi menimbulkan pencemaran air sungai. Penelitian ini mengkaji sistem pengolahan air limbah yang dapat diterapkan di industri tapioka berdasarkan atas lima skenario yang diusulkan melalui pendekatan fuzzy goal programming dengan sasaran untuk memenuhi baku mutu DO (dissolved oxygen) dan BOD (biochemical oxygen demand) air sungai, baku mutu limbah yang telah ditetapkan dan minimalisasi biaya pengolahan. Tiga sistem pengolahan air limbah terdiri atas pengolahan air limbah tingkat I, tingkat II dan pengolahan kolektif yang dipakai bersama dalam satu segmen sungai dengan efisiensi penyisihan BOD 20% untuk pengolahan tingkat I, 60% untuk tingkat II dan 85% untuk pengolahan kolektif. Dari hasil penelitian, skenario kelima yang merupakan rangkaian dari pengolahan primer, sekunder dan kolektif memberikan hasil yang paling baik dengan perbaikan kualitas perairan untuk segmen Sungai Cijolang tengah dengan DO 7,35 mg/L dan BOD 3,68 mg/L; untuk segmen Sungai Citanduy tengah dengan DO 6,24 mg/L dan BOD 2,37 mg/L; dan untuk segmen Sungai Citanduy Hilir dengan DO 6,11 mg/L dan BOD 5,52 mg/L. Pemenuhan batas beban pencemar BOD diperoleh dengan pencapaian konsentrasi BOD sebesar 6,32
–27,89 mg/L dari setiap industri. Dan biaya minimal yang dikeluarkan adalah sebesar Rp 62.689 per hari. Pendekatan fuzzy goal programming dapat memberikan suatu solusi dalam pencapaian sasaran dan merupakan sebuah informasi yang bermanfaat bagi pengambil keputusan untuk meningkatkan kualitas lingkungan khususnya di Kabupaten Ciamis.
Kata kunci: fuzzy goal programming, limbah tapioka, pengolahan air limbah, industri tapioka
INTRODUCTION
Ciamis District is one of the industrial centers of tapioca in West Java. Data obtained from
capacity of production up to 20 tons per day. According to BPLH in Ciamis, there were 11 units of tapioca industries that potentially caused water pollution in Cijolang river and Citanduy river.
The amount of tapioca industries causes environmental concerns. Tapioca industries require a lot of water in the production process, so a lot of tapioca industries located near a river. Not only to use water for processing, they also discharged wastewater into the river. Tapioca starch industry uses large amounts of water to wash cassava, starch extraction and washing equipment. One ton of cassava roots need about 5-11 m3 of water and wastewater as much as 40-60 m3will be produced during processing (Hirayama et al, 2011). Tapioca wastewater still contain 1.9 to 2.5 % of carbohydrate, glucose of 425-1850 mg/L and total nitrogen of 97-182 mg/L (Mol et al, 2007) and microbial load in tapioca wastewater consist of various species: Aspergillus, Penicillium, Monocillium and Humicola (Balagopalan et al, 2008). Organic substances undergo microbial conversion that causes unpleasant smell and lower dissolved oxygen content that can disrupt the balance of acuatic biota.
Tapioca starch industry also produced solid waste like peels, pulp and elot that mostly consist of fiber and nutrient. But the existence of solid waste is not a problem because it has been used by industry and society as a byproduct, fertilizer and animal feed. A solid waste fermentation process by Trichoderma pseudokoningii Rifai was developed for protein enrichment of cassava starch factory residues (Ray.et al, 2008).
To prevent pollution that caused by industrial waste, a good wastewater treatment system is needed. In the production of tapioca, waste has already existed in the production cycle. There is no technology that can produce zero waste yet. Therefore, a tapioca starch wastewater treatment is required in order to reduce environmental pollution. In this study, wastewater treatment system that can be applied in the tapioca starch industry based on five scenarios proposed, by using fuzzy goal programming approach which referred to the programming model for water quality management and water pollution caused by industrial waste streams that have been developed by Ciptomulyono (2007) and Sasikumar (2008). Functions goal will be approached by incorporating elements of fuzzy intended to handle the vagueness and imprecision in declaring objectivity targets to meet the watewater quality standards and minimize the cost of wastewater treatment. Wastewater treatment system that proposed consists of a primary and secondary wastewater treatment and also a collective wastewater treatment that shared by
some of the industry in one segment. The best scenario is choosen by considering economic and environmental aspects.
EXPERIMENTAL METHOD Location of Research
The study was conducted in eleven small-scale tapioca industries, according to data from BPLH Ciamis in 2011. Those industries were potentially polluting the three rivers in Ciamis, there are Ciolang river and Citanduy river. The 11th industries located in the four sub-districts, namely Panawangan, Cisaga, Pamarican and Banjarsari.
Data Collections
The data used consists of primary and secondary data. Primary data was observation data of production (raw material and water use, etc.), measurements data and interviewed with sources. While secondary data consists of data from BPLH Ciamis (for tapioca industries data, quality streams, discharge of pollutants, the analysis of BOD, COD, pH, TSS, cyanide), Department of Highways, Water Resources, Energy and Mineral Resources Ciamis (for stream characteristics data, discharge quantity, flow rate, flow time, temperature and demographic river map) and also some textbooks and previous research related to this study.
Problem Identification in the Production of Tapioca
The mass balance was analyzed in order to calculate the loss and some options that can be offered to reduce the losses seen from several criteria including identification of sources of waste, efficient use of energy resources, waste recycling and waste utilization.
Decision Variables
In the eco-friendly production plan strategies with the goal to achieve the quality of the environment, the basis for determining the decision variable are some alternatives of wastewater treatment system, the cost of processing variations and variations in industrial locations in the river segment with different characteristics. There are three kinds of wastewater treatment plant (WWTP) that are proposed:
- WWTP Level I (primary treatment) is a wastewater treatment system that is built individually on each industry.
- WWTP Level II (secondary treatment) is a further treatment system after primary treatment. - WWTP C (collective) is a wastewater treatment
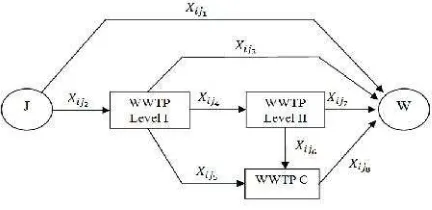
Figure 1 shows the decision variable of Xij which is defined as the amount of industrial pollutant from source j at zone i allocated to alternative treatment system k (k=1,2,..,8) before discharged to the water (W). The five scenarios that are proposed consist of: scenario 1= Xij1, scenario 2= Xij2-Xij3, scenario 3= Xij2-Xij4-Xij7, scenario 4= Xij2-Xij5-Xij8and scenario 5=Xij2-Xij4-Xij6-Xij8.
Goal and costraint functions that used in this study was a mathematic model that have been developed by Ciptomulyono (2007) and Sasikumar (2008) with the achievement of stream and effluent standard, and also the minimization of wastewater treatment cost.
Goal and Objective Functions The standard of DO
Referring to the main objective of environmental quality management, minimum DO value has to be considered at the first priority objective that may be expressed mathematically as Equation 1. Where ariis the oxygen reduction at the pointidue to the inclusion of industrial BOD, S1is the index of set decision variables,k= {1,3,7} that discharge the pollutant and effluent to the receiving point of stream directly, S2 is the index of set decision variables,k = {5,6} that discharge the pollutant to the collective treatment system,qiis the number of industries at the pointi, X is industrial BOD load, Ci
s
is the saturated DO concentration at the pointi, andδι is the correction factor for oxygen reduction.
The standard of BOD
This objective function aims to achieve quality standard BOD (biochemical oxygen demand), which became the industry burden that can be is the correction factor for BOD.
Total pollution load
If the rule established that the maximum BOD value in wastewater asρ(mg/L), and the discharge of wastewater effluent coming out of the total production asωij (m3/day) for industryjat pointi,
Figure 1.Structure of decision model then the threshold wastewater can be converted into units of weight of pollutant per unit time (kg/day). The equation can be written as Equation 3.
i
Minimize the cost of wastewater treatment
The economic objective of this model is only represented by the cost of treatment. This objective function aims to ensure that the treatment in each of the proposed system has the cheapest fare. Total cost equation can be formulated by Equation 4.
3 2
WhereS3is the index of set decision variablesk= {2,4} the alternatives of wastewater treatment level I and level II,ψijk is unit cost of treatment system of point sourcejin zoneiand relating to alternative treatment system stategyk(IDR/kg-BOD per day),
θiis unit cost of collective treatment system in zone ifor point source pollutant relating to alternativek (IDR/kg-BOD per day) andTot Cis the total cost of wastewater treatment specified for industry decision makers (IDR/day).
Constraint Functions
These constraints are important to assure that physical flows within the treatment system is balanced. The problem is that the system constraints on the proposed WWTP unit as an alternative wastewater treatment.
For constraint in WWTP level I stipulate that effluent from the primary treatment (WWTP level I) must equal to the amount of pollutant removed in secondary treatment (WWTP level II), disharged to the collective treatment system and to the receiving points, can be written mathematically as Equation 5, where ηijkp (%) is the removal efficiency of primary treatment of pollutant sourcejin zonei.
points and to be processed in the collective treatment system (WWTP C), can be expressed as Equation 6, whereηijks (%) is the removal efficiency of secondary treatment:
1 3
6 7 0s
ijk Xij Xij Xij
η
(6)
Running Model
When some goal and constraint functions have already determined, then the model can be implemented by using a linear programming software LINGO.
RESULTS AND DISCUSSION
Small-scale Tapioca Industries in Ciamis District
The main product produced by small-scale industries in Ciamis district was rough tapioca, and then it was sold to the sieve factory. There are six steps of process in tapioca production: peeling, washing, grating, extracting, precipitating, and drying.
Waste largely dominated by the liquid waste and then followed by solid waste. The solid waste comes from peeling and extraction process. Wastewater generated from the washing and precipitating process. The high content of organic matter in the wastewater starch can cause the
stream color changed to black, lowered oxygen levels, and cause the bad smell.
Waste Treatment
Mostly, every industry was observed discharged the tapioca waste directly into the environment. There are some industries that already had wastewater treatment ponds, but not used effectively. Table 1 shows the plan for tapioca waste treatment (Jia, 2007).
Implementation of good house-keeping is a better way of producing, monitoring the usage of water and monitoring of workers. To achieve that goal requires education, knowledge and awareness of the industry. Changes in input material with the replacement of raw materials that have a low quality of the cassava, in example low starch content, cassava with high amounts of mucus, not bright color, and high levels of HCN. Process control can be implemented by controlling the washing process, grating, extracting, drying periodically and also applying “first in first out” system in the storage process.
Technological changes and modifications can be implemented with the use of agobegan. There is a difference in the average yield generated by industries that use gobegan and the industry that does not usegobegan(manual). These are result in
Table 1.The plans for tapioca waste treatment
Factor Issue Benefit
Waste reduction at the source:
- Good housekeeping Water and material inefficiency, low quality materials,
Efficiency the use of water and prevent the loss of material, increase yield, reduce the formation of solid and liquid waste.
- Process change Conventional technology Recycling Lack of activities to
recycling/reuse of waste generated
Efficiency the use of water and reduce the formation of wastewater.
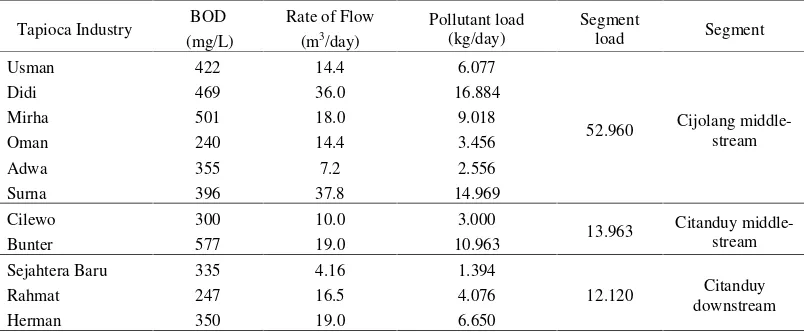
Table 2. Pollutant loads of tapioca industries (BPLH Ciamis, 2011)
Tapioca Industry BOD (mg/L)
Rate of Flow
(m3/day)
Pollutant load (kg/day)
Segment
load Segment
Usman 422 14.4 6.077
52.960 Cijolang middle-stream
Didi 469 36.0 16.884
Mirha 501 18.0 9.018
Oman 240 14.4 3.456
Adwa 355 7.2 2.556
Surna 396 37.8 14.969
Cilewo 300 10.0 3.000
13.963 Citanduy middle-stream
Bunter 577 19.0 10.963
Sejahtera Baru 335 4.16 1.394
12.120 Citanduy downstream
Rahmat 247 16.5 4.076
the difference in the average yield of 3.94%. The difference is used as the basis for the assumption that the use of gobegan can increase yield by 3.94%.
On the strategy of recycling and reuse, just like the use of white water repeatedly. Water released from several processes which are still considered for use again, such as the water from the washing process, first collect the water in the reservoirs (white water pit) which is then distributed to multiple processes that require water.
End of Pipe Methode for Tapioca Wastewater Treatment
Wastewater treatment are modeled by fuzzy goal programming for multiple objectives: to achieve the quality targets of DO and BOD water, to minimize the pollution load of BOD from each industry, to allocate a number of BOD load on the wastewater treatment based on the scenario, to achieve effluent standards for each industry and to minimize total cost of wastewater treatment.
Pollutant Loads
The pollutant loads from 11 tapioca industries in Ciamis shown in Table 2. Compared to the standard quality, SK-GubJabar-No.6-Year 1999 about the Quality of Tapioca Wastewater, maximum levels for BOD is 150 mg/L with a maximum of 30 m3 of wastewater flow per ton of product. Wastewater generated from all the tapioca industries does not comply with the quality standards for BOD. As for the waste flow rate is still below the quality standard, except for Didi and Surna.
Analysis of Model Output
WWTP Level I is a primary treatment that aims to eliminate suspended solids and abrasive material, performed by physical processes such as sedimentation tank with an efficiency of 20%. WWTP Level II is a secondary treatment consist of biological processes such as stabilization pond with the use of Effective Microorganism (Hanifah.et al, 2001) with an efficiency of 60% of BOD removal. WWTP C is a treatment system that used together in one segment. In this alternative, a constructed wetland was proposed as WWTP C with 85% efficiency (Meutiaet al, 2004).
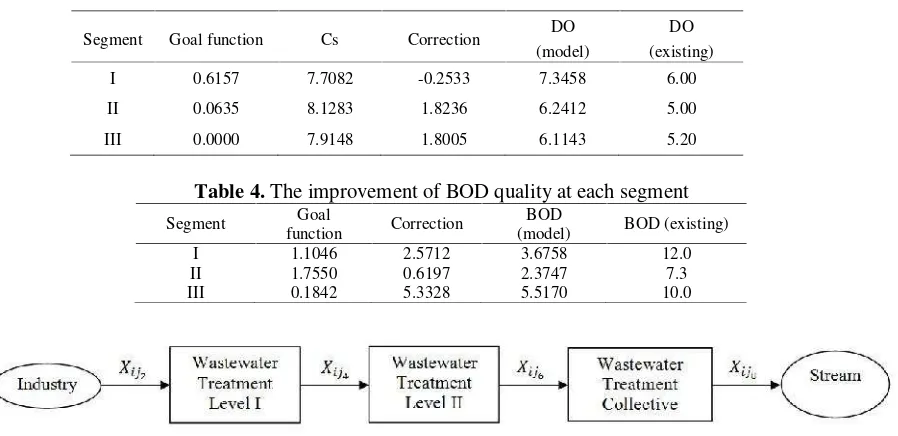
The river that used as a research object was kind of class III stream according to PP No. 82 Year 2001 on Water Quality and Water Pollution with DO standard 3 mg/L and BOD standard 6 mg/l. Wastewater allocation modeling shows a good results for both DO (Table 3) and BOD (Table 4).
Table 3 shows the result of wastewater treatment systems which has been proposed. There was improvement in the quality of water in each segment. Although when viewed from the DO concentration in the existing conditions (without any wastewater treatment), the value of DO is more than standards set by the government. Table 4 shows the results of model calculations with the function of goal is the fulfillment of BOD quality standards in river, which is below 6 mg/L. It can be seen that the lowest yield observed in segment II. This is because the number of industries in segment II has the lowest level of BOD concentration in existing condition so as to obtain optimum results until reaching 2.3747 mg/L.
Table 3.The improvement of DO quality at each segment
Segment Goal function Cs Correction DO
(model)
DO (existing)
I 0.6157 7.7082 -0.2533 7.3458 6.00
II 0.0635 8.1283 1.8236 6.2412 5.00
III 0.0000 7.9148 1.8005 6.1143 5.20
Table 4.The improvement of BOD quality at each segment
Segment Goal
function Correction
BOD
(model) BOD (existing)
I 1.1046 2.5712 3.6758 12.0
II 1.7550 0.6197 2.3747 7.3
III 0.1842 5.3328 5.5170 10.0
Table 5.The allocation of BOD loads
Tapioca industry
Allocation of BOD Load (kg/day)
X1 X2 X3 X4 X5 X6 X7 X8
Usman 6.08 4.86 1.95 0.29
Didi 16.88 13.50 5.40 0.81
Mirha 9.02 7.22 2.89 0.43
Oman 3.46 2.77 1.11 0.17
Adwa 2.56 2.05 0.82 0.12
Surna 14.97 11.98 4.79 0.72
Cilewo 3.00 2.40 0.96 0.14
Bunter 10.96 8.77 3.51 0.53
Sejahtera Baru 1.39 1.11 0.44 0.07
Rahmat 4.08 3.26 1.31 0.20
Herman 6.65 5.32 0.82 0.12
Table 6.BOD loads and BOD concentration after the treatment processing
Industry BOD Loads (kg/day) BOD Concentration (mg/L)
Upper Limits (kg/day)
Usman 0.29 20.14 2.16
Didi 0.81 22.50 5.40
Mirha 0.43 23.89 2.70
Oman 0.17 11.11 2.16
Adwa 0.12 16.67 1.08
Surna 0.72 19.05 5.67
Cilewo 0.14 14.00 1.50
Bunter 0.53 27.89 2.85
Sejahtera Baru 0.07 16.83 0.62
Rahmat 0.20 12.12 2.48
Herman 0.12 6.32 2.85
Table 7.Estimated cost for the optimum scenario
Industry
Unit Cost for WWTP Level I
(IDR/day)
Unit Cost for WWTP Level II
(IDR/day)
Unit Cost for WWTP Collective
(IDR/day)
Usman 1.628 6.189 8.582
Didi 1.442 4.977 7.722
Mirha 1.351 5.037 7.228
Oman 2.863 10.991 15.089
Adwa 1.970 6.418 10.201
Surna 1.705 6.341 9.145
Cilewo 2.292 8.881 12.071
Bunter 1.184 4.144 6.276
Sejahtera Baru 2.113 7.874 10.810
Rahmat 2.745 10.317 14.662
Herman 1.952 7.612 10.347
Table 5 shows the results obtained from the allocation of the BOD loads from each tapioca starch industry. The table shows that in order to fulfill all the functions of the proposed goal, all the industries have to treat their industrial wastewater in accordance with the scenario#5 (Figure 2) that includes all of the wastewater treatment system. Wastewater treatment level I with 20% efficiency of BOD removal and level II with 60% efficiency of BOD removal should be built individually. Whereas the collective wastewater reatment with
85% efficiency of BOD removal is built in every segment of the river.
When the optimal solution of the model has been obtained, all the tapioca starch industries has already reduce their BOD pollutant loads to meet the standard. Assuming a flow rate of waste is fixed, a concentration of BOD from the optimal solution was generated (Table 6).
revamp the existing level of quality for a variety of alternative waste treatment planned. For the assessment of the cost of waste treatment refers to Kaswinarni (2007) which is then converted to 2012 with interest rate of 5.75%.
The annual total cost is the total cost of investment and maintenance costs with the economic life of treatment plants is 15 years assumed. Unit cost to treat each of BOD loads (kg) was estimated assuming 1 year = 300 days of production. Unit cost of wastewater treatment is a result of the calculations for the total annual cost to the BOD loads (kg) emitted by the industry every day.
The estimated cost of all the wastewater treatment system is shown in Table 7. To improve water quality and compliance with industrial pollutant loads, the minimal cost was IDR 62,689.00 per day.
CONCLUSION
Eco friendly production in tapioca starch industry can be applied by the replacement of low quality raw materials, process control, and process modification by using gobegan tool, and reuse of water that obtained from washing process.
Fuzzy goal programming approach can be used as a model to allocate the tapioca wastewater treatment with the goal of achieving water quality standards that include DO and BOD concentrations of the stream, the effluent standard of BOD pollutant loads and minimizing the wastewater treatment costs. The results show some improvement of water quality for the Cijolang middle-stream segment with DO 7.35 mg/L and BOD 3.68 mg/L; Citanduy middle-stream segment with DO 6.24 mg/L and BOD 2.37 mg/L, and also for Citanduy downstream segment with DO 6.11 mg/l and BOD 5.52 mg/L. The fulfillment of BOD pollutant load limits obtained with achieving BOD concentration of 6.32 to 27.89 mg/L of each industry with total cost incurred was IDR 62,689 per day.
REFERENCES
Anonim, 1999, Keputusan Gubernur Kepala Daerah Tingkat I Jawa Barat Nomor: 6 Tahun 1999 tentang Baku Mutu Limbah Cair bagi Kegiatan Industri di Jawa Barat, Lampiran II.8: Baku Mutu Limbah Cair untuk Industri Tapioka, Bandung.
Anonim, 2001, Peraturan Pemerintah Republik Indonesia Nomor 82 Tahun 2001 tentang Pengelolaan Kualitas Air dan Pengendalian Pencemaran Air, Jakarta.
Anonim, 2011, Laporan Inventarisasi: Identifikasi Sumber-sumber Pencemaran Air Se-Kabupaten Ciamis, Badan Pengendalian Lingkungan Hidup Kabupaten Ciamis, Jawa Barat.
Balagopalan, C., Jyothi, A.N., and Nanda S.K., 2008, Cassava Waste Water Treatment and Residue Management in India, Indian Journal Environmental Science, 9 (1): 35-38. Ciptomulyono, U., 2007, A Development Model of
Fuzzy Goal Programming for Regional River Water Quality Management, Jurnal Purifikasi,8(2): 169-174.
Hanifah, A.A., Jose, C., and Nugroho, T., 2001, Pengolahan Limbah Cair Tapioka dengan Teknologi EM (Effective Microorganism), Jurnal Natur Indonesia, 3(2): 95-103.
Hirayama, K., Setyawati, R., Kaneko, H., and Hirayama, K., 2011, Current Tapioca Starch Wastewater MAnagement in Indonesia, World Appl. Sci. J., 14 (5): 658-665.
Jia, X. Zhang, T. Wang, F., and Han, F., 2007, Multi-objective Modelling and Optimization for Cleaner Production Process, J. Cleaner Prod.,14: 146-151.
Kaswinarni, F., 2007, Kajian Teknis Pengolahan Limbah Padat dan Cair Industri Tahu, Tesis, Program Studi Magister Ilmu Lingkungan, Universitas Diponegoro, Semarang.
Meutia, A.A., and Awalina, 2004, Kemampuan Lahan Basah Tropis Buatan Jenis Aliran Vertikal Bawah Permukaan dalam Mengolah Limbah Industri Tepung Tapioka, LIMNOTEK, 11(2): 57-64.
Mol, A.P.J, and Tran Thi My Dieu, 2007, Analysing and Governing Environmental Flows: The Case of Tra Co Tapioca Village, Vietnam,J. Life Sci., 53 (3/4), 301-317. Ray, C.R., Mahopatra, S., Panda, S., and Kar, S.,
2008, Solid Substrate Fermentation od Cassava Fibrous Residue for Production of -amylase, lactic acid and ethanol, J. Environ. Biol., 29 (1): 111-115.