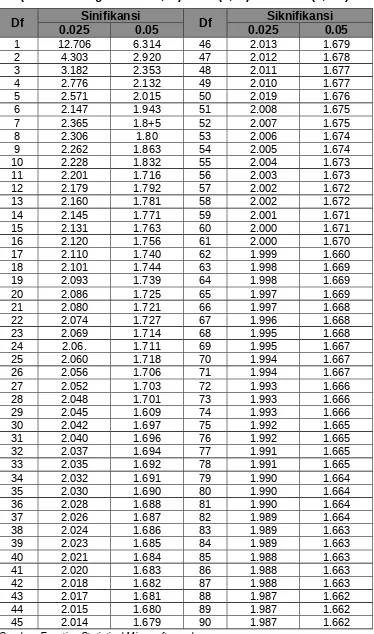
Tabel t
(Pada taraf signifikansi 0,05) 1 sisi (0,05) dan 2 sisi (0,025)
Df
Sinifikansi
Df
Siknifikansi
0.025
0.05
0.025
0.05
1 12.706 6.314 46 2.013 1.679
2 4.303 2.920 47 2.012 1.678
3 3.182 2.353 48 2.011 1.677
4 2.776 2.132 49 2.010 1.677
5 2.571 2.015 50 2.019 1.676
6 2.147 1.943 51 2.008 1.675
7 2.365 1.8+5 52 2.007 1.675
8 2.306 1.80 53 2.006 1.674
9 2.262 1.863 54 2.005 1.674
10 2.228 1.832 55 2.004 1.673
11 2.201 1.716 56 2.003 1.673
12 2.179 1.792 57 2.002 1.672
13 2.160 1.781 58 2.002 1.672
14 2.145 1.771 59 2.001 1.671
15 2.131 1.763 60 2.000 1.671
16 2.120 1.756 61 2.000 1.670
17 2.110 1.740 62 1.999 1.660
18 2.101 1.744 63 1.998 1.669
19 2.093 1.739 64 1.998 1.669
20 2.086 1.725 65 1.997 1.669
21 2.080 1.721 66 1.997 1.668
22 2.074 1.727 67 1.996 1.668
23 2.069 1.714 68 1.995 1.668
24 2.06. 1.711 69 1.995 1.667
25 2.060 1.718 70 1.994 1.667
26 2.056 1.706 71 1.994 1.667
27 2.052 1.703 72 1.993 1.666
28 2.048 1.701 73 1.993 1.666
29 2.045 1.609 74 1.993 1.666
30 2.042 1.697 75 1.992 1.665
31 2.040 1.696 76 1.992 1.665
32 2.037 1.694 77 1.991 1.665
33 2.035 1.692 78 1.991 1.665
34 2.032 1.691 79 1.990 1.664
35 2.030 1.690 80 1.990 1.664
36 2.028 1.688 81 1.990 1.664
37 2.026 1.687 82 1.989 1.664
38 2.024 1.686 83 1.989 1.663
39 2.023 1.685 84 1.989 1.663
40 2.021 1.684 85 1.988 1.663
41 2.020 1.683 86 1.988 1.663
42 2.018 1.682 87 1.988 1.663
43 2.017 1.681 88 1.987 1.662
44 2.015 1.680 89 1.987 1.662
45 2.014 1.679 90 1.987 1.662
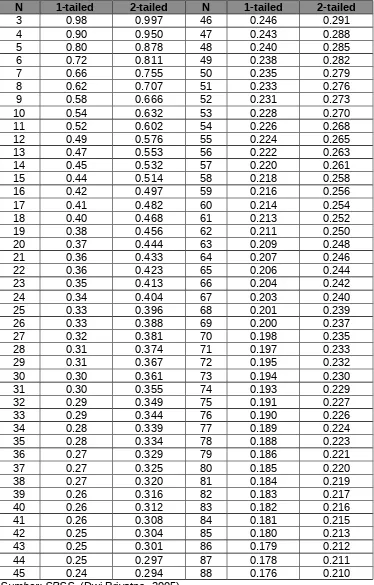
Tabel r
(Pearson Product Moment)
Uji 1 sisi dan 2 sisi pada taraf signifikansi 0,05
N 1-tailed 2-tailed N 1-tailed 2-tailed
3 0.98 0.997 46 0.246 0.291
4 0.90 0.950 47 0.243 0.288
5 0.80 0.878 48 0.240 0.285
6 0.72 0.811 49 0.238 0.282
7 0.66 0.755 50 0.235 0.279
8 0.62 0.707 51 0.233 0.276
9 0.58 0.666 52 0.231 0.273
10 0.54 0.632 53 0.228 0.270
11 0.52 0.602 54 0.226 0.268
12 0.49 0.576 55 0.224 0.265
13 0.47 0.553 56 0.222 0.263
14 0.45 0.532 57 0.220 0.261
15 0.44 0.514 58 0.218 0.258
16 0.42 0.497 59 0.216 0.256
17 0.41 0.482 60 0.214 0.254
18 0.40 0.468 61 0.213 0.252
19 0.38 0.456 62 0.211 0.250
20 0.37 0.444 63 0.209 0.248
21 0.36 0.433 64 0.207 0.246
22 0.36 0.423 65 0.206 0.244
23 0.35 0.413 66 0.204 0.242
24 0.34 0.404 67 0.203 0.240
25 0.33 0.396 68 0.201 0.239
26 0.33 0.388 69 0.200 0.237
27 0.32 0.381 70 0.198 0.235
28 0.31 0.374 71 0.197 0.233
29 0.31 0.367 72 0.195 0.232
30 0.30 0.361 73 0.194 0.230
31 0.30 0.355 74 0.193 0.229
32 0.29 0.349 75 0.191 0.227
33 0.29 0.344 76 0.190 0.226
34 0.28 0.339 77 0.189 0.224
35 0.28 0.334 78 0.188 0.223
36 0.27 0.329 79 0.186 0.221
37 0.27 0.325 80 0.185 0.220
38 0.27 0.320 81 0.184 0.219
39 0.26 0.316 82 0.183 0.217
40 0.26 0.312 83 0.182 0.216
41 0.26 0.308 84 0.181 0.215
42 0.25 0.304 85 0.180 0.213
43 0.25 0.301 86 0.179 0.212
44 0.25 0.297 87 0.178 0.211
45 0.24 0.294 88 0.176 0.210
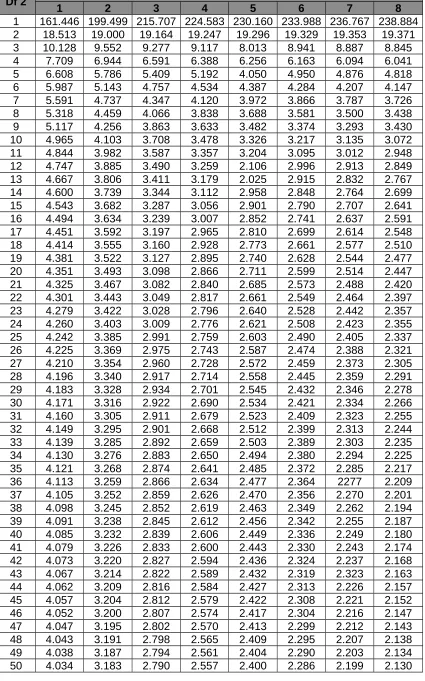
Tabel F
(Taraf signifikansi 0,05)
Df 2 1 2 3 4 Df1 5 6 7 8
51 4.030 3.179 2.786 2.553 2.397 2.283 2.195 2.126 52 4.027 3.175 2.783 2.550 2.393 2.279 2.192 2.122 53 4.023 3.172 2.779 2.546 2.389 2.275 2.188 2.119 54 4.020 3.168 2.776 2.543 2.386 2.272 2.185 2.115 55 4.016 3.165 2.773 2.540 2.383 2.269 2.181 2.112 56 4.013 3.162 2.769 2.537 2.380 2.266 2.178 2.109 57 4.010 3.159 2.766 2.534 2.377 2.263 2.175 2.106 58 4.007 3.156 2.764 2.531 2.374 2.260 2.172 2.103 59 4.004 3.153 2.761 2.528 2.371 2.257 2.169 2.100 60 4.001 3.150 2.758 2.525 2.368 2.254 2.167 2.097 61 3.998 3.148 2.755 2.523 2.366 2.251 2.164 2.094 62 3.996 3.145 2.753 2.520 2.363 2.249 2.161 2.092 63 3.993 3.143 2.751 2.518 2.361 2.246 2.159 2.089 64 3.991 3.140 2.748 2.515 2.358 2.244 2.156 2.087 65 3.989 3.138 2.746 2.513 2.356 2.242 2.154 2.084 66 3.986 3.136 2.744 2.511 2.354 2.239 2.152 2.082 67 3.984 3.134 2.742 2.509 2.352 2.237 2.150 2.080 68 3.982 3.132 2.739 2.507 2.350 2.235 2.148 2.078 69 3.980 3.130 2.737 2.505 2.348 2.233 2.145 2.076 70 3.978 3.128 2.736 2.503 2.346 2.231 2.143 2.074 71 3.976 3.126 2.734 2.501 2.344 2.229 2.142 2.072 72 3.974 3.124 2.732 2.499 2.342 2.227 2.140 2.070 73 3.972 3.122 2.730 2.497 2.340 2.226 2.138 2.068 74 3.970 3.120 2.728 2.495 2.338 2.224 2.136 2.066 75 3.968 3.119 2.727 2.494 2.337 2.222 2.134 2.064 76 3.967 3.117 2.725 2.492 2.335 2.220 2.133 2.063 77 3.965 3.115 2.723 2.490 2.333 2.219 2.131 2.061 78 3.963 3.114 2.722 2.489 2.332 2.217 2.129 2.059 79 3.962 3.112 2.720 2.487 2.330 2.216 2.128 2.058 80 3.960 3.111 2.719 2.486 2.329 2.214 2.126 2.056 81 3.959 3.109 2.717 2.484 2.327 2.213 2.125 2.055 82 3.957 3.108 2.716 2.483 2.326 2.211 2.123 2.053 83 3.956 3.107 2.715 2.482 2.324 2.210 2.122 2.052 84 3.955 3.105 2.713 2.480 2.323 2.209 2.121 2.051 85 3.953 3.101 2.712 2.470 2.322 2.207 2.119 2.049