Cohesion and Performance in Groups:
A Meta-Analytic Clarification of Construct Relations
Daniel J. Beal
Purdue UniversityRobin R. Cohen
Avon ProductsMichael J. Burke and Christy L. McLendon
Tulane UniversityPrevious meta-analytic examinations of group cohesion and performance have focused primarily on contextual factors. This study examined issues relevant to applied researchers by providing a more detailed analysis of the criterion domain. In addition, the authors reinvestigated the role of components of cohesion using more modern meta-analytic methods and in light of different types of performance criteria. The results of the authors’ meta-analyses revealed stronger correlations between cohesion and performance when performance was defined as behavior (as opposed to outcome), when it was assessed with efficiency measures (as opposed to effectiveness measures), and as patterns of team workflow became more intensive. In addition, and in contrast to B. Mullen and C. Copper’s (1994) meta-analysis, the 3 main components of cohesion were independently related to the various performance domains. Implications for organizations and future research on cohesion and performance are discussed.
Throughout the history of organizational research, an important goal has been to identify the factors and processes that give rise to increased group performance. In the pursuit of this goal, research-ers often have focused on the social and motivational forces that exist between group members. The theoretical and intuitive hy-pothesis has been that these forces create a bond, or cohesion, among the members of the group, and that the stronger the bond, the greater the productivity of the group. Presumably, when cohe-sion is strong, the group is motivated to perform well and is better able to coordinate activities for successful performance (Cart-wright, 1968; Davis, 1969). Although most researchers have ac-knowledged the plausibility of the relation between group cohe-sion and group performance, empirical observations of the relation have varied greatly, causing some authors to doubt the generaliz-ability of the effect (Stogdill, 1972; Tziner, 1982) or to dismiss it altogether (Steiner, 1972).
Contributing to the ambiguity of the cohesion–performance relation are a wide variety of conceptualizations for both
con-structs. A prominent confusion, for example, concerns the appro-priate level of analysis. Many researchers have measured group cohesion as individual perceptions of the group and related them to individual aspects of performance. It is not our position that such relations are insubstantial; however, because the construct of co-hesion refers to the resultant of forces acting on the group, it seems appropriate to conceptualize the constructs of interest at the group level. Indeed, Gully, Devine, and Whitney (1995) tackled this very issue and found that relations between cohesion and performance were stronger when both constructs were measured at the group level. Moreover, many researchers have noted that discrepancies between conceptual and operational levels of analysis can result in ambiguous and inaccurate findings (Klein, Dansereau, & Hall, 1994; Ostroff, 1993; Scullen, 1997). Therefore, our meta-analyses include only those studies that measured cohesion and perfor-mance at the group level.
Because of the apparent ambiguity in the relation between group cohesion and performance, several meta-analyses have attempted to highlight situations in which the effect is stronger or weaker (e.g., Carron, Colman, Wheeler, & Stevens, 2002; Evans & Dion, 1989; Gully et al., 1995; Mullen & Copper, 1994; Oliver, Harman, Hoover, Hayes, & Pandhi, 1999). These studies have succeeded in identifying several moderators of cohesion–performance relation-ships, including group size, group reality, level of analysis, and group interdependence.
One limitation of the previous cohesion–performance meta-analyses is a lack of clarity concerning the conceptual nature of the constructs. A primary purpose of the current meta-analysis was to evaluate what we mean when we say cohesion, what we mean when we sayperformance, and how these construct domains relate to each other. The question of what is meant by cohesion has indeed been addressed in one of the existing meta-analyses.
Daniel J. Beal, Military Family Research Institute, Purdue University; Robin R. Cohen, Avon Products, New York; Michael J. Burke, A. B. Freeman School of Business, Tulane University; Christy L. McLendon, Department of Psychology, Tulane University.
This work was partially supported by a Robert E. Flowerree Summer Research Fellowship. We thank Howard Weiss and Janice Kelly for their comments on drafts of this article, and Jenn Kaufman, Beth Deitch, Cathy Maraist, Kim O’Farrell, and Carmen Turillo for their assistance in acquir-ing and categorizacquir-ing studies. Portions of this article were presented at the 1st Annual Conference of the Society for Personality and Social Psychol-ogy, Nashville, Tennessee, February 2000.
Correspondence concerning this article should be addressed to Daniel J. Beal, Military Family Research Institute, Purdue University, 14 North 2nd Street, Suite 300, Lafayette, Indiana 47901. E-mail: [email protected]
Mullen and Copper (1994) examined the long-held notion that cohesion is composed of interpersonal attraction, group pride, and task commitment. They concluded that task commitment was significantly related to performance and that interpersonal attrac-tion and group pride were not independently related to perfor-mance. For several reasons, however, we believe that these con-clusions may have been unwarranted. Thus, one purpose of this meta-analysis is to reexamine the role of components of cohesion. In addition, we give consideration to an often neglected topic in research on cohesion and performance—the criterion domain. We have chosen to focus on these issues because a closer examination of predictor and criterion construct issues is essential for gaining a better understanding of cohesion–performance relationships. Fi-nally, we address the particular patterns of workflow within teams and how these patterns might affect cohesion–performance relations.
Thus, the purposes of this study are to (a) conceptually recon-sider the structure and content of criteria used within group cohe-sion studies, (b) meta-analytically test hypothesized cohecohe-sion–per- cohesion–per-formance relationships with respect to more refined criterion categories, (c) constructively reexamine the independent contribu-tions of interpersonal attraction, group pride, and task commitment in relation to criteria employed within group cohesion studies, and (d) examine the potential influence of workflow patterns on cohe-sion–performance relations. The remainder of the introduction unfolds as follows: First, we discuss issues concerning the struc-ture and content of criteria in group cohesion studies. Second, we discuss psychometric and statistical reasons for reconsidering Mullen and Copper’s (1994) conclusion regarding components of cohesion. Third, we describe more fully the workflow construct and explain why it might be relevant for research on cohesion and performance. Finally, we present the specific study hypotheses concerning the influence of each construct on existing cohesion– performance effects.
Cohesion and the Criterion Problem
One common feature of most of the moderators examined thus far in the cohesion–performance literature is the focus on the predictor side of the relation. This bias should come as no surprise to researchers in applied psychology; admonishments for an over-emphasis on the predictors of performance, as opposed to the performance domain itself, have appeared at regular intervals throughout the history of this discipline (Austin & Villanova, 1992; Flanagan, 1956; Smith, 1976). In essence, cohesion re-searchers have relegated performance or criteria used within group cohesion studies to nothing more than outcomes of group cohe-sion. To some extent, this fractured view of the criterion domain is understandable. That is, a particularly strong argument for the benefits of group cohesion could be made if the criterion domain were inclusive of all definitions and types of criteria. Unfortu-nately, as we have already noted, this result has not been the case. As such, we feel that the cohesion–performance literature has a definite need for a critical examination of the criterion domain. Toward this goal, our critique of the criterion domain in the cohesion literature focuses on two main areas: whether the crite-rion is conceived of as a behavior or an outcome and whether output criterion measures are adjusted for inputs.
Behavior Versus Outcome
Recent treatments of the criterion domain in the applied psy-chological literature have noted that traditional, global conceptu-alizations of performance are fraught with difficulties (e.g., see Campbell, McCloy, Oppler, & Sager, 1993). Appropriate specifi-cation of criteria in applied studies rarely is given consideration beyond tacit acknowledgment as the outcome variable. In the cohesion literature, if multiple criterion measures are used, the result typically is confusion that cohesion was related to one measure and not to another. Conclusions drawn from such research frequently cite the tenuous nature of the cohesion–performance relation as the cause of the mixed results (e.g., Keyton & Spring-ston, 1990), or the differential findings are overlooked (e.g., Co-hen, Whitmyre, & Funk, 1960; Deep, Bass, & Vaughan, 1967). For these reasons, we felt that using a more fine-grained approach for the criterion domain might shed some needed light on how vari-ables such as cohesion vary in their relation to different types of criteria.
In particular, Campbell and his colleagues (Campbell, 1990; Campbell et al., 1993) argued for a distinction between perfor-mance as behavior and perforperfor-mance as outcome. Put simply, performance is in the doing, not in the result of what has been done. The latter view of performance as outcome is fairly common in many areas of applied psychology, including the literature on cohesion and performance. As Campbell and others have pointed out, this latter view of performance does not take into consider-ation the many potential impediments to performance that are outside the control of the individual or group of individuals. For example, group sales outcomes might depend heavily on location, time of year, and economic conditions—none of which are indi-cators of a group’s ability to perform. Because of the possibility of such impeding factors, we hypothesized that cohesion would have a stronger relation to performance behaviors than performance outcomes.
Effectiveness Versus Efficiency
In addition to differentiating between behaviors and outcomes, we also wanted to examine how the consideration of inputs af-fected cohesion–performance relationships. When comparing groups, efficiency measures, which adjust for group inputs, often are more informative of performance than effectiveness measures, which only permit a comparison of group outputs (e.g., see Borucki & Burke, 1999; Wilderom, Glunk, & Maslowski, 2000). For example, if a retail organization with stores of many different sizes wanted to evaluate the performance of each store, overall effectiveness measures (e.g., gross sales) would not provide an accurate assessment of performance. A larger store most likely would rate higher simply because of its greater capacity to pro-duce. A smaller store, despite extremely efficient use of its re-sources, might never be able to reach the overall level of perfor-mance of the larger stores. Efficiency measures, which take inputs as well as outputs into account, might better reflect the true nature of store performance.
pos-ited that cohesion is an important variable linking group processes and group outcomes. Although the temporal placement of cohesion in this causal process is uncertain, researchers have found cohesive groups to have increased efficiency of language behavior (Mick-elson & Campbell, 1975), greater team mental model convergence (Mathieu, Heffner, Goodwin, Salas, & Cannon-Bowers, 2000), and greater use of transactive memory systems (Hollingshead, 1998, 2000; Wegner, Erber, & Raymond, 1991). In sum, cohesive groups should be able to use their groups’ resources more effi-ciently because they know the members of the group better and are motivated to complete the task successfully. Effectiveness mea-sures may be somewhat insensitive to this aspect of performance, but efficiency measures are designed to hone in on these sorts of processes. As such, we hypothesized that relations between cohe-sion and efficiency measures would be greater than relations between cohesion and effectiveness measures.
The particular reasons for expecting this pattern of cohesion– performance relations highlights another major purpose of this meta-analytic integration. Our arguments supporting moderating roles for behavior versus outcome and efficiency versus effective-ness are based on the assumption that interpersonal attraction, task commitment, and group pride are all important aspects of group cohesion. This view is at odds with a previous meta-analysis of the components of cohesion (Mullen & Copper, 1994). These au-thors examined several components of cohesion and concluded that task commitment (as opposed to interpersonal attraction and group pride) was the only component that independently contributed to the cohesion–performance relation. This finding was surprising, especially considering that most of the research on cohesion and performance has operationalized cohesion almost completely in terms of interpersonal attraction (Lott & Lott, 1965). After briefly reviewing some previous perspectives on the dimensionality of cohesiveness, we present three argu-ments suggesting that Mullen and Copper’s (1994) conclusions may have been premature.
Components of Cohesion and the Need to Reconsider
Mullen and Copper’s (1994) Conclusions
The recognition of cohesion as a multidimensional construct dates back to the seminal work of Festinger (1950). He discussed cohesion as a culmination of factors, such as attraction to the members of a group, the activities of a group, and the prestige of the group. Despite this early emphasis on acknowledging the components of cohesion, researchers often have measured only one aspect of the construct (e.g., Seashore, 1954) or have used an omnibus measure that cannot determine the independent contribu-tions of each component (e.g. Gowda, 1988). This fact is not to say, however, that the importance of components of cohesion has been completely ignored. In response to several articles lamenting the unidimensional approach to measuring cohesion (Carron, 1982; Mudrack, 1989; Tziner, 1982), numerous researchers have explored relations between its components and performance (Car-ron, Widmeyer, & Brawley, 1985; Zacarro & Lowe, 1986; Zacarro & McCoy, 1988).
Considering the original emphasis of components in the cohe-sion construct and the continued emphasis on this approach (Car-less & De Paola, 2000; Cota, Evans, Dion, Kilik, & Longman, 1995), Mullen and Copper’s (1994, p. 224) conclusion, “that
efforts to enhance group performance by fostering interpersonal attraction or ‘pumping up’ group pride are not likely to be effec-tive,” was somewhat surprising. Recent advances in meta-analytic methods, however, suggest several reasons why this conclusion needs to be reconsidered. Below, we discuss how issues related to levels of analysis, stochastically dependent effects, and the use of regression weights for determining the relative contributions of components of cohesion each contribute to uncertainty regarding Mullen and Copper’s conclusion.
Mixed Levels of Analysis
One interpretational difficulty concerning the results of Mullen and Copper’s (1994) meta-analysis is the inclusion of studies in the same distribution of effect sizes that measured the group cohesion and performance variables at an individual level, as well as studies that measured them at a group level. Gully et al. (1995) docu-mented how this practice can lead to an underestimation of the effect because the cohesion–performance relation is weaker at the individual level. Because individual-level studies were included in the component of cohesion moderator tests, the results are ambig-uous to some extent.
The problem of mixing levels of analysis is compounded if the effects are sample-size weighted, as is customary for distributional meta-analyses (Hunter & Schmidt, 1990). The primary issue in such meta-analyses is that effects measured at the individual level necessarily will be weighted more heavily than effects measured at a group level of analysis. For example, let us say that a study assessing the cohesion–performance relation was conducted, and measurements were taken both at the individual and group level of analysis. This hypothetical study used 25 groups with 5 people in each group. If both the individual-level and group-level correla-tions were later included in a meta-analysis, the effect obtained at the individual level of analysis, with an N ⫽ 125, would be weighted five times greater than the effect obtained at the group level of analysis, with anN⫽25. Thus, not only do individual-level assessments of group cohesion and performance suffer from conceptual ambiguity, the ambiguities are amplified when correct-ing for sample size.
Stochastically Dependent Effects
the cohesion–performance relation, thus rendering an overall more stable effect size estimate. This method of analysis, however, unduly weighted the importance of studies with multiple estimates. Multiple measurements of the same cohesion–performance rela-tion may make a more reliable estimate, but this stability is artificial because it does not take into account the nonindepen-dence of the data. We sought to include only stochastically inde-pendent effects within each of our effect size distributions in order to obtain a more accurate estimate of relations between compo-nents of cohesion and performance.
Inappropriate Regression Weighting
A final issue with Mullen and Copper’s (1994) analysis con-cerns the use of regression weights to examine the independent contribution of each component of cohesion in predicting perfor-mance. These regression weights were based on the relative pro-portion of items measuring a particular component of cohesion in a questionnaire.1Unfortunately, the number or proportion of items
measuring each component in a questionnaire cannot provide information concerning the independence of each component’s relation to performance. For example, a hypothetical cohesion– performance study examines 10 groups, each having rated cohe-siveness with a four-item scale. Three of the items assess task commitment, and one item assesses interpersonal attraction. In-cluded also is a single-item criterion measure of group perfor-mance. In this hypothetical study, the correlation between the interpersonal attraction item and performance was .80, and the correlation between the average task commitment score (i.e., the average of all three items) and performance was .20. The correla-tion between the overall average cohesion score (i.e., all four cohesion items) and performance was .35—an effect that is larger than most in the cohesion–performance literature. Clearly, the effect size of the overall scale is due to the one interpersonal attraction item. In Mullen and Copper’s analysis, however, this effect would have been attributed mostly to task commitment because the overall scale has three times as many task commitment items. This possibility clouds Mullen and Copper’s interpretation that the task commitment component of cohesion is the only independent predictor of performance.
In the current study, we circumvented this problem by including only independent estimates of each component’s effect in any particular meta-analytic distribution of effects. That is, if an effect size estimate included items assessing more than one component simultaneously, we did not include it in the analysis. This strategy may not have been possible at the time of Mullen and Copper’s (1994) meta-analysis because there were not sufficient numbers of studies to examine the effect size estimates separately. However, the substantial increase in the recent cohesion–performance liter-ature since Mullen and Copper’s work afforded us the luxury of such an analysis.
Patterns of Team Workflow
Throughout the history of organizational research on groups, one sentiment has been pervasive: task type matters. Whether researchers are concerned with leadership style (Weed, Mitchell, & Moffitt, 1976), group member status (Kirchler & Davis, 1986), group structure (Stewart & Barrick, 2000), or group cooperation
(Kabanoff & O’Brien, 1979), task type has attained an important role. As a result, many taxonomies of task type have been pro-posed, emphasizing a variety of specific characteristics (e.g., Hackman, 1968; Hackman & Morris, 1975; McGrath, 1984; Steiner, 1972). Although these taxonomies have been useful for many areas of group research, few have exhibited any relevance for group cohesion. It appears, however, that the interdependence of the task may be important. In particular, Gully et al. (1995) found task interdependence to moderate cohesion–performance relations at the group level.
In the current meta-analysis, we followed up on the finding by Gully et al. (1995) by examining how specific aspects of task interdependence might interact with group cohesion and perfor-mance. Specifically, we examined how the pattern of a team’s workflow can enhance the beneficial aspects of group cohesion. Thompson (1967) initially discussed the notion of internal inter-dependence at a more macro-organizational level. In this dis-cussion, he defined four forms of interdependence describing how different branches of an organization exchange informa-tion and work. Tesluk, Mathieu, Zaccaro, and Marks (1997) provided a similar taxonomy that described how work flows between members of a team. Because our interest was at the team or group level, we adopted the specifics of Tesluk et al.’s taxonomy.
Conceptually, differences in the exchange of work between members of a team can vary in several ways, including the direc-tion of workflow and the number of exchanges. For example, pooledworkflow involves tasks that aggregate individual perfor-mances to the group level. No interactions or exchanges between group members are required in this pattern of teamwork. Work does not flow through multiple members of the group, and per-formance simply is the sum or some other aggregation of the group members’ performances.Sequentialworkflow describes tasks that move from one member of the team to another but not in a back-and-forth manner. Group performance is not simply the pool-ing of each member’s performance but is a function of how the work progresses through each member of the group. For example, in an assembly line, each member of a group would be responsible for a particular portion of the final product. Line assembly, how-ever, implies that after one portion of the product is assembled, it is passed along to the next person until it reaches the end of the line. After the last person has completed his or her part, the product is complete. Thus, work flows sequentially from the first team member to the last team member.
The final two patterns of team workflow involve considerably more workflow between team members.Reciprocalworkflow is similar to sequential in that work flows only from one member to another, but the flow is now bidirectional; team members can exchange work with one another multiple times. The team perfor-mance, however, is accomplished when the last person in the group has completed his or her performance. Finally, intensive
1For a few studies, weights were assigned on the basis of the extent to
patterns of workflow occur when the work has the opportunity to flow between all members of the group, and the entire group must collaborate to accomplish the task.
As can be seen, both the directional changes and the amount of workflow between team members increases as the patterns progress from pooled to sequential to reciprocal to intensive. To the extent that group members exchange greater amounts of work between members, group processes such as cohesion should gain an important function in contributing to performance. In discussing this notion, Tesluk et al. (1997) recommended a variety of human resource programs to improve productivity for each pattern of team workflow. As the amount of between-member workflow increased, these authors recommended a greater emphasis on team-level (as opposed to individual-team-level) programs. Consistent with these observations, we expected cohesion to bear stronger relations to performance as the level of team workflow increased from pooled through intensive. That is, factors such as attraction to group members, a shared commitment to the task, and a sense of pride in belonging to the group should have a greater impact on performance as the workflow between members increases in each pattern of teamwork.
Summary
Our goals for the current meta-analytic integration of cohesion– performance relations were (a) to gain a more complete under-standing of cohesion–performance relations with respect to differ-ent types of criteria employed in group cohesion studies, (b) to constructively reexamine the independent contributions of inter-personal attraction, group pride, and task commitment in relation to performance, and (c) to identify what particular patterns of workflow would have benefits or detriments for the link between cohesion and performance. Our specific hypotheses regarding per-formance criteria were that cohesion–perper-formance relations would be stronger when performance is conceptualized and measured as a behavior as opposed to an outcome, and measures of perfor-mance efficiency would have a stronger relation to cohesion than measures of performance effectiveness. We further hypothesized that all three components of cohesion would bear significant independent relations to performance criteria. Finally, we hypoth-esized that patterns of team workflow would moderate the cohe-sion–performance relation such that greater amounts of workflow would be associated with stronger correlations.
Method
Literature Search
Several different approaches were used in locating relevant articles. First, attempts were made to retrieve as many articles as possible from the reference sections of Mullen and Copper (1994) and Gully et al. (1995). Second, we conducted computer searches of the PsycINFO and Sociofile databases using the search terms cohesion, cohesiveness, interpersonal attraction,group attraction,task commitment,task attraction, orgroup pride. This search then was combined with a search for productivity, performance,effectiveness,orefficiency. In addition, reference sections of the final articles were scanned for any citation that might contain an estimate of the cohesion–performance relation. Finally, requests for un-published studies were made of several experts in the field of group
research, as well as the electronic mailing list for the Society for Person-ality and Social Psychology. This overall search returned several hundred possible articles, which then were narrowed down to 145 after discarding clearly irrelevant or unobtainable studies.
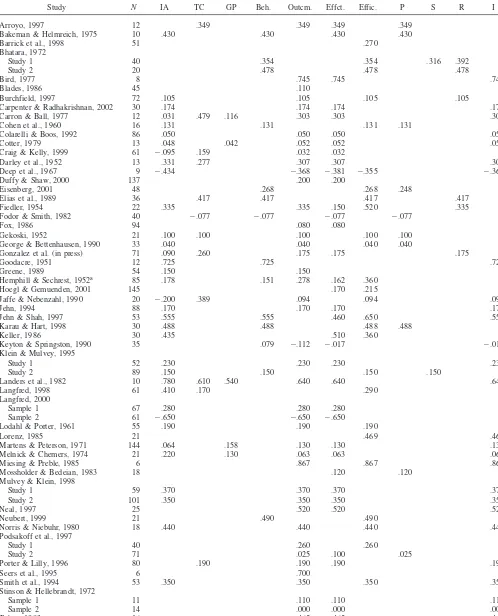
The articles then were examined individually for inclusion in the final analyses. Fifty studies were removed because (a) only multivariate or partialed effect size estimates were available, (b) the performance variable was a self- or within-group rating (see Gully et al., 1995), or (c) the operationalization of cohesion or performance did not conform to our definitions (see below). This process left 64 separate articles with 71 independent estimates and 186 total estimates of cohesion–performance relations. Of these 64 separate articles, 11 were unpublished articles or dissertations. Publication dates ranged from 1951 to 2002, with a median year of publication of 1989 (SD⫽14.03). Sample sizes for the studies averaged 45.30 (SD⫽33.93), and group sizes averaged 6.22 (SD⫽3.66). Articles used in the meta-analysis are listed along with their uncorrected correlations in Table 1.
In comparison to the two largest of the previous broad meta-analyses, Gully et al. (1995) obtained 51 independent effect size estimates and Mullen and Copper (1994) obtained 52 independent effect size estimates. Note, however, that both of these meta-analyses included group- and individual-level effects. When considering only the group-level effects, Gully et al. contained only 35 independent effects and Mullen and Copper only 39 independent effects. Of these two meta-analyses, we included 29 of Mullen and Copper’s 39 effects (74%) and 25 of Gully et al.’s 35 effects (71%). There were several reasons why the overlap was not 100%: Some effects were multivariate (i.e., included variables other than cohesion in the same analysis), some were self-reports of performance, one study was unobtainable, and the dubious quality of one study removed it from consideration in our analysis. Given these considerations, the overlap with previous meta-analytic samples seemed high. In addition, the current meta-analysis contained approximately 85% more group-level studies than the largest previous effort, which is a substantial increase.
Coding of Study Characteristics
Perhaps one of the largest sources of error in meta-analyses is the multitude of judgment calls made at various stages of the research synthe-sis process (Wanous, Sullivan, & Malinak, 1989). For example, Mullen and Copper’s (1994) definition and subsequent coding of group interaction led them to conclude that the level of interactivity does not moderate the cohesion–performance relation. Gully et al. (1995), however, defined in-teraction differently (actually termed interdependence) and found that highly interactive groups exhibited a stronger cohesion–performance rela-tion at the group-level of analysis. It is likely that the use of a different operational definition of group interaction is at least partly responsible for the discrepant conclusions. An important early step, therefore, was to arrive at thorough operational definitions for every relevant variable (Cooper, 1998). Provided here is a list of each variable along with how it was operationally defined. In addition, we have included examples of each variable in Appendix A.
Performance as Behavior
Table 1
Sample Sizes and Observed (Uncorrected) Correlations From Each Study and for Each Variable of Interest
Study N IA TC GP Beh. Outcm. Effct. Effic. P S R I
Arroyo, 1997 12 .349 .349 .349 .349
Bakeman & Helmreich, 1975 10 .430 .430 .430 .430
Barrick et al., 1998 51 .270
Bhatara, 1972
Study 1 40 .354 .354 .316 .392
Study 2 20 .478 .478 .478
Bird, 1977 8 .745 .745 .745
Blades, 1986 45 .110
Burchfield, 1997 72 .105 .105 .105 .105
Carpenter & Radhakrishnan, 2002 30 .174 .174 .174 .174
Carron & Ball, 1977 12 .031 .479 .116 .303 .303 .303
Cohen et al., 1960 16 .131 .131 .131 .131
Colarelli & Boos, 1992 86 .050 .050 .050 .050
Cotter, 1979 13 .048 .042 .052 .052 .052
Craig & Kelly, 1999 61 ⫺.095 .159 .032 .032
Darley et al., 1952 13 .331 .277 .307 .307 .307
Deep et al., 1967 9 ⫺.434 ⫺.368 ⫺.381 ⫺.355 ⫺.368
Duffy & Shaw, 2000 137 .200 .200
Eisenberg, 2001 48 .268 .268 .248
Elias et al., 1989 36 .417 .417 .417 .417
Fiedler, 1954 22 .335 .335 .150 .520 .335
Fodor & Smith, 1982 40 ⫺.077 ⫺.077 ⫺.077 ⫺.077
Fox, 1986 94 .080 .080
Gekoski, 1952 21 .100 .100 .100 .100 .100
George & Bettenhausen, 1990 33 .040 .040 .040 .040
Gonzalez et al. (in press) 71 .090 .260 .175 .175 .175
Goodacre, 1951 12 .725 .725 .725
Greene, 1989 54 .150 .150
Hemphill & Sechrest, 1952a 85 .178 .151 .278 .162 .360
Hoegl & Gemuenden, 2001 145 .170 .215
Jaffe & Nebenzahl, 1990 20 ⫺.200 .389 .094 .094 .094
Jehn, 1994 88 .170 .170 .170 .170
Jehn & Shah, 1997 53 .555 .555 .460 .650 .555
Karau & Hart, 1998 30 .488 .488 .488 .488
Keller, 1986 30 .435 .510 .360
Keyton & Springston, 1990 35 .079 ⫺.112 ⫺.017 ⫺.017
Klein & Mulvey, 1995
Study 1 52 .230 .230 .230 .230
Study 2 89 .150 .150 .150 .150
Landers et al., 1982 10 .780 .610 .540 .640 .640 .640
Langfred, 1998 61 .410 .170 .290
Langfred, 2000
Sample 1 67 .280 .280 .280
Sample 2 61 ⫺.650 ⫺.650 ⫺.650
Lodahl & Porter, 1961 55 .190 .190 .190
Lorenz, 1985 21 .469 .469
Martens & Peterson, 1971 144 .064 .158 .130 .130 .130
Melnick & Chemers, 1974 21 .220 .130 .063 .063 .063
Miesing & Preble, 1985 6 .867 .867 .867
Mossholder & Bedeian, 1983 18 .120 .120
Mulvey & Klein, 1998
Study 1 59 .370 .370 .370 .370
Study 2 101 .350 .350 .350 .350
Neal, 1997 25 .520 .520 .520
Neubert, 1999 21 .490 .490
Norris & Niebuhr, 1980 18 .440 .440 .440 .440
Podsakoff et al., 1997
Study 1 40 .260 .260
Study 2 71 .025 .100 .025
Porter & Lilly, 1996 80 .190 .190 .190 .190
Seers et al., 1995 6 .700
Smith et al., 1994 53 .350 .350 .350 .350
Stinson & Hellebrandt, 1972
Sample 1 11 .110 .110 .110
Sample 2 14 .000 .000 .000
(i.e., “ ‘solutions,’ ‘statements,’ or ‘answers’ produced as a result of covert cognitive behavior and totally under the control of the individual” p. 40).2
Performance as Outcome
Criteria were categorized as performance outcomes if they represented the consequences or results of performance behaviors.
Measures of Effectiveness
Performance effectiveness was defined as an evaluation of the results of performance with no consideration of the costs of achieving the results.
Measures of Efficiency
Performance efficiency was defined as the effectiveness of a group with some consideration of the cost of achieving that level of effectiveness, that is, a ratio or factoring in of inputs relative to outputs. If a measure took inputs into account in any way, then it was considered an efficiency measure. We interpreted inputs in a broad manner, including time, effort, and other resources expended, as well as number of errors made and relative size of the group (if size offered performance benefits). Because time is always involved in performance, we considered time as an input if it was explicitly mentioned as part of the task (e.g., participants had 15 min to come up with solutions, workers were stopped after 12 min, and so forth).
Team Workflow
Our definitions for teamwork patterns follow directly from Tesluk et al. (1997, p. 201).
Pooled. Work and activities are performed separately by all team members, and work does not flow between members of the team.
Sequential. Work and activities flow from one member to another in the team but mostly in one direction.
Reciprocal. Work and activities flow between team members in a back-and-forth manner, but only a single team member is worked with at a given moment in time.
Intensive. Work and activities come into the team, and members must collaborate as a team in order to accomplish the team’s task.
Cohesion
Variables were considered to measure cohesion if they fell into one of the following component categories:
Interpersonal attraction. A shared liking for or attachment to the members of the group.
Task commitment. The extent to which the task allows the group to attain important goals or the extent to which a shared commitment to the group’s task exists.
Group pride. The extent to which group members exhibit liking for the status or the ideologies that the group supports or represents, or the shared importance of being a member of the group.
Beyond the categorizations described above, there were several other judgment calls that needed to be made. Frequently, there were multiple estimates of the cohesion–performance relation, even within a particular category (e.g., three reported correlations between interpersonal attraction and effectiveness for one particular task). In general, one overall estimate was obtained with a sample-weighted average. However, if the correlations were computed at different time periods in the group’s development, the correlation between the latest occurring measurements of cohesion and performance was assumed to be the best estimate. Our reasoning for using the most recent cohesion–performance correlation concerns the nature of the construct of cohesion. Cohesion is not something that occurs immedi-ately on a group’s formation. It develops after the group has had an opportunity to work together or at least become acquainted with each other (Gosenpud, 1989; Harrison, Price, & Bell, 1998; Matheson, Mathes, & Murray, 1996). Therefore, we felt that the effects of cohesion on group performance would most likely emerge later in the group’s existence as compared with earlier.
In addition, there was a question of whether a questionnaire mostly measured one particular component over others. Because we wished to examine the independent effects of different components of cohesion on performance, some effects could not be coded for the particular type of cohesion. For example, if a questionnaire mostly contained items measur-ing interpersonal attraction but also had one or two items measurmeasur-ing task commitment, the effect was not coded for component of cohesion. This
2Group decision-making tasks represent a source of possible confusion
with our definitions. In several cases, the group decision-making process was unobservable to the person who judged the performance (i.e., only the end result was judged, not the process). Despite being “unobservable” we coded these situations as outcomes. Our reasoning was that many observ-able behaviors occurred in the context of the performance and the unob-servable element had little to do with cognitive processes that could not be measured. Therefore, this type of performance could not fall under the “unobservable cognitive behaviors” portion of our performance behavior definition. If, however, aspects of the decision-making process were in-cluded as measures of performance, we coded these elements as behaviors.
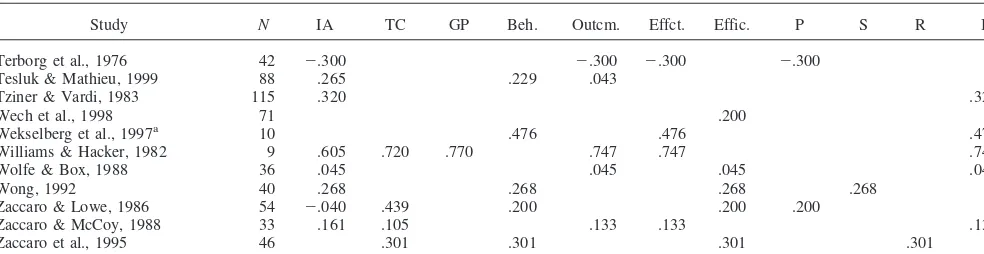
Table 1 (continued)
Study N IA TC GP Beh. Outcm. Effct. Effic. P S R I
Terborg et al., 1976 42 ⫺.300 ⫺.300 ⫺.300 ⫺.300
Tesluk & Mathieu, 1999 88 .265 .229 .043
Tziner & Vardi, 1983 115 .320 .320
Wech et al., 1998 71 .200
Wekselberg et al., 1997a 10 .476 .476 .476
Williams & Hacker, 1982 9 .605 .720 .770 .747 .747 .747
Wolfe & Box, 1988 36 .045 .045 .045 .045
Wong, 1992 40 .268 .268 .268 .268
Zaccaro & Lowe, 1986 54 ⫺.040 .439 .200 .200 .200
Zaccaro & McCoy, 1988 33 .161 .105 .133 .133 .133
Zaccaro et al., 1995 46 .301 .301 .301 .301
Note. IA⫽interpersonal attraction; TC⫽task commitment; GP⫽group pride; Beh.⫽performance as behavior; Outcm.⫽performance as outcome; Effct.⫽effectiveness criteria; Effic.⫽efficiency criteria; P⫽pooled workflow; S⫽sequential workflow; R⫽reciprocal workflow; I⫽intensive workflow.
ensured that the effects of the other components did not contaminate assessments of a particular component of cohesion.3
Data Analysis Procedure
Tests of the hypotheses were conducted using Raju, Burke, Normand, and Langlois’ (RBNL, 1991; Finkelstein, Burke, & Raju, 1995) meta-analytic procedures, with a random effects model (cf. Raju & Drasgow, 2003). The RBNL procedure uses sample statistics including available information on sample-based artifacts (i.e., predictor and criterion reliabili-ties) to estimate individually corrected effects with standard errors for these corrected effects. Subsequently, this meta-analytic procedure computes sample-size weighted estimates of the mean and variance of corrected effects. In contrast, most other meta-analytic procedures (cf. Hunter & Schmidt, 1990) rely on distributions of hypothetical artifact values (as discussed in more detail in Paese & Switzer, 1988, and Raju, Pappas, & Williams, 1989) for estimating the mean and variance of corrected effects. It is noteworthy that the RBNL meta-analytic procedure permits the con-struction of a confidence interval around the estimated mean corrected effect (cf. Finkelstein et al., 1995). To use the RBNL procedure, all study effect sizes were first converted to Pearson correlations. These correlations were then corrected for sampling error, as well as unreliability, in the predictor and criterion measures. In instances in which a study did not report reliability information, the average reliability from available studies was substituted for the missing values.
Our first step was to constructively replicate the meta-analysis by Mullen and Copper (1994). This was done primarily to ensure that poten-tially differing results concerning components of cohesion were not due solely to differences in the particular studies included. To accomplish this, we analyzed separately the set of studies that overlapped with Mullen and Copper. After obtaining high levels of agreement, we proceeded to code the remaining studies (see Appendix A for indices of interrater agreement). The first author coded the variables for each study, and the fourth author cross-coded all variables for each study. Where there were disagreements, the two coders reached agreement through discussion. This double coding procedure and the checks on interrater agreement for the coding of key study characteristics are consistent with recent recommendations for cod-ing studies in meta-analyses (see Burke & Landis, 2003). We note here that the pattern of results obtained for the Mullen and Copper replication did not differ substantially from the results of the final set of studies. There-fore, the reported results reflect our complete set of studies.
Results
Overview of Analyses
To examine our hypotheses, we focused on three main criteria: mean corrected correlation (Mˆ), estimatedSEofMˆ, and
confi-dence intervals aroundMˆ. We chose to focus on corrected
coef-ficients because we were primarily interested in estimated relations between well-developed, highly reliable measures of cohesion and performance. Note that we interpreted our findings using confi-dence intervals as opposed to credibility intervals. Conficonfi-dence intervals reflect the accuracy of the mean coefficient through the use of the standard error of the corrected mean correlation (Finkel-stein et al., 1995), whereas credibility intervals estimate the gen-eralizability of the effect through the use of the standard deviation of the observed or corrected correlations (Schmidt & Hunter, 1977; Whitener, 1990).
We have not reported tests of generalizability for several rea-sons. First, we were not concerned with the “portability” of the effect. Previous meta-analyses have demonstrated significant het-erogeneity in the cohesion–performance relation (Gully et al.,
1995; Mullen & Copper, 1994). As discussed earlier, several moderating variables already have been identified, mostly con-cerning the predictor side of the relation. Our goal was to examine constructs that produce different mean correlations based on the-oretical differences. Therefore, we examined corrected mean co-efficients and the extent to which their confidence intervals over-lap. A second reason why generalizability tests, such as the credibility interval, were not used is because of their notoriously inaccurate Type I error rates (Cornwell, 1993; Koslowsky & Sagie, 1993; Sackett, Harris, & Orr, 1986; Spector & Levine, 1987).
We first present results concerning different types of criteria including behavior versus outcome and effectiveness versus effi-ciency. Following this, we address the independent contributions of interpersonal attraction, group pride, and task commitment in predicting performance. We then examine, where possible, the interactions between components of cohesion and the various types of criteria. Finally, we address the moderating effects of team workflow.
Different Types of Criteria
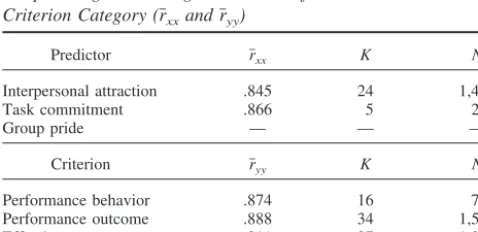
Table 2 presents summary information for each construct of interest. Table 3 presents average reliabilities for each predictor and criterion category where available. Below we consider the results for each of these variables in more depth.
Behavior Versus Outcome
We considered performance behaviors to be more closely linked to the process of cohesion than performance outcomes, which often are determined by factors unrelated to the efforts of the group. Therefore, we predicted that cohesion–performance rela-tions, on average, would be stronger when performance was op-erationalized as behavior than when performance was operation-alized as an outcome. In support of this hypothesis, the mean corrected correlation was greater for performance behaviors (Mˆ⫽
.301) than for performance outcomes (Mˆ ⫽.168). Note that the
confidence interval around the cohesion– behavior correlation does not include the cohesion– outcome correlation and vice versa. Indeed, these correlations were significantly different from each other (Z⫽2.573,p⬍.05). Also of note in this analysis is that the confidence intervals of these correlations did not include zero. Thus, cohesion is related to both conceptualizations of perfor-mance but accounts for more variability in perforperfor-mance behavior.
3Although our meta-analytic estimates have eliminated stochastically
Effectiveness Versus Efficiency
We also posited that measures of performance efficiency would be particularly adept at capturing the process benefits of group cohesion. In contrast, measures of performance effectiveness, which only take outputs into account, should be less able to exhibit the beneficial effects of a cohesive group. In line with this hypoth-esis, efficiency measures (Mˆ⫽.310) possessed a stronger
aver-age correlation than did effectiveness measures (Mˆ ⫽ .175).
These mean coefficients fell outside of the opposing correlation’s confidence intervals and were significantly different from each other (Z⫽ 2.787,p ⬍.05). Much like the results for behavior versus outcome, note that both confidence intervals were above zero; efficiency measures better reflected the benefits of cohesion, but cohesive groups also were more effective.
Components of Cohesion
Most importantly for the analysis of components of cohesion, all three mean correlations were significantly greater than zero. There were differences in the magnitude between the mean effects for each component of cohesion, but none of the mean corrected effects were significantly different from each other (allZs⬍1.30, ps⬎ .18). The ascending order of effect sizes was interpersonal attraction (Mˆ ⫽.199), group pride (Mˆ ⫽ .261), and task
com-mitment (Mˆ ⫽.278). Thus, in contrast to the findings of Mullen
and Copper (1994), our analysis indicates that the three compo-nents of cohesion each correlate meaningfully with performance criteria. Also of interest is that group pride, despite being the most frequently ignored component of cohesion and having only six effect size estimates, had an average correlation that was signifi-cantly greater than zero and as strong as the other components.
Interactions Between Components of Cohesion and Types
of Criteria
Although there were too few studies to break down each com-ponent of cohesion with each category of criteria, several analyses were possible. Interpersonal attraction had, by far, the largest number of studies, and we were able to examine how this com-ponent related to behavior versus outcome, as well as to effective-ness versus efficiency. Task commitment, although having sub-stantially fewer effects than interpersonal attraction, still allowed for tests of behavior versus outcome and effectiveness versus efficiency. The handful of group pride effects, however, all used criteria of effectiveness (i.e., no measures of efficiency) and out-come (i.e., no measures of performance behavior).
Interpersonal attraction displayed a pattern similar to the overall findings for behavior versus outcome. Specifically, the interper-sonal attraction– outcome relation (Mˆ ⫽ .139) was significantly
smaller than the interpersonal attraction– behavior relation (Mˆ⫽
Table 2
Mean Uncorrected Correlations (r), Mean Corrected Correlations (Mˆ), Variances ofˆ (ˆ 2
), Standard Errors of the Mean ofˆ (SEMˆ), 95% Confidence Intervals (CI), Number of Effect Sizes (K), and Number of Groups (N) for Criterion and Component Moderators
Moderator r Mˆ ˆ 2 SE
Mˆ 95% CI K N
Performance
Behavior .267 .301 .008 .041 .220, .383 19 778
Outcome .147 .168 .037 .036 .096, .239 47 2,125
Measure
Effectiveness .155 .175 .045 .041 .095, .256 40 1,899
Efficiency .272 .310 .006 .031 .249, .370 31 1,337
Component of cohesion
Interpersonal attraction (IA) .171 .199 .052 .042 .117, .281 43 2,049
Behavior .279 .315 .028 .069 .179, .451 10 482
Outcome .124 .139 .053 .050 .041, .237 31 1,446
Effectiveness .132 .148 .074 .062 .026, .270 25 1,187
Efficiency .240 .284 .032 .055 .176, .393 19 792
Task commitment (TC) .246 .278 .000 .043 .194, .361 16 579
Behavior .281 .302 .026 .074 .156, .448 4 176
Outcome .242 .273 .000 .055 .166, .381 11 342
Effectiveness .205 .232 .002 .055 .124, .340 10 341
Efficiency .306 .343 .000 .068 .210, .475 6 238
Group pride .242 .261 .000 .065 .133, .389 6 209
Table 3
Sample-Weighted Average Reliabilities for Each Predictor and Criterion Category (rxxand ryy)
Predictor rxx K N
Interpersonal attraction .845 24 1,422
Task commitment .866 5 245
Group pride — — —
Criterion ryy K N
Performance behavior .874 16 719
Performance outcome .888 34 1,525
Effectiveness .911 27 1,283
Efficiency .894 26 1,218
.315;Z⫽2.173,p⬍.05). Task commitment, in contrast, did not exhibit a clear difference between behavior and outcome (behav-ior,Mˆ⫽.302; outcome,Mˆ⫽.273;Z⫽.313,p⫽.754).
Interpersonal attraction displayed the same pattern for effective-ness versus efficiency as observed in the overall analyses, although the difference now reached only marginal levels of significance (effectiveness,Mˆ⫽.148; efficiency,Mˆ⫽.284;Z⫽1.722,p⫽
.085). Although the same pattern was noticeable for effectiveness versus efficiency in the task commitment average correlations, the difference did not attain conventional levels of significance (ef-fectiveness,Mˆ ⫽.232; efficiency,Mˆ ⫽.343; Z⫽1.386,p⫽
.166).
Team Workflow
The final hypothesis we examined held that cohesion would be beneficial to groups whose patterns of team workflow required greater workflow between members. Following the typology of Tesluk et al. (1997), we compared four progressively increasing patterns of team workflow: pooled, sequential, reciprocal, and intensive. Because the underlying moderator construct is probably best expressed as a continuum ranging from low levels of work-flow to high levels of workwork-flow, we placed the four categories on a 4-point continuum and examined how well the continuous mod-erator predicted the corrected correlations using weighted least squares regression (see Steel & Kammeyer-Mueller, 2002, for more details on the analysis of continuous moderators in meta-analysis).4 The results of this analysis found that the teamwork
moderator accounted for a significant amount of variance in the corrected correlations (R2
⫽.096),F(1, 52)⫽5.430,p⬍.05. As predicted, as team workflow increased, the cohesion–performance relation became stronger.
Discussion
Our hypotheses for this meta-analysis mainly were concerned with three issues: the independent contribution of each component of cohesion, an examination of the criterion domain, and the role of team workflow. With respect to the components of cohesion, interpersonal attraction, task commitment, and group pride all displayed independent relations to group performance. As we noted in the Results section, however, our assessment of group pride–performance relations is somewhat limited by the small number of effects available. Moreover, the six effects that mea-sured group pride all came from a rather homogeneous set of studies. All were studies of sports teams that used only effective-ness measures of outcomes (usually a win–loss ratio). Clearly, more research is needed to determine the importance of this component of cohesion.
Our analyses of the criterion domain revealed two noteworthy findings. First, in line with Campbell et al. (1993; Campbell, Gasser, & Oswald, 1996), performance behaviors exhibited stron-ger relations with cohesion than did performance outcomes. In addition, measures of efficiency reflected the beneficial effects of group cohesion better than measures of effectiveness. Finally, patterns of team workflow moderated the cohesion–performance relation; tasks exhibiting greater amounts of workflow also held stronger cohesion–performance relations.
Relating Components of Cohesion to Various
Performance Criteria
We attempted to assess the relations between each component of cohesion and multiple criterion categories. Unfortunately, we could not examine each criterion variable with each component of cohesion because of a lack of studies in one or more of the categories. Interpersonal attraction exhibited correlations that largely were consistent with the overall findings. In contrast, task commitment displayed weaker differences between behavior and outcome, as well as effectiveness and efficiency. One potential explanation for the component differences is that task commit-ment, in contrast to interpersonal attraction, may not be as likely to reflect the fluidity of group behavior as it is to reflect an overall stronger motivation to perform well (Festinger, Schachter, & Back, 1950). As such, the benefits of task commitment apply despite the particular choices of performance measurement.
It is clear, however, that these propositions are in need of more focused research attention. To our knowledge, no researcher has attempted a direct test of components of cohesion with any of the criteria examined in this meta-analysis. Indeed, this dearth of research contributed to our inability to examine the relations between performance criteria and group pride, as well as the relations between any component and patterns of teamwork.
When Are Cohesive Groups Advantageous?
A consideration of the relations between components of sion and various criteria reveals several situations in which cohe-sive groups are likely to perform better. Certainly, when efficiency is an important goal in the organization (i.e., as opposed to situa-tions in which successful completion of a task is the main require-ment, e.g., winning a game, successful surgical performance, ob-taining a high grade on a project, etc.), cohesive groups gain an advantage. Of particular interest was the finding that the distinc-tion between efficiency and effectiveness was not as strong when cohesion was conceived of as task commitment. This finding is not to say, however, that task commitment does not bear strong rela-tions to measures of effectiveness or efficiency. In fact, our results suggest that the reverse is true; task commitment held moderate relations across all of the examined criterion domains. Whether this finding holds for patterns of team workflow, however, must await future studies that compare this moderator with the various components of cohesion.
Cohesive groups also achieve performance benefits when group performance is conceptualized as a behavior instead of an out-come. We argued that the stronger relation for performance be-havior was due to external impediments inherent in outcome measures; however, we also point out that because performance behaviors are causally antecedent to performance outcomes, they may be more closely tied to cohesion and the group processes that result from cohesion. Indeed, one would have difficulty imagining any part of a cohesion– outcome relationship that is not mediated
4Consistent with research examining continuous moderator tests (Steel
by performance behavior. This finding illustrates the necessity of defining performance as behavior in order to appropriately identify those constructs that are predictive. Campbell et al. (1996) la-mented that applied psychology would be hindered to the extent that we conceive of performance as an outcome, and this meta-analysis provides justification for their disapprobation.
Perhaps the most interesting point concerning the utility of group cohesion is that every way in which we examined compo-nents of cohesion and domains of criteria resulted in a positive mean correlation, and all of these mean correlations were signifi-cantly different from zero. Certainly, previous meta-analyses on the overall cohesion–performance effect left little doubt that co-hesion benefits performance, but our analysis suggests that this benefit cuts across many different conceptualizations of the cohe-sion and performance constructs. In addition, although differences in magnitude between the mean corrected correlations were often not large (e.g., effect size difference of .13 between the respective mean corrected correlations for behavior versus outcome criteria), these small differences in correlations at the group level can have substantial practical utility when considered within a decision theoretic utility sense.
As a final note, we acknowledge the potential relation of cohe-sion to another criterion domain, broadly termed contextual per-formance. Although there is some debate concerning what actions or behaviors should be considered indicators of contextual perfor-mance, as well as the appropriate nomenclature for this construct domain, generally contextual performance includes “behaviors that do not support the technical core itself so much as they support the broader organizational, social, and psychological environment in which the technical core must function” (Borman & Motowidlo, 1993, p. 73). Because contextual performance often includes ac-tions that are helpful to other members of a group, it seems likely that cohesive groups would experience higher levels of contextual performance (LePine, Hanson, Borman, & Motowidlo, 2000).
Indeed, we attempted to assess this relation, and from the few studies that contained appropriate effects, we found a positive correlation between cohesion and contextual performance. Be-cause contextual performance usually occurs at the individual level, however, most of the studies examining this relation did not meet our inclusion criterion of group-level effects. Nevertheless, we feel it worthwhile to mention our cursory examination as an encouragement to other researchers pursuing this topic.
When Are Cohesive Groups Less Advantageous?
Despite the overall rosy picture presented above for the utility of group cohesion, there definitely were circumstances in which cohesive groups provided little help for performance. Obviously, the flip side of the domains mentioned above require acknowledg-ment: Compared with performance behaviors, performance out-comes do not reflect the advantages of cohesion, and compared with efficiency measures, effectiveness measures ironically are less effective in capturing the benefits of being in a cohesive group. Finally, as our analysis of team workflow demonstrated, groups who engage in fewer exchanges of work (e.g., pooled workflow) do not benefit from cohesion as much as those groups whose workflow is intensive.
As we noted above, the difference between behavior versus outcome and effectiveness versus efficiency held mostly for
stud-ies that conceived of cohesion as interpersonal attraction. Although our meta-analysis was unable to identify the reasons why inter-personal attraction held these stronger relations, there are specu-lative reasons to expect this result. Efficiency often relies on the communication and cooperation of group members. To the extent that interpersonal attraction facilitates these group processes, it will likely lead to more efficient group performance. If the quality of group inputs is not taken into account, as is the case with measures of effectiveness, then interpersonal attraction may be somewhat insensitive as a predictor. Unfortunately, research di-rectly examining these assertions is largely absent in the organi-zational literature.
The fact that correlations involving pooled team workflow were weak in comparison with more intensive patterns makes intuitive sense when considering the types of tasks involved in these stud-ies. If the members of a team focus on their own individual performances, then many of the benefits of cohesion would have no bearing on the team’s performance. Interestingly, it may be the case that task commitment would boost performance in tasks requiring pooled teamwork whereas interpersonal attraction would not. The benefits of task commitment revolve around a shared motivation to do well on a task. Because this motivation does not necessarily require members to work together, tasks requiring pooled teamwork might still benefit from this shared commitment. The same logic applies to group pride: If members of a team are motivated to maintain the esteem of the group, then their motiva-tion may carry them through individual tasks that are then pooled to the team level. Unfortunately, there were not sufficient numbers of studies in our sample to test these hypotheses, but certainly our thoughts merit consideration in future studies of cohesion and performance.
Limitations
There are several possible limitations present in our meta-analysis that warrant discussion. First, there are issues regarding correlations or confounds amongst moderators in other meta-analyses and within our own. A case could be made, for example, that group size is theoretically related to one or more of our included variables (e.g., team size occasionally is considered an input for efficiency measures). If this were the case, it would be unclear which variable was responsible for our observed results.5
Obviously, we cannot include all previously examined moderators, and to that extent, we must remain cautious with the interpretation of our results. It is possible, for example, that our ideas and results concerning particular patterns of workflow add little beyond Gully et al.’s (1995) notions of task interdependence. We would argue, however, that identifying the manner in which work is exchanged in a group provides a more precise understanding of the actual process involved. Indeed, team workflow describes one of the potential mechanisms that make groups interdependent. At a min-imum, conceptualizing workflow as a continuous variable allows for a more precise description of the actual process of teamwork
5Because group size was fairly easy to code, we did examine this
than do categories of task interdependence, and results of our moderator analyses are consistent with expectations for workflow as a continuous variable.
Aside from overlap with moderators of other meta-analyses, it is possible that variables within our own meta-analyses were con-founded. For example, if a significant proportion of the same set of studies included both outcome criteria and measures of effective-ness, then it is difficult to say which variable is responsible for the average effect. Indeed, of the six possible relations between our four variables, which, for the purpose of breaking down distribu-tions of correladistribu-tions, were treated as moderators (excluding group pride because of the small number of effects), two correlations were significant. Behavior– outcome was related to effectiveness– efficiency (r⫽.456) such that studies with behavioral measures of performance tended also to use efficiency criteria (or, conversely, that studies with measures of outcomes tended also to use effec-tiveness criteria; see Appendix B, however, for examples of stud-ies that were coded in the four possible combinations of catego-ries). In addition, pattern of team workflow was related to behavior– outcome (r⫽.389) such that studies with more work-flow between members tended to use outcome measures (or, conversely, studies with less workflow between members tended to use behavioral measures).
Appropriate evaluation of these relations, however, is a difficult task. Using a weighted least squares regression approach (Steel & Kammeyer-Mueller, 2002), as we did in some other analyses, proved difficult to conduct for reasons of study exclusion. In particular, many studies had to be eliminated because they could not be coded for all relevant variables. Further still, some studies, despite having an effect size estimate for all of the relevant categories, did not have the same effect size estimate. Thus, the remaining set of studies was small in comparison to the total sample of studies, and more importantly, the criteria for elimina-tion was potentially biased. Our soluelimina-tion, therefore, is to encourage future researchers to tackle the question of whether stronger cohe-sion–performance relations surface as a result of assessing behav-iors (as opposed to outcomes) by using measures of efficiency (as opposed to effectiveness) or if these relations benefit from both factors in an additive fashion or reflect an unexamined causal ordering of variables (e.g., see Gonzalez, Burke, Santuzzi, & Bradley, in press; Kirkman & Rosen, 1999).
Conclusion
In summary, we tested several hypotheses in the cohesion–per-formance literature using meta-analytic techniques. Our results provide compelling evidence for expected differential relations between group cohesion and different types of criteria. Similarly, our sample of studies found that groups who take the most advan-tage of cohesion typically engage in intensive patterns of work-flow. Finally, these results suggest that all three of Festinger’s (1950) original components of cohesion—interpersonal attraction, task commitment, and group pride— each bear significant inde-pendent relations to performance across many criterion categories. These findings not only enhance our understanding of the con-struct domains of group cohesion and group performance, but also add to our knowledge of the magnitudes of effects between con-structs in the respective domains. A final benefit of our meta-analyses was in identifying important gaps in our understanding of
relations between group cohesion and group performance, hope-fully providing guidance for future primary studies.
References
References marked with an asterisk indicate studies included in the meta-analyses.
*Arroyo, D. G. (1997).Cohesion, performance, and satisfaction in the co-acting sport of collegiate wrestling.Unpublished doctoral disserta-tion, University of Connecticut, Storrs.
Austin, J. T., & Villanova, P. (1992). The criterion problem: 1917–1992. Journal of Applied Psychology, 77,836 – 874.
*Bakeman, R., & Helmreich, R. (1975). Cohesiveness and performance: Covariation and causality in an undersea environment.Journal of Ex-perimental Social Psychology, 11,478 – 489.
*Barrick, M. R., Stewart, G. L., Neubert, M. J., & Mount, M. K. (1998). Relating member ability and personality to work-team processes and team effectiveness.Journal of Applied Psychology, 83,377–391. *Bhatara, K. (1972).Effect of cohesiveness on goal setting behavior in the
group.Jabalpur, India: Banarsidas Bhanot.
*Bird, A. M. (1977). Team structure and success as related to cohesiveness and leadership.Journal of Social Psychology, 103,217–223. *Blades, J. W. (1986).Rules for leadership: Improving unit performance.
Washington, DC: National Defense University Press.
Borman, W. C., & Motowidlo, S. J. (1993). Expanding the criterion domain to include elements of contextual performance. In N. Schmitt & W. C. Borman (Eds.),Personnel selection in organizations(pp. 71–98). San Francisco: Jossey-Bass.
Borucki, C. C., & Burke, M. J. (1999). An examination of service-related antecedents to retail store performance.Journal of Organizational Be-havior, 20,943–962.
*Burchfield, M. A. (1997).Personality composition as it relates to team performance. Unpublished doctoral dissertation, Stevens Institute of Technology, Hoboken, New Jersey.
Burke, M. J., & Landis, R. S. (2003). Methodological and conceptual challenges in conducting and interpreting meta-analyses. In K. R. Mur-phy (Ed.), Validity generalization: A critical review (pp. 287–309). Mahwah, NJ: Erlbaum.
Campbell, J. P. (1990). Modeling the performance prediction problem in industrial and organizational psychology. In M. D. Dunnette & L. M. Hough (Eds.),Handbook of industrial and organizational psychology (2nd ed., Vol. 1, pp. 687–732). Palo Alto, CA: Consulting Psychologists Press.
Campbell, J. P., Gasser, M. B., & Oswald, F. L. (1996). The substantive nature of performance variability. In K. R. Murphy (Ed.),Individual differences and behavior in organizations(pp. 258 –299). San Francisco: Jossey-Bass.
Campbell, J. P., McCloy, R. A., Oppler, S. H., & Sager, C. E. (1993). A theory of performance. In N. Schmitt & W. C. Borman (Eds.),Personnel selection in organizations(pp. 35–70). San Francisco: Jossey-Bass. Carless, S. A, & De Paola, C. (2000). The measurement of cohesion in
work teams.Small Group Research, 31,71– 88.
*Carpenter, S., & Radhakrishnan, P. (2002).The relation between allo-centrism and perceptions of in-groups. Manuscript submitted for publication.
Carron, A. V. (1982). Cohesiveness in sport groups: Interpretations and considerations.Journal of Sport Psychology, 4,123–138.
*Carron, A. V., & Ball, J. R. (1977). An analysis of the cause– effect characteristics of cohesiveness and participation motivation in intercol-legiate hockey.International Review of Sport Sociology, 12,49 – 60. Carron, A. V., Colman, M. M., Wheeler, J., & Stevens, D. (2002).
Cohe-sion and performance in sport: A meta-analysis.Journal of Sport and Exercise Psychology, 24,168 –188.