Normalized Difference Vegetation Index (NDVI) In The
Integration Conservation Education Forest At Wan Abdul
Rachman Using Modis Data
Ali Rahmat1, Mustofa Abi Hamid2, Muhammad Khoiru Zaki3, Abdul Mutolib41Unite Graduate School of Agriculture Science, Gifu University, 1-1 Yanagido, Gifu 501-1193, Japan 2Department of Electrical Engineering Vocational Education, Sultan Ageng Tirtayasa University, Indonesia
3Department of Agronomy, Sebelas Maret University, Central Java Indonesia 4Faculty of Agriculture Science, University of Lampung, Lampung, Indonesia
Correspondence: E-mail: [email protected]
A B S T R A C T S A R T I C L E I N F O
Forest plays an important role to support a global environ-ment. Currently, forest degradation occurs in developing countries. Therefore, the excellent strategies to against the forest degradation must be found. One of the best solutions is understanding the information of vegetation condition. Here, the objective of this paper was to apply a method as the assessment of vegetation monitoring using satellite data in the integration of conservation education forest at great for-est Wan Abdul Rachman in Lampung Province, Indonesia. In this study, normalized difference vegetation index (NDVI) was used, completed with satellite data (namely MODIS). This technique helps in monitoring vegetation status. Data NDVI from MODIS satellite data showed that forest area decrease very small from 2000-2017. The data was obtained for June, July, and the end of September.
© 2018 Tim Pengembang Jurnal UPI
Article History:
Received 11 December 2017 Revised 05 January 2018 Accepted 05 February 2018 Available online 09 April 2018 ____________________ which is widely spread in most regions of the world. Unfortunately, both in developed and developing countries, many forests are pres-ently threatened by the expansion of agricul-tural, urban, and industrial land or by
degradation phenomena caused indirectly by human activities (Waring & Running, 1998). Forest and trees have a function as a carbon sequestration. Tree or plants absorb more CO2 than they release, and the trapped CO2 is stored as a carbon in the biomass (e.g. foli-age, branches, trunks, and roots) and soils (Prasetyo, 2016; Permatasari et al., 2016). The carbon storage in the forest is about 50%
Indonesian Journal of Science & Technology
of its biomass (Tuly et al., 2005; Chang, 2013, Rahmat and Mutolib, 2016).
Forest monitoring is crucial to support forestry management, but the limitation on funding and technology makes high fre-quency in monitoring. Indeed, this increases the difficulties. normalized difference vegeta-tion index (NDVI; as an indicator of vegetavegeta-tion growth and coverage) has been widely em-ployed to describe the spatio-temporal char-acteristics of land use and land cover, includ-ing percent vegetation coverage (Kaufmann
et al., 2003) Vegetation indices are mainly de-rived from reflectance data from discrete red (R) and near-infrared (NIR) bands. They are operated by contrasting intense chlorophyll pigment absorption in the red against the high reflectance of leaf mesophyll in the near infrared. This case is well-known as normal-ized difference vegetation index NDVI=[NIR_R]/[NIR + R] (Bannari et al., 1995) and is the most widely used index, especially when analyzing data taken from satellite plat-forms. In practice, NDVI is and indicator for plant photosynthetic activity and has been found to be highly related to the green leaf area index (LAI) and the fraction of photosyn-thetically active radiation absorbed by vege-tation (FAPAR) (Bannari et al., 1995; Baret & Guyot, 1991; Veroustraete, Sabbe, & Eerens, 2002; Nandiyanto et al., 2016).
There are various methodologies for studying seasonal changes in vegetation through satellite images, one method of which is to apply vegetation indices relating to the quantity of greenness (Chuvieco, 1998). One of them is NDVI from MODIS setelite data. This paper was to get and use NDVI data from MODIS satelite. The paper also applied NDVI in the assessment of vegetation moni-toring using MODIS satellite data in the inte-gration conservation education forest at great forest Wan Abdul Rachman, Lampung Province.
2. METHODS
The study was conducted in IFCE WAR Great Forest Park, which is about 1.143 ha. It is located in Bandar Lampung, Indonesia
(be-t ee ° ’ . "- ° ’ . " E a d
° ’ . "- ° ’ . " “ U it Pelaksa a
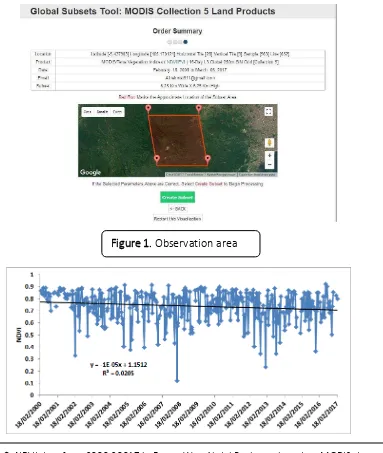
Teknis Daerah Taman Hutan Raya Wan Abdul Rachman 2009). The study used MODIS data MOD13Q1 product with large area 6.25 x 6.25 km and interval of day is 16 days. The product can provide NDVI. Observation period was from 18 February 2000 to 06 March 2017 (see Figure 1).
3. RESULTS AND DISCUSSION
The NDVI is a measurement of the bal-ance between energy received and energy emitted by objects on Earth. When applied NDVI to plant communities, this index estab-lishes a value for how green the area. In short, that showed the quantity of vegetation pre-sent in a given area and its state of health or vigour of growth. The NDVI is a dimensionless index, so its values is a dimensionless index and values range from –1 to +1. In a practical sense, the values that are below 0.1 corre-spond to bodies of water and bare ground, while higher values are indicators of high pho-tosynthetic activity linked to scrub land, tem-perate forest, rain forest and agricultural ac-tivity (Meneses-tavor, 2011)
Based on data NDVI from MODIS satelite data, vegetation condition in the integration of conservation education forest at great for-est Wan Abdul Rachman is quite good with the NDVI value (around 0.80). The measure-ment site is far from home residents and in-side of forest. This condition also explains no land cover or vegetation change in this site. With growing population pressures, some problems are found, such as in Dhamasraya forest in West Sumatra. Many forest were grabed by community who living sorrounding the forest (Mutolib, et al., 2017). NDVI is in-fluenced by the change of season. The season
gives great impact on phenology of the tree. Highest NDVI found in 257 DOY is around the end of september. This correlates with rainfall condition just after dry season. Also, good NDVI in 161 and 209 DOY was found although this time is lack of rainfall. However, this is be-cause enough water for the tree and make tree green (water trapped inside the soil). Bad NDVI was found around in January, October, and November. Although lot of rainfall occurs, clouds disturb sensor of MODIS to have inap-propriate condition to take good data from surface.
Figure 1. Observation area
4. CONCLUSION
Analysis forest has been investigated. Data NDVI from MODIS satellite data can be used to monitoring vegetation condition in the integration of conservation education for-est at great forfor-est Wan Abdul Rachman. NDVI in Wan Abdul Rachman forest decreases slightly from 2000 to 2017. NDVI in Abdul Rachman forest is around 0.80 annually. Good NDVI data was found in June, July, and the end of September.
Appendix
How to get MODIS data (following: Rah-mat, 2017)
1. Open: https://daac.ornl.gov/MODIS/ by your computer, hoose Create “u set (see right bottom).
2. Specify the coordinates for the center of area of interest: Insert the coordinate data (longitude and latitude) can use
Figure 3. Yearly average, Max, Min of NDVI in Forest Wan Abdul Rachman
direct GPS data or estimating using
4. Select date and provide email then place order: select starting date and ending
7. Click on the following URL to obtain your result
8. Data visualization and download: choose do load data Tirtayasa University, Indonesian, Sebelas Maret University, Central Java Indonesia, Uni-versity of Lampung, Lampung, Indonesia, and Gifu University, Japan.
6. AUTHOR“’ NOTE
The author(s) declare(s) that there is no conflict of interest regarding the publication of this article. Authors confirmed that the data and the paper are free of plagiarism.
7. REFERENCES
Bannari, A., Morin, D., Bonn, F., and Huete, A. R. (1995). A review of vegetation indices. Remote
sensing reviews, 13, 95–120.
Baret, F., and Guyot, G. (1991). Potentials and limits of vegetation indices for LAI and APAR assessment. Remote sensing of environment, 46, 213– 222.
Chuvieco, E. (1998). El factor temporal en teledetección: evolución fenomenológica y análisis de cambios. Revista de teledetección, 10, 1–9.
Fabio Maselli (2004) Monitoring forest conditions in a protected Mediterranean coastal area by the analysis of multiyear NDVI data. Remote sensing of environment, 89, 423– 433.
Kaufmann, R. K., Zhou, L. M., Myneni, R. B., Tucker, C. J., Slayback, D., Shabanov, N. V. and Pinzon, J. (2003). The effect of vegetation on surface temperature: a statistical analysis of NDVI and climate data. Geophysical research letters, 30, 21–47.
Mutolib, A., Yonariza, Mahdi, and Ismono, H. (2017). Forest ownership conflict between a local community and the state: A case study in Dharmasraya, Indonesian journal of tropical
forest science, 29(2), 163-171.
DOI: http://dx.doi.org/10.17509/ijost.v3i1.10798
p- ISSN 2528-1410 e- ISSN 2527-8045
Permatasari, N., Sucahya, T. N., & Nandiyanto, A. B. D. (2016). Agricultural Wastes as a Source of Silica Material. Indonesian journal of science and technology, 1(1), 82-106.
Prasetyo, E. (2016). Detection of Mango Tree Varieties Based on Image Processing. Indonesian
journal of science and technology, 1(2), 203-215.
Rahmat, A. (2017) Simple estimation air temperature from modis LST in Gifu City, Japan.
Jour-nal of science and applicative technology, 1(1), 1-7.
Rahmat, A., and Mutolib, A. Comparison air temperature under global climate change issue in Gifu city and Ogaki city, Japan. Indonesian journal of science and technology, 1(1), 37-46. 2016.
Tavor, C.L. (2011) NDVI as indicator of degradation. Unasylva, 238 (62), 39-46.
Veroustraete, F., Sabbe, H., and Eerens, H. (2002). Estimation of carbon mass fluxes over Eu-rope using the C-Fix model and Eruflux data. Remote sensing of environment, 83, 376– 399.