VARIATION OF CHART DATUM TOWARDS MARITIME DELIMITATION DUE
TO RISING SEA LEVEL
A. R. Mohd Faizuddin , M. Mohd Razali
Geocoastal research Unit, Department of Geoinformation, Faculty of Geoinformation and Real Estate, Universiti Teknologi Malaysia, 81310, Johor Bahru,
Johor Darul Ta’zim, Malaysia. [email protected]
KEY WORDS: UNCLOS, Maritime Zones, Baseline Shifting, Chart Datum, Mean Sea Level, Slope of the Shoreline
ABSTRACT:
The importance of Chart Datum in hydrographic surveying is inarguable because its determination is part of the process to obtain the actual depth of bathymetry. The Chart Datum has a relationship with the determination of base points because any uncertainty of the base points would definitely cause uncertainty to the determination of the maritime baseline. If there is any doubt on the baselines, it will then cause doubt on the maritime zones as well which includes the equidistant line that forms the border between the two countries. However, due to the ongoing rising sea level, there has been some variations of the Chart Datum in some areas in Malaysia. This research discusses about the variation of Mean Sea Level and Chart Datum for the tide gauge stations at Geting, Cendering, Sedili and Tioman at East Coast and Kukup, Langkawi, Lumut and Penang at the West Coast of Peninsular Malaysia. The tidal analysis was carried out by using the 23 years of data beginning at 1993 to 2015. The observed tidal data for 23 years were processed and analysed by using GeoTide software. In this research, the Harmonic Analysis technique was used in order to calculate the values of Mean Sea Level and the Chart Datum while the slope of the shoreline is modelled by using Global Mapper. The linear trend of the Mean Sea Level and the Chart Datum was analysed to determine the increase of the annual sea level in millimetres accuracy and also to determine the variation of the Chart Datum for each tidal station and its impact towards maritime baseline. The result has shown that the linear trend of sea level rise varies from 24 millimetres per year up to 168 millimetres per year at the East Coast and 24 millimetres per year up to 96 millimetres per year at the West Coast of Peninsular Malaysia. As for the maritime baseline, results has indicated that there exist shifting in the horizontal which are varies from 1.564 metres per year to 3.299 metres per year at the East Coast and from 1.331 metres per year up to 5.857 metres per year at the West Cost of Peninsular Malaysia. From the analysis, it can be stated that the horizontal shift occur greater at the East Coast rather than at the West Coast of Peninsular Malaysia. As a conclusion, the sea level rise does have significant impact towards maritime baseline. Furthermore, the determination of a stable Chart Datum is important to define the maritime baseline in other to avoid conflict with other neighbouring countries.
1 INTRODUCTION
1.1 Background of Study
Malaysia is a maritime country and its economic interests depend on the sea. According to statistics of the Department of Survey and Mapping Malaysia (DSMM) and National Hydrographic Centre (NHC), Malaysia has territorial waters covering an area of 65,023 square kilometres Exclusive Economic Zone with an area of 450, 233 square kilometres, a coastline of 4800 kilometres and 1007 islands that offer a variety of natural resources and opportunities for the development of the country's maritime industry. Treasures of the sea and the importance of the maritime industry needs to be preserved for the prosperity and welfare of the country. Nationalmaritime boundaries have gained international recognition in order to control the law and exploiting the treasure is not in question. After the rectification of UNCLOS 1982, on October 14, 1996, the state has an obligation to the United Nations (UN) for depositing the coordinates of the basepoints according to Article 16 paragraph 2.
According to the UNCLOS 1982, all the littoral states shall deposit the coordinate‘s starting point from which to measure the width of the border areas and other maritime zones. The depositions are also important to strengthen the country's claim on the Continental Shelf beyond 200 nautical miles as outlined in Article 76 of UNCLOS 1982. The determination of basepoint requires a high precision hydrographic measurement. According to the Baselines Sub- Committee Meeting 2004, outlining the basepoints and baselines is the basis for the determination of the maritime zones, law enforcement and implementation of the maritime boundaries. Determination of the position of the basepoint with high precision measurement is crucial in order to strengthen the maritime zones and the determination of the maritime boundary of Malaysia and the neighbouring countries. Deposition of basepoints and baselines to the United Nations also directly makes it acceptable and recognized globally.
This phenomenon occurs due the changes in sea which also in turn influence the Chart Datum along the coastal line. Therefore, when the position of the CD has changes, it will also definitely affect the baseline. As sea level arise, the real low water typical baselines may come to move towards the land, or low tide elevation and islands that are viewed as the suitable location to commence the starting point of the baselines, could likewise come to be totally sunk under the water
Figure 1. Baseline Shifting
2 LITERATURE REVIEW
2.1 INTRODUCTION
The study on the CD on the West Coast of Taiwan by Chang and Sun (2004), found out that the variances of the monthly CD was up to 12.3 centimetres while the study by Swanson (2003), found out that the estimated error of tidal datum on 1 sigma (σ) for 1 month observations on the East Coast and West Coast of US is by 0.08 metres and 0:11 metres. The objective is to ensure that the adopted CD can be reviewed if there are any astronomical changes that occur in the world. Thus, the error in maritime datum should describe clearly as it will provide confidence and more precise result for any hydrographic surveying work.
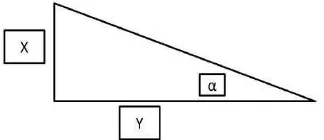
In other cases, the study of the CD at tide stations of Teluk Ewa, Langkawi clearly shows that the period of observation in less than 1 year cannot meet the requirements of International Hydrographic Organization (IHO) at 2 sigma level. The CD precision is very important for hydrographic tasks that require high accuracy such as the determination of maritime basepoint of a country. Consequently, the use of which is generated from CD observations less than 1 year can lead to loss of maritime zones, especially in the area of measurement that has a gentle slope along the shoreline. The relationship between each parameter can be seen in Figure 2.
Figure 2 Relationship of Parameters
Y = X / (Tan α) (1) procedures that are used to justify each objective are illustrated in Figure 3 and Figure 4.
Figure 4. Methodology for Objective 2
3.1 Data Processing Stage
Data processing was conducted by using GeoTide software. All the steps and procedures in data processing were summarized in the Figure 5.
Figure 5. Data Processing for GeoTide
3.2.1 Processing the Slope of the Shoreline
Figure 6. Data Processing for Global Mapper.
The Global Mapper software were used in this research in order to extract the slope of the shoreline and also the low water mark based on the contour line. The procedures are as illustrated in Figure 6.
4 RESULT AND DISCUSSION
4.1 Introduction
This chapter discusses about the analysis of the obtained result from the data processing conducted as described in Chapter 3 of the Research Methodology. In this section, the main objective of this research is to study the trend of Mean Sea Level and Chart Datum for 23 years period of data starting from 1993 to 2015 for the determination of shifting of the maritime baseline.
4.2 Linear Trend of all Tide Gauge Station
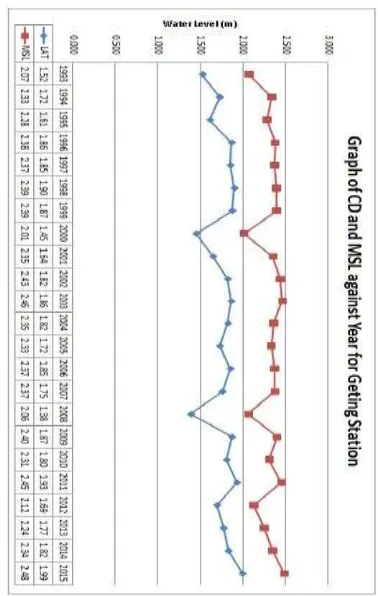
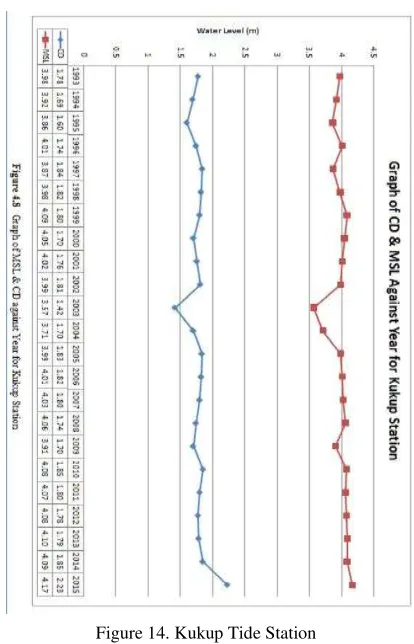
The values of CD and MSL were obtained by using GeoTide software using the Harmonic Analysis technique. The linear trends of each tide gauge station were calculated and plotted by using Microsoft Excel. The graph of each tide gauge stations are illustrated in Figure 7, Figure 8, Figure 9, Figure 10, Figure 11, Figure 12, Figure 13 and Figure 14.
Figure 8. Cendering Tide Station
Figure 9. Tioman Tide Station
Figure 10. Sedili Tide Station
Figure 12. Penang Tide Station
Figure 13. Langkawi Tide Station
Figure 14. Kukup Tide Station
Below are the lists of equation obtained from the graph of MSL and CD against Year by calculating the gradient of the graph as shown in Table 1.
Table 1. Linear Trend Equation of all stations
Table 2. Linear Trend MSL and CD for all stations
The linear trend of Sea Level Rise ranges from 12 millimetres per year up to 168 millimetres per year at East Coast and it ranges from 24 millimetres per year up to 96 millimetres per year at the West Coast of Peninsular Malaysia.. As for the linear trend of the CD, its value ranges from 48 millimetres per year up to 288 millimetres per year at the East Coast and varies from 36 millimetres per year up to 96 millimetres per year at the West Coast of Peninsular Malaysia.
4.3Results of Processing Slope of The Shoreline
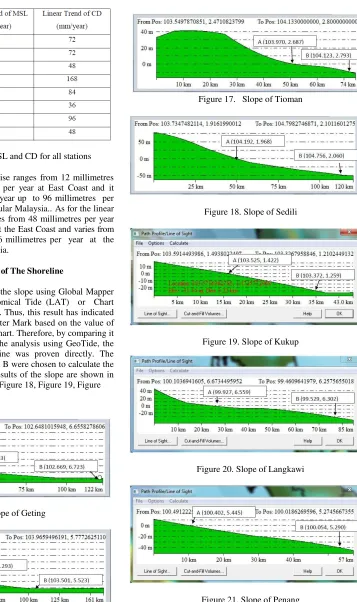
The result for the processing of the slope using Global Mapper had shown the Lowest Astronomical Tide (LAT) or Chart Datum (CD) along the shoreline. Thus, this result has indicated that the position of the Low-Water Mark based on the value of the contour line in the nautical chart. Therefore, by comparing it with the variation of CD from the analysis using GeoTide, the shifting of the maritime baseline was proven directly. The coordinates of Point A and Point B were chosen to calculate the gradient of the shoreline. The results of the slope are shown in Figure 15, Figure 16, Figure 17, Figure 18, Figure 19, Figure 20, Figure 21 and Figure 22.
Figure 15. Slope of Geting
Figure 16. Slope of Cendering
Figure 17. Slope of Tioman
Figure 18. Slope of Sedili
Figure 19. Slope of Kukup
Figure 20. Slope of Langkawi
Figure 22. Slope of Lumut
The Coordinate of all Point A an Point B are shown in Table 3.
Table 3. Coordinates of Point A and Point B
Table 4 stated the angle of the slope of the shoreline for all the tide gauge station used in this research.
Table 4. Slope of the Shoreline
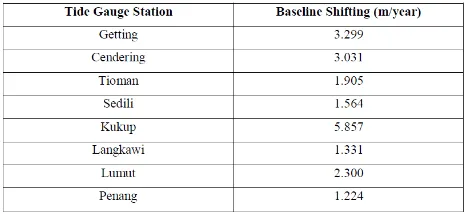
Therefore, Table 45 shows the shifting of baseline for over 23 years from 1993 to 2015 for all tide gauge stations after the calculation using the formula stated in Chapter 2.
Table 5. Shifting of Baseline
5 CONCLUSIONS
Based on the comparison made for data processed for 23 years of tidal observation for every station, the result shows a slight variation of the value of the MSL and the CD. As a conclusion, the continuous rising of CD along the shoreline has resulted in the loss of maritime zones, especially in the area of measurement has a gentle slope along the shore. This research may also improve further tidal prediction accuracy with the use of existing constituents generated through a period of 23 years. Therefore, it is best to assume that this deviation will continue to proceed if the sea level continues to rise. The second objective of this research has also been achieved which is to study the impact of rising sea level towards the uncertainty of the basepoint. Based from the analysis, by analyzing the relation between all three parameters which are the Slope of the shoreline, the CD variation and the Uncertainty of the basepoint, it can be concluded that due to the steeper geography of the East Coast of Peninsular Malaysia, the shifting of the baseline is less occurring than the shifting that occur in West Coast of Peninsular Malaysia due to its gentle geography.
RECOMMENDATIONS
Considering the result, the result, the following recommendations are suggested for the future studies:
(a)The suggested method that can be used to study the changes of the sea level is by combining space geodetic data (GPS), tide gauge data and with a precise leveling technique. This technique allows us to investigate the main cause of the sea level rise which is either caused by the volume of water increase or seabed uplift.
(b) The processing of the tidal data should be conducted by using both Harmonic Analysis and Multi-Spectral Analysis in order to determine the better method and better result to be used in the research by comparing it with the result from Department of Survey and Mapping Malaysia
(c)In order to obtain the slope of the shoreline, a proper survey should be conducted by using either the Single Beam or Multi Beam Echosounder. Digitizing the nautical chart is acceptable, however it is still robust and only a rough estimation of the slope. However, by using Echosounder, a more accurate gradient of the slope can be obtained.
ACKNOWLEDGEMENTS
REFERENCES
Abdullah, M. H. (2014). Variations of Sea Level and Tidal Behaviourial during El- Nino and La-Nina :An Example of
Malaysian Coastline, Master Thesis, Fakulti Geoinformasi dan
Harta Tanah, Universiti Teknologi Malaysia, Johor.
Alex, O. E. (2013). ITLOS Approach to the Delimitation of Continental Shelf Beyond 200 NM in Bangladesh and
Myanmar: Theoretical and Practical Difficulties, London
International Boundary Conference, London, England.
Bruce, C. D. (1991). Global Sea Level Rise, Journal of Geophysical Research, Springer, Volume (96): 34-55.
Church, J. A., White, N. J., Coleman, R., Lambeck, K. and Mitrovica, J. X. (2004). Estimates of the regional distribution of
sea level rise over the 1950-2000 Period, 17-25.
Church, J. A., White, N. J., and Hunter, J.R. (2006). Sea-level
rise at tropical Pacific and Indian Ocean islands, Global Planet
Change, 155–68.
Din, A. H. M. (2010).Sea Level Rise Estimation using Satellite
Altimetry, Master Thesis, Fakulti Geoinformasi dan Harta
Tanah, Universiti Teknologi Malaysia, Skudai, Johor.
Din, A. H. M., Abazu, I. C., Omar, K. M. (2016). The Impact of Sea Level Rise on Geodetic Vertical Datum of Peninsular
Malaysia, Fakulti Geoinformasi dan Harta Tanah, Universiti
Teknologi Malaysia, Skudai, Johor.
Hasan, Z. Othman, A. K.& Maulud, K. N. (2008). Impak perubahan datum carta dan kecerunan pesisir depan terhadap
ketidakpastian kedudukan titik pangkal Malaysia. Sains
Malaysiana 37(2): 123-130.
Jabatan Ukur dan Pemetaan Malaysia (2006). Salinan data digital cerapan pasang surut setiap jam bagi stesen tetap tolok pasang surut daripada tempoh 1993 hingga 2015 dalam format DNM. Kuala Lumpur: Jabatan Ukur dan Pemetaan, Malaysia.
Storlazzi, C. D., Elias, E. P. L. and Berkowitz, P. (2015). Many Atolls may be Uninhabitable within decades due to climate
change Sci. Rep, 45-46.
Tanaka, Y., Yasuda, I., Hasumi, H., Tatebe, H. & Osafune, S. (2012). Effects of the 18.6-yr modulation of tidal mixing on the north pacific bi-decadal climate variability in a coupled climate
model. Journal of Climate 25: 7625-7642.
Taylor, F. W., Briggs, R. W., Frohlich, C., Brown, A., Hornbach, M., Papabatu,A. K., Meltzner, A. J. and Billy, D. (2008). Rupture across arc segment and plate boundaries in the 1 April 2007.
Taylor, K. E., Stouffer, R. J., Meehl, G. A. (2012). An overview
of CMIP5 and the experiment design. Bulletin of the American
Meteorological Society, 93(4): 485–498
Tjia, H. D. & Sharifah Mastura, S. A, (2013). Sea Level
Changes in Peninsular Malaysia. Bangi: Penerbit UKM.
Trupin, A. and Wahr J. M. (1990). Spectroscopic Analysis of
Unal, Y. S. & Ghil, M. (1995). Interannual and interdecadal
oscillation patterns in sea level, Climate Dynamics, Journal
Article, 11, 255-278.
Wang, C., Weisberg, R.H., Virmani, J. I. (1999). Western
Pacific interannual variability associated with the El Niño–