CLASSIFICATION OF TRAFFIC RELATED SHORT TEXTS TO ANALYSE ROAD
PROBLEMS IN URBAN AREAS
Ana María Magdalena Saldana-Perez a, Marco Moreno-Ibarra b, Miguel Tores-Ruiz b.
Instituto Politécnico Nacional, Centro de Investigación en Computación (CIC), Mexico City, México.
Av. Juan de Dios Bátiz, Esq. Miguel Othón de Mendizábal. Colonia Nueva Industrial Vallejo. Delegación Gustavo A. Madero. C.P.07738. México. – a [email protected], b(marcomoreno, mtorres)@cic.ipn.mx
KEY WORDS: Volunteered Geographic Information, Human sensors, Machine Learning, Classification, Data Analysis, Traffic.
ABSTRACT:
The Volunteer Geographic Information (VGI) can be used to understand the urban dynamics. In the
classification of traffic related short texts to analyze road problems in urban areas, a VGI data analysis is done over a social media’s publications, in order to classify traffic events at big cities that modify the movement of vehicles and people through the roads, such as car accidents, traffic and closures. The classification of traffic events described in short texts is done by applying a supervised machine learning algorithm. In the approach users are considered as sensors which describe their surroundings and provide their geographic position at the social network. The posts are treated by a text mining process and classified into five groups. Finally, the classified events are grouped in a data corpus and geo-visualized in the study area, to detect the places with more vehicular problems.
1. INTRODUCTION
Urban computing introduces technology into many different human activities related to health, security, information and transportation, among others, increasing people´s interest on technological issues and their participation to generate web content (Kindberg, 2007).
Due to the technological advances in mobile devices such as smartphones and tablets, citizens access data sources that keep them informed about factors and events that modify their activities and their environment (Rudinac et al., 2017).
Thanks to the global communication network, people are constantly connected and can be noticed about what is happening in their surroundings; what is more, people are able to communicate what they perceive, acting like intelligent sensors (Kindberg, 2007).
Social media are an important and actualized data source (Dey & Roy, 2016), every minute thousands of publications are done. In this approach the social media Twitter is analysed. Twitter is a microblogging service whose posts are called tweets (Twitter, 2017). Twitter has more than 500 million users all around the world, which post approximately 65 million tweets a day (Bernstein et al., 2013). In the approach, the traffic related tweets are analysed in order to identify the kind of events that commonly generate road problems in an urban area.
The main characteristic of this research is the use of a machine learning algorithm to classify VGI data, in contrast to other related methodologies which make use of manual classifiers. After the classification, the traffic related tweets are geo-visualized with the purpose to identify the traffic conditions at the city. The proposed study area is Mexico City.
The paper is organized as follows: in Section 2, related works are briefly described; in Section 3, the proposed methodology is shown; in Section 4, the obtained results are explained, as well as the comparison between the implemented classification algorithm and another classification method. Finally, in Section 5, the conclusions and future work are shown.
2. RELATED WORK
On the internet there exists many resources to post information such as blogs, web sites, and social media; beyond, some of them allow people to generate geographic information. The posts done by people, such as videos, images, comments and messages, are part of the user generated content (UGC); these data become important when is used to analyse the social behaviour or human activities (Foth, 2009).
The technological advances have increased the people’s interest in generate content, nowadays, people can post information from any place through the use of mobile devices, smartphones and computers (Yang et al., 2016). The mobile devices let users to add the coordinates of the place where they are.
The volunteered geographic information is made up of the user generated content with coordinates or geographical references. It is an important data source for geo-processing; besides communicate the user thoughts, also provides extra information to locate the user at a geographic place (Lin, 2013). VGI has inspired the implementation of specialized web sites, such as
OpenStreetMap, Twitter, Foursquare, Google Maps and Twitter, among others (Kunze & Hecht, 2015).
Internet, social media, mobile devices, they all working together let humans to act as sensors. People have different points of view, The International Archives of the Photogrammetry, Remote Sensing and Spatial Information Sciences, Volume XLII-4/W3, 2017
which depend of their life and activities. A person considers some factors interesting or not, and according to its criteria reports its perceptions (Fleming et al., 2014). During last years, the idea of considering people as sensors has increased. Resch et al. (2015), define three concepts to take into account when working with human sensors: people as sensors (the analogy), the collective sensing, and the citizen science.
The routing application Waze (Waze, 2017) is a clear example of VGI information usage; in it people share their personal traffic reports. Another example of VGI system is the US Environmental Protection Agency, a New York’s department system where people provide and also collect information about the air and water pollution in their city (Resch et al., 2016).
In some researches the volunteered geographic information has been used to map real-time data related to the energy saving, traffic and pollution (Paredes-Valverde et al., 2015). In the Massachusetts Institute of Technology Real Time Rome project, the social use of land, and movement patterns of people and vehicles are modelled. The analysed data are extracted from smartphones and GPS devices (Real Time Rome, 2017).
Concerning to the traffic related tweets analysis, it is worth to mention the traffic observatory (Ribeiro et al., 2012), a project that aims to implement specialized gazetteers in the tweets geo-codification processes; the researchers implement their own gazetteer called GEODICT, which contains information about cross streets, abbreviations, and alternative names of roads. In their methodology, the roads’ names and locations identified in tweets are recovered, then, are searched in GEODICT with a view to found their coordinates.
In the researching of Salazar et al. (2015) the geocoding of traffic events described in tweets is done by dividing the tweets’ texts in n-grams. Such structures are searched in specialized dictionaries in order to identify the coordinates where the described event occurred. The gazetteers also identify words related to traffic conditions that allow to classify tweets into three possible groups:
accidents, good conditions and bad conditions.
The user generated content and the VGI information are two potential data sources for many analysis; their main advantage is that their data are updated, accessible, and reflect the urban dynamics. In this approach two questions about the mentioned data sources usage are formulated:
What can be done with such information?
How could this information help to improve human activities?
Machine learning (ML) plays an important role when analysing tweets, most of the times the ML algorithms are used to classify and compute regression models over tweets. A ML algorithm election usually depends on the data features, the bias that could be tolerated, and the task that has to be done (Wolpert & Macready, 1995).
He et al. (2017) extract traffic related information from tweets posted at San Francisco Bay to obtain traffic predictions using linear regressions. In their research, Zhao et al (2016) propose online approaches for spatiotemporal events forecasting, using machine learning algorithms over tweets. The authors conclude that the forecasting of spatiotemporal events must consider the data spatial features and the correlations between them. In Lansley and Longley (2016) work Twitter topics in London are analysed; the geo-tagged tweets are classified into 20 possible topics using the Latent Dirichlet Allocation (LDA) algorithm.
The work investigates the differences in the tweeting behaviour of citizens at different London areas. The unsupervised model generated by the authors produces a readily classification of tweets based on their texts.
3. METHODOLOGY
In a way to answer the proposed questions in section two, the present approach makes use of VGI to classify the traffic events that affect the movement of vehicles and people through the study area, with a view to generate useful information about the traffic situation. Such information could be used on further researches, in order to think out possible solutions to reduce the traffic at big cities.
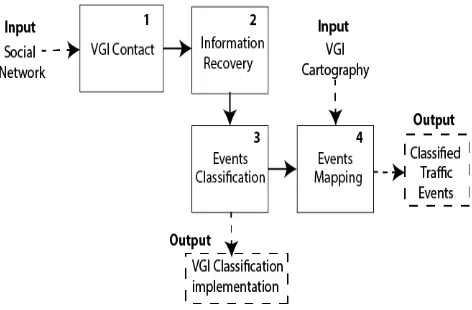
The classification of traffic related short texts to analyse road problems in urban areas, consists of four stages, all together transform VGI data into classified traffic information. The stages are: VGI contact, Information recovery, Events classification, and Events mapping.
In Figure 1 a diagram of the proposed methodology is shown.
Figure 1. Classification of short texts to analyse road problems in urban areas Methodology.
3.1 VGI contact
In this stage the methodology has direct contact with the social media, in order to extract VGI data.
To store the data extracted from the social media a spatial database called Urban_dynamycs has been structured. The database has four tables: extracted, where tweets collected from the social media are stored; recovered, where tweets are stored after being cleaned and textually treated; classified, where tweets related to traffic events have been grouped; and urban_area, where the geographic features of the study area as roads, street names, and geographic limits have been saved. The methodology computing and classification functions have been coded in
Python.
The VGIcontactstage purpose is to collect tweets related to the traffic and vehicular situations at the study area, and to store them in the extracted table. Since Twitter has been always interested in the new data treatments that can be done over its data, there exists some application program interfaces (API) that let many programming languages to extract tweets.
After a connection to Twitter, the methodology is able to collect the tweets from a group of specific accounts dedicated to post citizen’s traffic reports, or related to local news web sites. The International Archives of the Photogrammetry, Remote Sensing and Spatial Information Sciences, Volume XLII-4/W3, 2017
Each time a new tweet from the followed accounts is posted, it is analysed by a python script and separated into specific fields in order to be stored in the extracted table. The fields are: text (the tweets text), date and time (the date and time when the tweet was posted), user (the id of the account that posted the message), and
coordinates (the latitude and longitude coordinates of the place where the post was done if such data are available in the tweet’s metadata). As observed, the data stored on the extracted table are tweets in their original format.
3.2 Information recovery
In this stage the registries from the table extracted are processed in order to make them useful for the further methodology stages, also they are initially classified according to the traffic related words found in their texts. Onwards the tweets are called
registries.
There have been defined five possible traffic classes:
good_displacement, traffic, closure, accident and unclassified, their characteristics are explained in Table 1. To prevent classes from overlapping the classification procedure takes into account the words located next to the words of interest. The proposed classes shape a traffic scale.
Class Definition
good_displacement Tweet indicates good traffic conditions, the vehicles can displace without inconvenient through the city.
traffic Tweet describes bottlenecks and traffic jams.
closure Tweet describes problems or events that prevent the movement of vehicles through the roads.
accident Tweet reports an event where people got damaged or vehicles crashed.
unclassified Tweet does not provide enough information to be classified. Table 1. Proposed traffic classes.
A Python script designed to develop a text mining procedure in this methodology stage, separates each registry’s text into words. As the analysed registries are written in Spanish language, it is needed to remove some special characters such as accents and grammatical signs from the words; the mining procedure modifies some characters representation as in the case of the letter ‘ñ’that is replaced by ‘n’, without modify the meaning of the words. identified in the registry. The class with the most words found in the registry text is chosen as the initial class for it. A label to identify the class is assigned to the registry.
The results of this methodology stage are stored in the recovered
table, which has the same columns as the extracted table, and two more extra fields: cleaned_text (where the treated text, without special characters and stop words is stored), and class_label (the initial classification of the registry).
The recovered table, represents a data corpus of tweets that have been cleaned, and that can be useful for further investigations interested in traffic.
3.3 Events classification
In this stage the registries are classified by using the K Nearest Neighbours (KNN) machine learning algorithm. The maximum length of each registry is 140 characters, but this does not provide information about the number of words in the text. Since KNN is not able to work with bags of words, in this methodology is proposed the use of a words dictionary to analyse the registries words.
The approach’s words dictionary is a Python structure that contains all the words found in the analysed registries, with a view to provide information about the words frequency in each registry’s text. The Algorithm 1, designed to create the words dictionary is shown below.
Algorithm 1.Creation of the words dictionary to analyse the content of texts.
Once the words dictionary contains all the possible keys (the words) and values (the number of times a word appears in the entire corpus), the length of each text’s registry is normalized. A vector of words is created to represent numerically the field
cleaned_text of the registry following the sequence explained in Algorithm 2.
The resultant vectors are used in the training and test processes of the KNN algorithm. Since the algorithm works with numbers, the generated vectors are the key for the machine learning classification. The algorithm classifies an element by considering the bigger number of present samples that share features with it (Zhong & Ling, 2015), this classification algorithm does not learn patters, and makes use of the Euclidean distance to compute the similarity between instances (Zheng et al., 2016).
Suppose P and Q are two registries to compare; each registry text has n words, so P0 represents the first word to compare from the text P, and Pn is the last word in P; in the same way, Q0represents the first word in Q to be compared, and Qn is the last word in the text Q. The K in the algorithm notation, represents the proposed number of neighbours for the instance that is being classified, the value of K also assures the generalization for future data (Drakopoulos, 2016).
Input. Registries from the extracted table and an empty dictionary structure.
The following process is done over all the registries. 1.Initially the words dictionary is empty.
2.The registry cleaned_text is separated into words 3.Each word is searched in the dictionary:
if the word does not exists, it is added with a frequency value 1.
if the word exists, its frequency value increases 1.
Output. A words dictionary with all the possible words present in the registries.
Algorithm 2. Representation of the cleaned_text field of each registry as a numeric vector.
In Equation 1, there is shown the computing of the Euclidean distance between the instances P and Q, considered in the KNN classification(Lantz, 2013).
disE(P,Q)= sqrt( (P0 - Q0)2 + (P1– Q1)2 + …+ (Pn– Qn)2 ) (1)
In the present approach, the KNN algorithm has been coded using the Scikit-learn (Pedregosa et al., 2011) machine learning libraries. The designed program consists of two stages, the model training and the data test; both procedures are described in Algorithm 3, shown below.
Algorithm 3. KNN data classification process.
A data corpus of 5000 tweets is being used throughout the approach. The corpus of data is divided into two sets, the training set (3000 vectors), and the test set (2000 vectors). The training data have an initial classification label assigned at the
Information recovery methodology stage. This initial classification is needed since the KNN classification model takes into account the classification of the neighbours in order to classify the test samples.
After the classification model implementation, some precision metrics are applied over the results in order to measure the efficiency of the model.
The applied metrics are precision, recall and the average squared error. Once the obtained precision and recall measures have reached satisfactory results, the model is used to classify the test set, its precision metrics are also computed.
In the training and test sets, a ten-fold cross validation is used. By this technique, samples are divided into ten sets; each time a set is being classified, the nine remaining sets are considered as a training corpus.
The resultant classification labels are stored in the table
classified. The table classified has five fields: id, to have a control over the number of samples; processed_text_vector, the vector that represents the text for the treated registry; classification, where the KNN algorithm assigned class label is stored; and the
latitude and longitude coordinates of the place where the original tweet was posted.
3.4 Mapping
One of the purposes of the present approach is to identify the areas with more traffic, and the kind of vehicular events that causes it.
To represent the traffic in the study area, has been used a Mexico City’s map from OpensStreetMaps (OSM) (OSM Licence, 2017). Given that OSM is a volunteered geographic information system and the classified data are also VGI, it is possible to observe how VGI data can be obtained from different sources to satisfy specific purposes.
As mentioned above, the collected tweets have the coordinates of the place where they were posted, in the classified table such coordinates are transformed into a geometric point to represent the event as a point. By using the geospatial library for Postgres,
PostGIS (Postgis, 2017) the coordinates are merged into the geometric point to be mapped.
To show the different traffic classes, a set of maps have been designed considering tweets recovered the Monday 16 January 2016 between 8:00 a.m. and 10:00 a.m. posted in the study area. The events point representation and the study areas’ map were mapped together using the open source geospatial information system Quantum GIS (QGIS, 2017).
In Figure 2 the study areas’ map and some recovered traffic related tweets are shown, it is possible to see the interest of people in reporting the traffic conditions in the city at the studied time lapse.
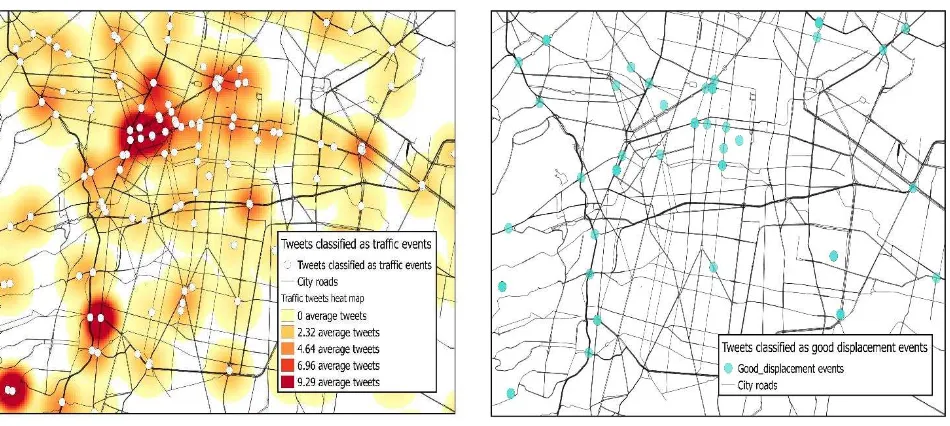
The map in Figure 3 shows the tweets classified as traffic events, the heat map let’s to analyse the city roads with more traffic problems and the areas where the movement of vehicles is not saturated. The red areas represent places where the traffic has caused bottlenecks and the vehicles start to stop, the lighter areas represent roads that people can use as an alternative to avoid traffic jams. The map shows that the main circulation problems in the city are located at the center and south regions.
In Figure 4, the tweets classified as accidents and closures events are mapped, comparing Figures 3 and 4 it is possible to see that some areas with a larger number of traffic events become a KNN classification process.
Input. Processed text vectors. K=10.
Stage 1: General model training.
1. The algorithm stores the instances of the training set vectors.
Stage 2: Data test.
1. The vectors of the test set are analysed. 2. The classification of each vector is computed
from a majority vote of its nearest neighbours. 3. A ten-fold cross validation is applied over the
data.
4. The vector’s class label is assigned.
5. The resultant class labels are compared with the initial classification labels assigned.
Output. Classification labels for the test data corpus. Input. The field cleaned_text of the registry.
1. A vector structure is created, its length is the same as the words dictionary.
2. The cleaned_text field of the registry is analysed. 3. In each vector position is stored the number of times that
each dictionary word appears in the cleaned_text field:
If a dictionary word appears n times in the registry’scleaned_text, the position for such word in the vector must have a frequency value of n.
If a dictionary word never appears in the registry’s
cleaned_text, its value at the words position in the vector must be zero.
Output. The vector is the numerical representation for the analysed registry.
closure area when the number of stopped cars increases. As it is presented in such figures, most of the situations that generate traffic at big cities occur at main roads, but the traffic expands all over the area; hence the importance to notify the whole traffic situation to citizens.
In Figure 5, tweets classified as good_displacement events are mapped. As it is seen, the good-displacement reports are less than the traffic reports, since the time lapse of the experiment matches with one of the time lapses with more vehicular movements on the study area; also, people is more interested in reporting traffic problems to express their angry or worry, than in reporting good displacement conditions.
Figure 2. Tweets related to traffic events in the study area.
Figure 3. Tweets classified as traffic events.
4. RESULTS AND STATISTICS
To test the methodology a corpus of 5000 tweets recovered from Twitter has been structured, the tweets have been processed to create numeric vectors that represent the tweets texts. Each vector
has been initially classified by analysing the words present on it by a text mining procedure.
Since each tweet has a vector representation, there has been created a 5000 vectors table. The vectors are divided into two groups, a training set of 3000 elements and a test set with 2000 elements. The initial classification is only considered for the training set.
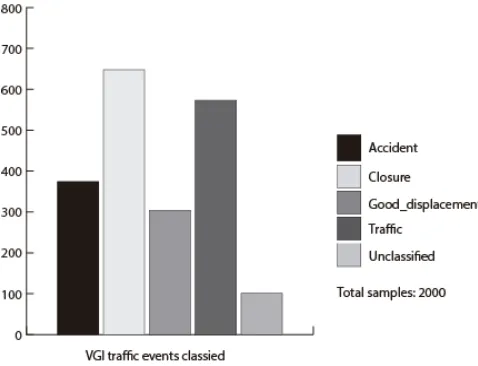
After the KNNclassification of the test set, it was obtained that, from the 2000 test elements, 374 of them are accidents, 648
closures, 304 good_displacement, 573 traffic, and 101 were
unclassified samples. In Figure 6, the proportional percentage for each class is shown.
Figure 4. Tweets classified as Accidents and Closure events.
Figure 5. Tweets classified as Good_displacement events.
The precision of the classification is 0.98, the recall is 0.93, the
F1-score is 0.69, the MAE is 0.73 and the MSE value is 1.76.
The Sci-kit learn Naïve Bayes (NB) algorithm was used to classify the test set used on the proposed methodology, in The International Archives of the Photogrammetry, Remote Sensing and Spatial Information Sciences, Volume XLII-4/W3, 2017
ordernto compare the classification results and the obtained precision metrics.
NB is chosen as a comparison basis since the algorithm is one of the most commonly used to classify short text as in the mail and SMS spam identification (Meyer & Wien, 2015). The main advantage of the Naïve Bayes classification algorithm over KNN, is that NB generates its own words dictionary and calculates the words frequency before the data classification; also, NB is able to work with words (Bishop, 2015).
In spite of its advantages, the NB algorithm throw up less accurate results. Its precision measure was 0.70 and its recall was 0.67; its F1-score was 0.69, and the MAE and MSE were 0.6076 and 1.7192 respectively.
Figure 6. Percentages of samples for each proposed traffic class obtained after the KNN classification procedure.
The present’s methodology obtained three important results:
A methodology to process text obtained from tweets which allows to classify them using a machine learning algorithm. Although the present approach performance has been proved by analyzing traffic related texts, it is possible to use it to analyze different topics which affect urban areas, such as pollution or the citizen’s feelings about specific topics.
A corpus of traffic related tweets in their original status, this means, in the same way as they were posted in the social network. This is a relevant product since there do not exist many specialized data corpus to apply different analysis over them.
A corpus of processed tweets where their text have been cleaned; such corpus is available to be processed for varied analysis whose main purpose is not to pre-process tweets.
A corpus of classified tweets that show common traffic events that occur in urban areas; this contribution importance lies in the information that can be inferred from such data, with a view to improve the urban movements of vehicles and citizens.
5. CONCLUSIONS
Since governments and science are concerned about improving the peoples’ life, the importance of urban dynamics has increased. Vehicular traffic is one of the factors that affect the most to cities. Every day people lose time and money when they are trying to move them through congested roads. Such traffic
jams are produced by different vehicular situations that can be studied in order to detect their characteristics, the places where they commonly occur, and what is more, by applying different analysis is possible to determine what causes them.
By the classification of traffic related short texts to analyse road problems in urban areas approach, a social media is consulted in order to acquire information about the vehicular situation in a studied city; the collected information can be considered as volunteer geographic information since the analysed posts are texts written by people that describe events occurring on their city and that share their coordinates.
After a text mining process and a machine learning classification, the posts are classified into five possible traffic groups that represent the events occurring on roads that commonly modify the normal movement of vehicles. The traffic events classes are:
good_displacement, traffic, closure, accident and unclassified.
The main approach’s contribution is the implementation of a machine learning classification method to work over VGI data, and its managing with a GIS. The proposed methodology merges text mining and machine learning procedures to make possible the analysis of VGI textual content. The machine learning algorithm chosen to classify the data is the KNN, the results obtained have a good precision rate. The algorithm has been compared with a Naïve Bayes classification procedure, one of the most used methods for texts classification (Lantz, 2013); the KNNclassification presented a better performance.
The results are mapped in the study area using a GIS; the cartography is part of a volunteered geographic information platform, which increases the importance of VGI sources for the present research. The mapping of the events is open to new data interpretations and analysis; its purpose in this investigation is to show the areas with more traffic problems and to detect the kind of vehicular events that commonly affect specific urban areas.
The results obtained by the methodology’s approach and the classification procedure implemented can be used in future researches with the purpose to classify some other urban events, and to make different data analysis.
ACKNOWLEDGEMENTS
This work was supported by the Science and Technology National Council in Mexico (CONACYT) [grant 447330], by the Instituto Politécnico Nacional and by the Researching and Postgraduate Secretariat (SIP) [projects 20171918 and 20171192].
REFERENCES
Bernstein, M. S., Bakshy, E., Burke, M., & Karrer, B. , 2013. Quantifying the invisible audience in social networks. In Proceedings of the SIGCHI Conference on Human Factors in Computing Systems (pp. 21-30). ACM.
Bishop, B. W., Moulaison, H. L., & Burwell, C. L., 2015. Geographic Knowledge Organization: Critical Cartographic Cataloging and Place-Names in the Geoweb. Knowledge Organization, 42(4).
Dey, P., & Roy, S., 2016. Social Network Analysis. Advanced Methods for Complex Network Analysis, 237.
Drakopoulos, J. , 2016. Bounds on the classification error of the nearest neighbor rule. In Proceedings of ICML (Vol. 95, pp. 203-208).
Fleming, L. E., Haines, A., Golding, B., Kessel, A., Cichowska, A., Sabel, C. E.,& Cocksedge, N., 2014. Data mashups: Potential contribution to decision support on climate change and health. International journal of environmental research and public health, 11(2), 1725-1746.
Foth, Marcus, 2009. Ed. Handbook of Research on Urban Informations: The Practice and Promise of the Real-Time City. New York: Information Science Reference (an imprint of IGI Global). Print.
He, J., Shen, W., Divakaruni, P., Wynter, L., & Lawrence, R. (2013, August). Improving Traffic Prediction with Tweet Semantics. In IJCAI (pp. 1387-1393).
Kindberg, Tim, Matthew Chalmers, and Eric Paulos, 2007. "Guest editors' introduction: Urban computing." IEEE Pervasive Computing 6.3:18-20.
Kunze, C., & Hecht, R., 2015. Semantic enrichment of building data with volunteered geographic information to improve mappings of dwelling units and population. Computers, Environment and Urban Systems, 53, 4-18.
Lansley, G., & Longley, P. A. (2016). The geography of Twitter topics in London. Computers, Environment and Urban Systems, 58, 85-96.
Lantz, B., 2013. Machine Learning with R. Packt Publishing Ltd.
Lin, W., 2013. Volunteered geographic information and networked publics? Politics of everyday mapping and spatial narratives. GeoJournal, 78(6), 949-965.
Meyer, D., & Wien, F. T., 2015. Support vector machines. The Interface to libsvm in package e1071.
OSM Licence., 2017. OpenStreetMap Foundation Wiki, Retrieved 21:43, June 30, 2017 from http://wiki.osmfoundation.org.
Paredes‐Valverde, M. A., Alor‐Hernández, G., Rodríguez‐ González, A., Valencia‐García, R., & Jiménez‐Domingo, E., 2015. A systematic review of tools, languages, and methodologies for mashup development. Software: Practice and Experience, 45(3), 365-397.
Pedregosa, F., Varoquaux, G., Gramfort, A., Michel, V., Thirion, B., Grisel, O., ... & Vanderplas, J. (2011). Scikit-learn: Machine learning in Python. Journal of Machine Learning Research, 12(Oct), 2825-2830.
Postgis, 2017. Retrieved march 29, 2017 from http://postgis.net/.
QGIS, 2017. Quantum GIS Development Team. Quantum GIS Geographic Information System. Open Source Geospatial Foundation Project. http://qgis.osgeo.org.
Real Time Rome, 2017. Retrieved march 29, 2017 from http://senseable.mit.edu/realtimerome.
Resch, B., Summa, A., Sagl, G., Zeile, P., & Exner, J. P., 2015. Urban emotions—Geo-semantic emotion extraction from technical sensors, human sensors and crowdsourced data. In Progress in Location-Based Services 2014 (pp. 199-212). Springer International Publishing.
Resch, B., Summa, A., Zeile, P., & Strube, M., 2016. Citizen-Centric Urban Planning through Extracting Emotion Information from Twitter in an Interdisciplinary Space-Time-Linguistics Algorithm. Urban Planning, 1(2), 114-127.
Ribeiro Jr, S. S., Davis Jr, C. A., Oliveira, D. R. R., Meira Jr, W., Gonçalves, T. S., & Pappa, G. L, 2012. Traffic observatory: a system to detect and locate traffic events and conditions using Twitter, In: Proceedings of the 5th International Workshop on Location-Based Social Networks (pp. 5-11). ACM.
Rudinac, Stevan, Jan Zahálka, and Marcel Worring, 2017. Discovering Geographic Regions in the City Using Social Multimedia and Open Data. International Conference on Multimedia Modeling. Springer, Cham.
Salazar, J.C., Torres-Ruiz, M., Davis, C., Moreno-Ibarra, M., 2015. Geocoding of traffic-related events from Twitter. Conference paper.
Sidorov, G., 2013. Construcción no lineal de ngramas en la lingüística computacional: n-gramas sintácticos, filtrados y generalizados. Sociedad Mexicana de Inteligencia Artificial. ISBN 978-607-95367-9-4.
Thesaurus, 2017. Retrieved March 19, 2017 from http://www.thesaurus.com.
Twitter, 2017. Retrieved March 7, 2017 from https://twitter.com. Waze, 2017. Retrieved March 29, 2017 from https://www.waze.com.
Wolpert, D. H., & Macready, W. G. (1995). No free lunch theorems for search (Vol. 10). Technical Report SFI-TR-95-02-010, Santa Fe Institute.
Yang, L., Dong, L., & Bi, X., 2016. An improved location difference of multiple distances based nearest neighbors searching algorithm. Optik-International Journal for Light and Electron Optics, 127(22), 10838-10843.
Zhao, L., Chen, F., Lu, C. T., & Ramakrishnan, N. (2016). Online Spatial Event Forecasting in Microblogs. ACM Transactions on Spatial Algorithms and Systems (TSAS), 2(4), 15.
Zheng, Y., Wenchao, W. U., Chen, Y., Qu, H., & Ni, L., 2016. Visual Analytics in Urban Computing: An Overview.
Zhong, J. T., & Ling, S., 2015. Key Factors of K-Nearest Neighbours Nonparametric Regression in Short-Time Traffic Flow Forecasting. In Proceedings of the 21st International Conference on Industrial Engineering and Engineering Management 2014 (pp. 9-12). Atlantis Press.