1
Majalah Rimba Indonesia Vol. 65, April 2020. ISSN 0035-S 372
pp. 15-25. https://rimbaindonesia.id
INTEGRATED WATERSHED MANAGEMENT:
SUATU LOMPATAN IDE DAN AKSI DALAM BIDANG LHK TERINTEGRASI
Oleh:
Prof. Dr. Ir. John FoEh, IPU
Dosen Universitas Gunadarma.
RSPP - Jakarta, 1 April 2020
1. Suatu Pendekatan Lama Yang Tidak Pernah Benar Dimplementasikan di
Lapangan.
Ada beberapa alasan mengapa demikian, antara lain karena; pengelolaan
sumberdaya alam dan lingkungan hidup tidak didekati dari satuan ekosistem
ysng saat ini dinal dengan KPH (Kesatuan Pemangkuan Hutan,) tetapi terlalu
lama menggunakan satuan administrasi wilayah (kabupaten, provinsi, dsb)..
Berikutnya, Kondisi wilayah atau Kawasan Timur Indonesia umumnya didominasi
topografi sedikit datar, berbukit sampai bergunung serta terjadi tumpang tindih
penggunaan lahan (overlapping land use). Pengelolaan tidak dimulai dari daerah
hulu, tengah sampai hilir yang pada gilirannya masuk ke ekosistem maritim.
Berdasarkan konflik lahan yang sds msks pemerintan melakukan penataan ulang
melalui konsep TORA yang melibatkan berbagai pihak.
2. Beberapa pengertian
Daerah Aliran Sungai (DAS) adalah suatu wilayah daratan yang merupakan
satu kesatuan ekosistem dengan sungai dan anak-anak sungainya yang
berfungsi menampung, menyimpan, dan mengalirkan air yang berasal dari curah
hujan ke danau atau laut secara alami, yang batas di darat merupakan pemisah
topografis dan batas di laut sampai dengan daerah pengairan yang masih
terpengaruh aktivitas daratan. (UU No 7/2004 Ps 1)
Pengelolaan DAS (PDAS) atau watershed management adalah upaya manusia
dalam mengendalikan hubungan timbal balik antara aktivitas manusia dengan
sumberdaya alam (terutama lahan, vegetasi dan air) di dalam DAS untuk
mendapatkan manfaat barang dan jasa sekaligus menjaga kelestarian DAS
serta meningkatkan kesejahteraan masyarakat.
3
Gambar 2. Bentuk DAS dan SUB DAS
SUB DAS
DAS LAIN
SUB DAS
SUB DAS
DAS
WILAYAH DARATAN DIBAGI HABIS DALAM WILAYAH DAS/SUBDASDaerah Aliran Sungai (DAS)
[Watershed, catchment area, river basin]
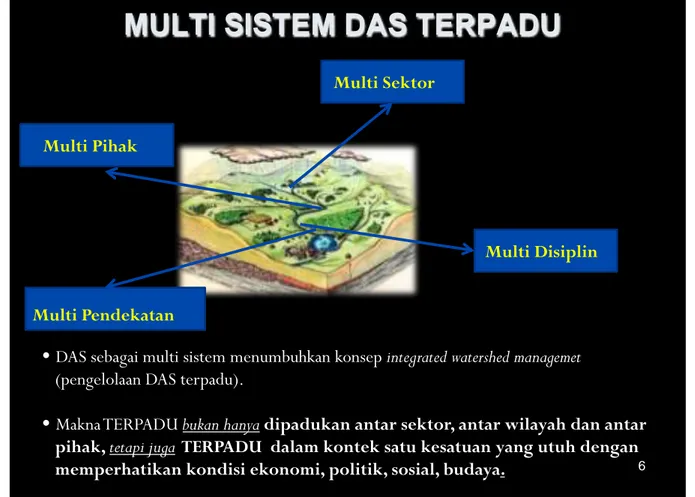
Gambar 4. Multi sistem DAS terpadu
MULTI SISTEM DAS TERPADU
Multi Sektor
Multi Disiplin
Multi Pendekatan
Multi Pihak
•
DAS sebagai multi sistem menumbuhkan konsep integrated watershed managemet
(pengelolaan DAS terpadu).
•
Makna TERPADU bukan hanya dipadukan antar sektor, antar wilayah dan antar
pihak, tetapi juga TERPADU dalam kontek satu kesatuan yang utuh dengan
5
Gamabr 5. Model pengelaan DAS yang diharapkan.
3. Beberapa Karakteristik DAS yang Ideal
INTEGRATED WATERSHED
MANAGEMENT:
And Old Approach which Never Been
Completly Implemented in the Field
Permasalahn pengelolaan DAS di Indonesia; sering terjadi banjir dan kekeringan,
degradsi hutan dan lahan, tanah longsor dan sedimentasi di sungai, saluran,
waduk dan danau. Akibatnya, terjadi pencemaran air dan lain-lain. Hal ini
umumnya terjadi karena dana pemerintah yang terbatas, tingkat prndapatn dan
parrisasi masyakat yang rendah, terjadi konflik kepentingan di hulu dan hilir DAS
serta keterpaduan antar sektor dan antar instansi yang lemah.
4. Mengapa Perlu Pengelolaan DAS Terpadu?
Adanya keterkaitan kegiatan antar multi sektor, melibatkan berbagai disiplin ilmu
seperti; kehutanan, pertanian, perkebunan, PUPR dan kelistrikan, sosial,
ekonomi, kesehatan maupun industri. Masalah lain adalah batas DAS tidak
selalu cocok dengan wilayah administrasi. Padahal pengelolaan terintegrasi
berakibat pada; efisiensi produksi, pengelolaan LH, dan pembangunan manusia.
Dengan demikian akan terjadi efisiensi sumberdaya dan produksi yang optimal.
Pada gilirannya akan ada interaksi hulu-hilir sehingga perlu koordinasi,
Pengelolaan DAS harus diselesaikan lintas bagian dan lintas sektor.
Tujuan pengelolaan DAS secara terpadu adalah; Terwujudnya kondisi tata air
DAS yang optimal meliputi jumlah, kualitas dan distribusi ruang dan waktu serta
terwujudnya kondisi lahan yang produktif sesuai daya dukung dan daya tampung
Karakteristik DAS
yang
Ideal
Mampu memberikan produktivitas lahan yang tinggi
Mampu menjamin kelestarian DAS (menjamin produktivitas yg tinggi, erosi/sedimen yg rendah, & fungsi DAS sebagai penyimpan air dapat memberikan “Water yield” yang cukup tinggi dan merata sepanjang tahun) Mampu menjaga adanya pemerataan pendapatan petani (equity) Mampu mempertahankan kelestarian DAS terhadap goncangan yang terjadi (recilient).
Sumber : Sinukaban (1994) 1 2 3 4 7
7
DAS. Pada akhirnya diharapkan terjadi peningkatan kesejahteraan masyarakat.
Untuk mewujudkan tujuan tsb diperlukan koordinasi, integrasi, sinkronisasi dan
sinergi antar multipihak dalam pengelolaan DAS.
Untuk itu ada dua syarat mutlak yang dibutuhkan yakni; Pengelolaan DAS harus
secara terpadu karena mencakup keterkaitan berbagai unsur ekosistem, lintas
daerah administratif dan melibatkan banyak stakeholder (pemerintah, swasta
dan masyarakat, dll). Berikutnya, rencana Pengelolaan DAS Terpadu bukan
rencana sektor kehutanan saja, tetapi sebagai rencana jangka panjang para
pemangku kepentingan dalam DAS, karena itu penyusunannya harus dilakukan
secara partisipatif sehingga akan meningkatkan rasa kepemilikan dan komitmen
para pihak untuk melaksanakannya sesuai perannya masing-masing. Diharapkan
ke depan KPH sebagai unit manajemen terdepan dapat menerapkan pola ini.
Dngan demikian maka diperlukan suatu model pengelolaan DAS terpadu seperti
Gambar .. berikut ini.
Gambar .. Integrated Watershed Management.
Untuk dalam pengelolaan KPH (Forest Management Unit) ke depan dibuhkan
Kepala KPH atau apapun sebutannya memiliki kemampuan teknis kehutanan
ditambah kemampuan membuat rencana bisnis (business plan) yang pada
gilirannya dapat menlindungi hutan dan DAS, membangun masyarakat
(community development), memperhatikan peranan hutan adat, pengembangan
hasil hutan bukan kayu dan tanaman kehidupan lain seperti kopi, durian, dukuh
AN INTEGRATED
WATERSHED MODEL
dan berbagai jenis buah-buahan lainnya. Pola hutan kemasyarakatan dan
agroforestry (tumpang sari) layak untuk dikembangkan termasuk outdoor
recreation,
produksi
handycraft,
pembuatan
arang
briket,
perikanan,
pengembangan produksi ternak seperti sapi dan kambing dan lain sebagainya
menjadi hal yang penting. Untuk itu, sekali lagi diperlukan kerjasama berbagai
pihak. Gambar .. berikut diharapkan ke depan menjadi sebuah model bisnis
terpadu.
Gambar .. Pengelolaan DAS terpadu dan Pengembangan bisnis serta community
develpoment.
Pada gilirannya akan memberikan dampak seperti Gambar .. berikut ini.
9
Gambar
5. Pengembangan Business Plan dalam KPH.
Untuk membangun rencana bisnis dalam KPH maka hal-hal berikut menjadi
sangat penting seperti; dukungan modal dan investasi, manajemen sumberdaya
manusia, skill and good mindset, teknologi, infrastruktur, aksesibiltas yang
memadai untuk akses ke industri dan pemasaran baik hasil hutan maupun
produk lain termasuk jasa lingkungan, seperti yang tampak pada Gambar ..
berikut ini.
DAMPAK TERHADAP PEREKONOMIAN
MASYARAKAT DAN DAERAH
Gambar .. Rencna pengembangan KPH dengan bisnis terpadu.
Untuk kepentingan bisnis terintegrasi dengan model KPH yang akan
dikembangkan maka dibutuhkan rumusan visi, misi serta tujuan yang jelas,
seperti contoh berikut.
VISI: Terciptanya Unit-unit Usaha Ekonomi Poduktif sebagai bagian integral dari
Pembangunan Ekonomi Indonesia yang produktif dan terintegrasi dalam
menudukung perekonomian daerah dan nasional dalam 10 tahun.
MISI :
1. Memanfaatkan lahan-lahan tidur (bare land) dan lahan potensial sebagai
kawasan Agribisnis dan Agroindustri Terintegrasi
2. Mengembangkan berbagai SBU (strategic business unit) dalam bidang SDA
dan LH
3. Meningkatkan kesejahteraan masyarakat dan peningkatan ekonomi nasional
lewat UKM dalam sektor Agrokompleks
TUJUAN : Diharapkan bahwa pada setidaknya dalam tahun 2025 telah terjadi:
Difersifikasi kegiatan bisnis berbasis SDA, Agribisnis, pariwisata, pendidikan
dan kesehatan yang dilengkapi dengan pengembangan industri
11
Terbentuknya berbagai SBU’s (Strategic Business Units) yang profitable dan
kompetitif di Indonesia.
Pola penyusunan rencana bisnis dalam KPH dapat mengikuti Gambar .. berikut
ini.
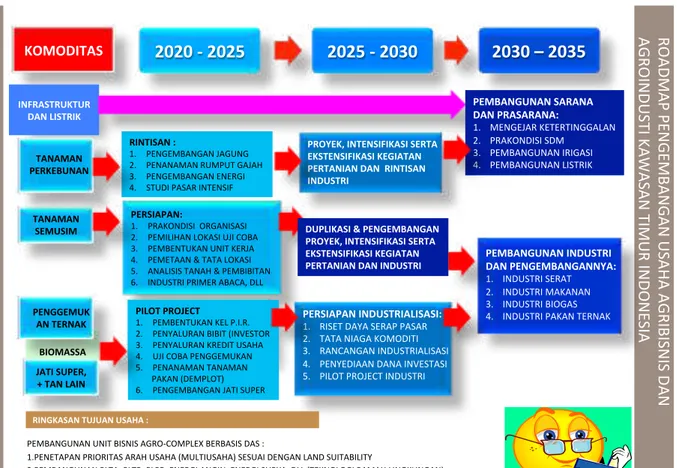
Gambar .. Road Map Pengembangan Agibisnis dan Agroindustri dalam KPH
Tiap kegiatan harus mempunyai BUSINESS PLAN tersendiri dan sedapat
mungkin dikelola sebagai suatu unit bisnis strategik tersendiri (SBU). Dengan
demikian maka Business Plan should be:
“Ideas for Today and Tomorrow” although. All business activities should be
planned under a Strategic Business Unit (SBU’s)
Business Plan harus merupakan :
•
“Blue print” untuk membangun suatu bisnis yang sukses
•
Suatu refleksi tentang kemampuan manajerial atas bisnis yang dijalankan.
•
BP mengidentifikasi hal-hal berikut : Apa? Mengapa? Di mana? Berapa
banyak ? Oleh siapa? Serta bagaimana mengerjakannya ?
•
BP membantu dalam upaya perolehan finansial untuk menjalankan bisnis
dimaksud, baik dari lembaga donor, dana penelitian Litbanghut, Perguruan
Tinggi setempat termasuk national and International NGO.
BIOMASSA RO AD MA P P EN G EMB AN G AN U SA HA A G RIB IS N IS D AN AG RO IN D U ST I K AW AS AN TIMU R IN D O N ES IA
2020 - 2025
2025 - 2030
2030 – 2035
PENGGEMUK AN TERNAK PERSIAPAN: 1. PRAKONDISI ORGANISASI 2. PEMILIHAN LOKASI UJI COBA 3. PEMBENTUKAN UNIT KERJA 4. PEMETAAN & TATA LOKASI 5. ANALISIS TANAH & PEMBIBITAN 6. INDUSTRI PRIMER ABACA, DLL PEMBANGUNAN INDUSTRI DAN PENGEMBANGANNYA: 1. INDUSTRI SERAT 2. INDUSTRI MAKANAN 3. INDUSTRI BIOGAS 4. INDUSTRI PAKAN TERNAK KOMODITAS PROYEK, INTENSIFIKASI SERTA EKSTENSIFIKASI KEGIATAN PERTANIAN DAN RINTISAN INDUSTRI TANAMAN SEMUSIM INFRASTRUKTUR DAN LISTRIK JATI SUPER, + TAN LAIN PERSIAPAN INDUSTRIALISASI: 1. RISET DAYA SERAP PASAR 2. TATA NIAGA KOMODITI 3. RANCANGAN INDUSTRIALISASI 4. PENYEDIAAN DANA INVESTASI 5. PILOT PROJECT INDUSTRI PILOT PROJECT 1. PEMBENTUKAN KEL P.I.R. 2. PENYALURAN BIBIT (INVESTOR 3. PENYALURAN KREDIT USAHA 4. UJI COBA PENGGEMUKAN 5. PENANAMAN TANAMAN PAKAN (DEMPLOT) 6. PENGEMBANGAN JATI SUPER RINGKASAN TUJUAN USAHA : PEMBANGUNAN UNIT BISNIS AGRO-COMPLEX BERBASIS DAS : 1. PENETAPAN PRIORITAS ARAH USAHA (MULTIUSAHA) SESUAI DENGAN LAND SUITABILITY 2. PEMBANGUNAN PLTA, PLTB, PLPB, ENERGI ANGIN, ENERGI SURYA, DLL (TEKNOLOGI RAMAH LINGKUNGAN) 3. PEMANFAATAN LAHAN TIDUR DAN LAHAN POTENSIAL UNTUK AGRIBUSINESS DAN AGROINDUSTRY 4. PENINGKATAN KEUNTUNGAN PERUSAHAAN, KESEJAHTERAAN MASYARAKAT SEKITAR DAN STAKEHOLDERS TERKAIT RINTISAN : 1. PENGEMBANGAN JAGUNG 2. PENANAMAN RUMPUT GAJAH 3. PENGEMBANGAN ENERGI 4. STUDI PASAR INTENSIF 50 TANAMAN PERKEBUNAN PEMBANGUNAN SARANA DAN PRASARANA: 1. MENGEJAR KETERTINGGALAN 2. PRAKONDISI SDM 3. PEMBANGUNAN IRIGASI 4. PEMBANGUNAN LISTRIK DUPLIKASI & PENGEMBANGAN PROYEK, INTENSIFIKASI SERTA EKSTENSIFIKASI KEGIATAN PERTANIAN DAN INDUSTRIUntuk itu diperlukan pemahaman bersama tentang konsep dasar rencana bisnis
sebagai berikut:
1. Gambaran umum mengenai berbagai bisnis usahatani dan industri pertanian
terpadu.
2. Bagaimana bisnis mampu menciptakan dan mempertahankan pelanggan
3. Prediksi finansial yang menggambarkan tingkat keuntungan yang akan
diperoleh.
Berikut beberapa fakta penting:
•
Kekuasaan bisnis saat ini sudah beralih ke tangan konsumen
•
Skala produksi yang besar tidak lagi merupakan keharusan
•
Batas-batas wilayah, bahkan negara tidak lagi menjadi kendala
•
Teknologi dengan cepat dapat dikuasai dan ditiru
•
Setiap saat akan muncul pesaing-pesaing dengan biaya lebih murah
•
Teknologi informasi mengalami revolusi secara cepat
•
Pengaruh globalisasi yang tidak terhindarkan.
Untuk semua itu: diperlukan data dan informasi yang akurat dengan bersumber pada
satu peta perencanaan (TORA?) yang baru dan sah menurut berbagai stakeholders.
Nampaknya berat memang, tapi harus dimulai. Jika tidak akan mengulangi
persoalan yang sama dari waktu ke waktu, siapapun pemimpinnya. Gambar berikut
merupakan motivasi bagi kita semua.
13
Gambar .. Motivasi berusaha.
Selanjutnya terserah kita semua terutama bagi mereka yang berada pada posisi
sebagai “decision maker”. Mudah-mudahan tulisan ini memberikan pencerahan
bagi kita semua.
Sumber Bacaan:
FoEh John, 2016.
Strategic Business Unit Sebagai Suatu Model Pelibatan
Masyarakat Dalam Pengembangan Konsep KPH
__________, 2018. Methodological Approach in Estimating the Demand for
Recreational sites. Paper presented at the International Workshop Academic
and Cultural Collaboration: Shamarkand Institute of Economics and Service.
Shamarkand
–
Uzbekistan,
7th
May
2018.
Published
in
https://doi.org/10.35760/eb.2018.v23i1.1809
FoEh John dan Shakti Sipalma, 2018 . Pengaruh tingkat inflasi, nilai tukar dan PDB
terhadap Investasi Langsung Asinglangsung pada negara-negara ASEAN
periode 2007-2016. 3
rdICRMB (International Conference on Research and
Management and Busines. Hotel Illira, 11 Desember, 2018, Banyuwangi.
Ni Kadek Suryani dan John FoEh, 2018. Kinerja Organisasi. Penerbit Deeppublish
Yogyakarta. ISBN : 978-602-475-764-9
FOKUSKAN PADA
BUNGANYA
BUKAN PADA
DURINYA
LIHAT PROSPEK HAMBATAN & RESIKO 58_____________________________________, 2019. Manajemen Sumberdaya Manusia: Tinjauan
Praktis Aplikatif. Penerbit Nilacakra, Denpasar. ISBN (P) 978-623-7352-09-9
_____________________________________, 2019. Impact of Organizational Justice on
Organizational Performance in the Hospitality Industry. Journal of Engineering
and Applied Sciences; Vol. 14/ Issue 12/pp. 4124-4131. Terindex Scopus.
Sinukaban, Naik, 2015. Pembangunan DAS Tak Terintegrasi Menyebabkan
Maraknya Musibah. CNN Jakarta. Professor IPB, Bogor.
Viktoria I. Zoltay, A.M.ASCE1 ; Richard M. Vogel, M.ASCE2 ; Paul H. Kirshen, M.ASCE3
; and Kirk S. Westphal, M.ASCE4, 2010. Integrated Watershed Management
Modeling: Generic Optimization Model Applied to the Ipswich River Basin. 566 /
Journal of WaterResources Planning and Management © ASCE / September/October
SEPTEMBER/OCTOBER 2010.
JBK
Jurnal Bisnis & Kewirausahaan Volume 16, Issue 1, 2020 ISSN (print) : 0216-9843 ISSN (online) : 2580-5614
Homepage : http://ojs.pnb.ac.id/index.php/JBK
65
The Impact of Liquidity and Profitability on Firm Value With Dividend
Policy as An Intervening Variable
(Empirical Study of Manufacturing Companies in The Pharmaceutical
Sub Sector Listed on The Indonesia Stock Exchange in 2013-2017)
Dian Kristianti1, John E. H. J. Foeh2
1,2Faculty of Economics, Gunadarma University, Indonesia 1e-mail: diankris41@gmail.com
Abstract. The purpose of this research is to know the description of corporate value and the influence of liquidity and profitability to firm value with dividend policy as intervening variable of pharmaceutical sub sector manufacturing companies listed in Indonesian Stock Exchange from 2013 until 2017. Liquidity in this research is measured by using current ratio (CR), profitability is measured by return on equity (ROE), dividend payout ratio (DPR), and firm value measured by price to book value (PBV). This research uses secondary data obtained from pharmaceutical sub-sector manufacturing companies listed in Indonesia Stock Exchange. Data analysis method uses Quantitative Descriptive Analysis, Multiple Linear Regression Analysis and Path Analysis. Data is processed using SPSS data analysis package software version 24.0. The overall conclusion is liquidity and profitability simultaneously or partially have a positive and significant effect on dividend policy, while liquidity, profitability, and dividend policy simultaneously have a positive and significant effect to firm value. But partially liquidity and profitability have a negative and significant effect to firm value, while dividend policy has a positive and significant effect to firm value. And, dividend policy is able to mediate the influence of liquidity and profitability to the value of pharmaceutical sub-sector manufacturing companies listed in Indonesia Stock Exchange.
Keywords: firm value, liquidity, profitability and dividend policy
PENDAHULUAN
Company publicly traded is a company that sells shares to investors who traded in the stock market. The main purpose of a company going public is to increase the prosperity of the owner or shareholders through increasing the value of the company. According to Jariah (2016: 108), in his research stated that the value of the company can prosper the maximum shareholders if the share price rises. The higher the stock price, the higher the value of the company. The high value of the company becomes the desire of the owners of the company, because the high value indicates the higher the prosperity of the shareholders.
Several factors can affect the value of the company include liquidity, profitability and dividend policy. Liquidity is the company's ability to pay the company's short-term obligations. Companies that have good liquidity will be considered to have good performance by investors. Liquidity can be measured by Current Ratio, which illustrates how much the current availability of the company's assets compared to the total current liabilities (Hery, 2015: 152). According to Prisilia (2013: 261) in his research revealed that liquidity affects the value of the company.
66
corporate efficiency as well, so that good company performance is seen. In this study the profitability ratio is measured by return on equity (ROE). ROE is a ratio that shows how much the company's ability to generate net income for return of equity to shareholders. According to (Mardiyati et al., 2012: 16) Profitability has a significant positive effect on firm value.
Dividend policy is the company's financial decision whether the profits obtained will be distributed to shareholders or retained as retained earnings. Dividends distributed are usually presented in Dividend Payout Ratio (DPR). DPR is what determines the amount of dividend per share. Sugiarto (2011: 21) and Fenandar (2012: 7) states that dividend policy has a significant positive effect on firm value.
Liquidity and profitability have an important role in dividend policy, where this policy can maximize the value of the company. Therefore, based on the relationship between liquidity and profitability with dividend policy, this study determined dividend policy as an intervening variable that mediates the relationship between profitability and liquidity on firm value.
Research on organization esteem has been done previsously by Ria Nofrita (2013) with the title impact of benefit on firm an incentive with profit arrangement as a mediating variable (exact investigations on assembling organizations recorded on the Indonesia Stock Exchange). Result of study show that productivity and profit approach have a noteworthy beneficial outcome on firm worth, while the impact of profitability on devidend policy is not significant.
Based on the above description, this study aims to determine the factors that influence the value of the company, the factors are liquidity, profitability and deviden policy.
LITERATURE STUDY AND HYPOTHESIS Corporate Value
High company value can increase prosperity for shareholders, so shareholders will invest their fund in the company (Hemastuti, 2014: 3). There are several methods that could measure the company value such as Price to Book value (PBV), liquidity, profitability, and dividend policy. Company value is measured by using PBV (Price to Book Value) measured by the formula as follows (Fahmi, Irham. 2015):
PBV = Market Price per Share Book Value per Share
Liquidity, according to Hery (2015: 142), a liquidity ratio is a ratio that shows a company's ability to meet its short-term obligations. This ratio is used to measure to what extent the company's ability to pay off short-term obligations that will soon be due.
According to Mangasa Simatupang (2010:58), the current ratio is the ratio that illustrates the company's ability to meet short-term needs, namely by comparing current assets with current debt or short-term debt. The formulated by Kasmir (2020) as follows :
Current Ratio = Current Assets Current Liabilities
Profitability, according to Hery (2015: 192), profitability ratios are ratios to measure a company's ability to generate profits from its normal business activities. This ratio also aims to measure the effectiveness of management in carrying out company operations.
According to Mangasa Simatupang (2010: 55), return on equity (ROE) is a ratio that describes a company's ability to generate profits from its own capital. The formuated by Kasmir (2010) as follows:
Dian Kristianti, dkk
The Impact Of Liquidity And Profitability On Firm Value With Dividend Policy As An Intervening Variable (Empirical Study Of Manufacturing Companies In The Pharmaceutical Sub Sector Listed On The Indonesia Stock Exchange In 2013-2017)
67
ROE = Earning After Interest and Tax Equity
Dividend policy includes decisions regarding whether profits will be distributed to shareholders or will be retained for reinvestment in the company (Kamaludin and Indriani, 2012: 330).
Dividend payout ratio (DPR) is the ratio between dividends distributed compared to earnings per share obtained by the company (Mangasa, 2010: 39). Fahmi (2015) formulated as follows:
DPR = Dividend per Share Earning per Share
Previous Research
Research by Anak Agung Ayu Tisna Wulan Dewi, and Ni Gst. Putu Wirawati (2018) entitled "The Effect of Profitability on Company Value with Corporate Social Responsibility as Intervening Variables". The results showed that only profitability had a positive effect on firm value, whereas CSR did not. The profitability variable has a positive effect on CSR, and the role of CSR is not found to mediate the effect of profitability on firm value.
Windi Diswani's research (2012) entitled "The Effect of Capital Structure and Profitability on Firm Value with Dividend Policy as Intervening Variables in Companiesin the Included Jakarta Islamix Index 2007-2010". The results showed that: (1) Profitability had a positive and significant effect on dividend policy. (2) Capital structure has a negative and not significant effect on firm value. (3) Profitability has a positive and significant effect on firm value. (4) Dividend policy has a positive and significant effect on company value. (5) The results of this study cannot show that dividend policy can mediate a causal relationship between profitability and firm value. Thus, the effect of profitability on firm value is direct.
Hypothesis
Liquidity Against Corporate Value
Liquidity shows the ability of a company to fulfill its financial obligations which must immediately be fulfilled or when billed. Research (Prisilia, 2013: 261) liquidity has a positive and significant effect on firm value.
H1: Liquidity has a positive effect on company value
Profitability on Corporate Value
High profitability reflects the company's ability to generate high returns for shareholders. Research (Mardiyati et al., 2012: 16) the effect of profitability variables on firm value was found to have a positive and significant effect on manufacturing companies listed on the Indonesia Stock Exchange (BEI) for the period 2005-2010.
H2: Profitability has a positive effect on company value
Liquidity of Dividend Policy
According to Mardiyanto (2009: 54) liquidity measures the company's ability to pay off short-term obligations (debt) on time, including paying off the portion of long-term debt that falls due in the year concerned. The results of Nufiati's research (2015: 16) show that liquidity has a significant influence on cash dividends in pefindo companies 25.
H3: Liquidity has a positive effect on dividend policy
68
research conducted by Parica, et al (2013: 11) show that profitability has a significant influence on dividend policy.
H4: Profitability has a positive effect on dividend policy
Dividend Policy on Corporate Values
According to (Martono and Harjito, 2005: 2) in Susanti (2010: 16) states that the value of the company can be seen from the company's ability to pay dividends. If the dividend paid is high, then the stock price will tend to be high so the value of the company is also high, and vice versa. The ability to pay dividends is closely related to the company's ability to make a profit. If the company gets a large profit, then the ability to pay dividends will also be large.
H5: Dividend policy has a positive effect on firm value.
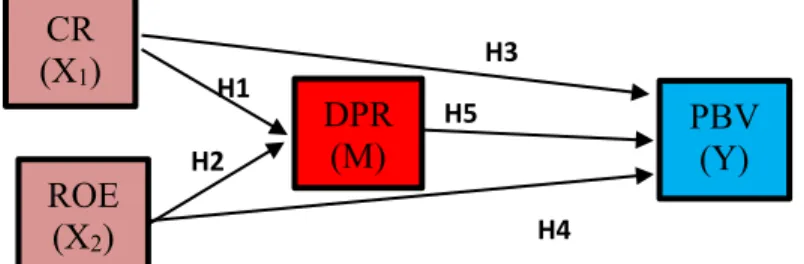
Figure 1. Research Model (Conceptual Framework)
RESEARCH METHOD
Type of research is quantitative descriptive, and is a causality research which means there is a relationship between two or more variables. The population were all pharmaceutical sub-sector manufacturing companies listed on the Indonesia Stock Exchange (IDX) in 2013-2017. Sampling is based on purposive sampling. Considerations as a sample selection criteria are as follows:
1. The pharmaceutical company is a company that has gone public and is listed on the Indonesia Stock Exchange in 2013-2017 which lists complete data consecutively during the study period.
2. The company published quarterly financial statements and ratios needed on the Indonesia Stock Exchange for 5 consecutive years from 2013-2017.
3. The company's financial statements have a financial year ending December 31.
Based on the sample criteria used in the study, a sample of 5 companies was obtained. Data used are secondary data. Secondary data in this study are in the form of current ratio (CR), return on equity (ROE), dividend payout ratio (DPR), and price to book value (PBV), where these data are sourced from the financial statements of pharmaceutical sub-sector manufacturing companies listed on the Indonesia Stock Exchange for the period 2013-2017. Data collection methods used literature study and documentation.
Exogenous variables in the path model are all variables that have no explicit causes or in the diagram there are no arrows in their direction, other than in the measurement error section,
CR
(X
1)
DPR
(M)
PBV
(Y)
ROE
(X
2)
H1 H2 H3 H4 H5Dian Kristianti, dkk
The Impact Of Liquidity And Profitability On Firm Value With Dividend Policy As An Intervening Variable (Empirical Study Of Manufacturing Companies In The Pharmaceutical Sub Sector Listed On The Indonesia Stock Exchange In 2013-2017)
69
(Sarwono & Suhayati, 2010). In this study who become independent variables including: Liquidity (X1) and Profitability (X2).
The dependent variable is a variable that includes an intermediate variable and a dependent/ dependent variable (Sarwono & Suhayati, 2010). The dependent variable in this study is dividend policy and firm value.
Intervening variable (M) is a variable located between the independent variable and the dependent variable, so that the independent variable does not directly explain or influence the dependent variable. And the intervening variable in this research is dividend policy.
Statistical analysis is a statistic used to analyze data by describing or describing data that has been collected as it is without intending to make conclusions that apply to the public or generalization (Sugiyono, 2016: 207).
TEST METHOD
Classical Assumption Normality Test
This test aims to test whether in the regression model, confounding or variables residual have a normal distribution (Ghozali, 2018: 161). Normality testing in this study is used by looking at the value of 2-tailed significant. If (sig)> 5%, it can be concluded that Ho is accepted, so the data is normally distributed and if (sig) <5%, then Ho cannot be accepted so the data is not normally distributed.
Multicollinearity Test
This test aims to test in the regression model whether there is a correlation between independent variables (Ghozali, 2018: 107). Testing of the possibility of multicollinearity can be seen by using themethod Tolerance Value or Variance Inflation Factor (VIF). The value commonly used to indicate the presence of multicollinearity is a tolerance value <0.10 or equal to VIF> 10.
Autocorrelation
This test test aims to test whether in the linear regression model there is a correlation between the error of the intruder in the t period and the error of the intruder in the t-1 period previous). If there is a correlation, then there is a problem called autocorrelation (Ghazali, 2018: 111). To test the presence or absence of autocorrelation using the Durbin-Watson test (DW test). The Durbin Watson (DW) number for detecting autocorrelation is: (1) A DW number below -2 means there is a negative autocorrelation. (2) A DW number between -2 to +2 means there is no correlation. (3) DW numbers above +2 mean there is a positive correlation.
Heteroscedasticity Test
Test aims to test whether in the regression model there is an inequality of variance from the residuals of one observation to another. A good model is homocedasticity or heteroscedasticity does not occur (Ghozali, 2018: 137), to detect the presence or absence of heteroscedasticity is to look at the plot graph between the predicted predictive value (ZPRED) and the residual (SRESID) where the Y axis is Y which has been predicted and the X axis is the residual (Y-Y predictions actually) that has distandardized.
Multiple Linear Regression Analysis
Regression aims to examine the relationship between one variable with another variable. Multiple linear regression equation:
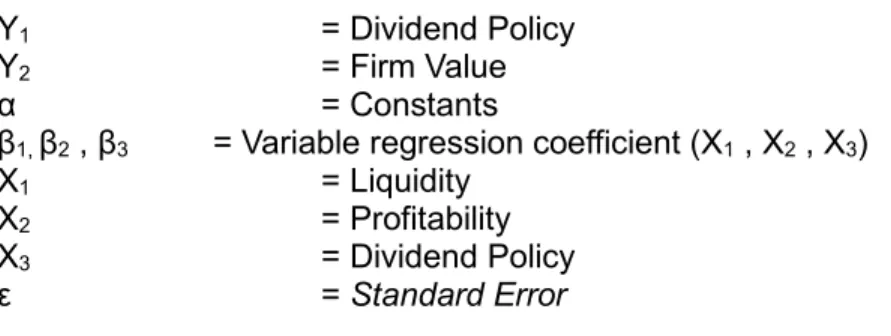
Description: Y1 = α + β1X1 + β2X2 + ε Y2 = α + β1X1 + β2X2 + β3X3 + ε
70
α = Constants
β1, β2 , β3 = Variable regression coefficient (X1 , X2 , X3)
X1 = Liquidity
X2 = Profitability
X3 = Dividend Policy
ε = Standard Error
Simultaneous Test (F-test)
According to Tri Basuki and Prawoto (2016: 87), Statistical Test F is used to determine whether all independent variables together have a significant influence on the dependent variable tested at the 0.05 significance level.
Partial Test (t-test)
According to Ghozali (2018: 98), t test basically shows how far the influence of one explanatory or independent variable individually in explaining the variation of the dependent variable tested at the 0.05 significance level.
The coefficient of determination (R2)
The coefficient of determination was essentially measure how far the model's ability to explain the variation of the dependent variable (Ghozali, 2018: 97).
Path Analysis
Pathway analysis is an extension of the multiple linear regression analysis, or analysis of the track is the use of regression analysis to estimate the causal relationships between variables (causal models) predetermined based on the theory (Ghozali, 2018: 245).
DISCUSSION
Descriptive Statistics
Table 1. Summary of Company Values
No. Company Object Description 2013-2017 1. PT. Darya Varya Laboratoria Tbk Decreased
2. PT. Kimia Farma (Persero) Tbk Increased 3. PT. Kalbe Farma Tbk Decreased 4. PT. Merck Tbk Increases 5. PT. Tempo Scan Pacific Tbk Decreases
Classic Assumption Test Normality Test
Table 2. Results of Normality
TestingTest Asymp. Sig Hypothesis I 0.927
Hypothesis II 0.185
Source: Secondary data processed with SPSS output 24.0
From the table of normality test results with Kolmogorov-Smirnov values obtained asymp test significance level. Sig (2-tailed) in hypothesis 1 is 0.927, while the Asymp value. Sig (2-tailed) in
Dian Kristianti, dkk
The Impact Of Liquidity And Profitability On Firm Value With Dividend Policy As An Intervening Variable (Empirical Study Of Manufacturing Companies In The Pharmaceutical Sub Sector Listed On The Indonesia Stock Exchange In 2013-2017)
71
hypothesis 2 is 0.185. This means that the residual data is normally distributed, because the asymp value. Sig (2-tailed) is greater than 0.05.
Multicollinearity Test
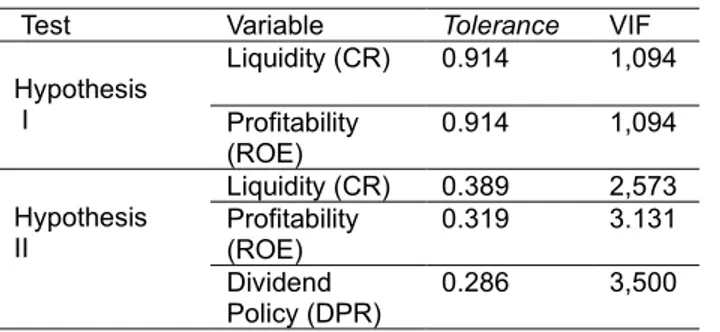
Table 3. Multicollinearity Test Results
Test Variable Tolerance VIF
Hypothesis I Liquidity (CR) 0.914 1,094 Profitability (ROE) 0.914 1,094 Hypothesis II Liquidity (CR) 0.389 2,573 Profitability (ROE) 0.319 3.131 Dividend Policy (DPR) 0.286 3,500
Data Source: Data secondary processed with SPSS output 24.0
From the table above it is known that the Variant Inflation Factor (VIF) value of variables such as CR and ROE has a VIF value <10 andvalue tolerance > 0.1. Then it can be concluded that data does not occur multicollinearity.
Autocorrelation Test
Table 4. Autocorrelation Test Results
Test Durbin-Watson Hypothesis I 1,208 Hypothesis II 1,332
Source: Secondary data processed with SPSS output 24.0
From the above table, autocorrelation test results are known that the Durbin-Watson (DW calculated) value in hypothesis I is amounted to 1,208 and hypothesis II amounted to 1,332. Based on the DW calculation results are included in the criteria -2 to +2, it is concluded that no autocorrelation occurred and the autocorrelation test was fulfilled.
Heteroscedasticity Test
Source: Secondary data processed by SPSS 24.0
72
Source: Secondary data processed by SPSS 24.0
Figure 3. Heteroscedasticity Test Results The Effect of Liquidity, Profitability and Dividend Policy on Corporate Value
From Figure 2 and Figure 3 the results of the Heteroscedasticity test chart analysis results can be seen that the points do not form clear patterns, and the points spread above and below the number 0 on the Y axis. This shows that there was no heteroscedasticity.
Analysis of Multiple Linear Regression Equations Hypothesis I
Table 5. Results of Multiple Linear Regression Analysis The Effect of Liquidity and Profitability on Dividend Policy
B S std.Error Constant 2.646 0.393 CR 0.713 0.062 ROE 0.729 0.054
Source: Secondary data processed with SPSS 24.0 output
DPR= 2,646 + 0.713X1 + 0.729X2
From the regression equation above it can be concluded as follows:
α = constant value (α) is 2.646, meaning that if the independent variables namely Current Ratio (X1) and Return On Equity (X2) are zero, then the Dividend Payout Ratio is 2.646.
β1 = regression coefficient value of the liquidity variable (X1) is positive that is 0.713. This shows
that every 1% increase in thevariable Current Ratio will increase the Dividend Payout Ratio by 71.3% assuming the other variables are of fixed value.
β2 = regression coefficient value of the profitability variable (X2) is positive that is 0.729. This
shows that every 1% increase in the Returnvariable On Equity will increase the Dividend Payout Ratio by 72.9% assuming the other variables are of fixed value.
Dian Kristianti, dkk
The Impact Of Liquidity And Profitability On Firm Value With Dividend Policy As An Intervening Variable (Empirical Study Of Manufacturing Companies In The Pharmaceutical Sub Sector Listed On The Indonesia Stock Exchange In 2013-2017)
73 Table 6. Results of Multiple Linear Regression Analysis
The Effect of Liquidity, Profitability and Dividend Policy on Firm Value
B S std.Error Constant 5.674 0.438 CR -0.293 0.088 ROE -0.105 0.084 DPR 0.602 0.093
Source: Secondary data processed with SPSS 24.0 output
PBV= 5,674 - 0.293X1 - 0.105X2 + 0.602X3
From the regression equation above it can be concluded as follows:
α = constant value is 5,674, meaning that if the independent variables namely Current Ratio (X1), Return On Equity (X2) and Dividend Payout Ratio (DPR) are zero, then Value The company
is worth 5,674.
β1 = regression coefficient value of the liquidity variable (X1) is negative, that is (-0.293). This
shows that every 1% increase in thevariable Current Ratio will reduce the value of the company by 29.3% assuming the other variables are of fixed value.
β2 = regression coefficient value of the profitability variable (X2) is negative, that is (-0.105).
This shows that every 1% increase in thevariable Return On Equity will reduce the value of the company by 10.5% assuming other variables are of fixed value.
β3 = regression coefficient value of the dividend policy variable (X3) is positive (0.602). This
shows that every 1% increase in thevariable Current Ratio will increase the value of the company by 60.2% assuming the other variables are of fixed value.
Simultaneous Test (F-test) Hypothesis Test I
Table 7. Test Results Simultaneous Test Results (F-Test) The Effect of CR and ROE on Dividend Policy
ANOVAb Model Sum of Square s Df Mean Squar e F Sig. 1 Regression 99,342 121,24 7 .000 2 198, 683 a Residual 79 475 97 .819 Total 278 158 99 a. Predictors: (Constant), ROE, CR b. Dependent Variable: DPR
Source: SPSS Output 24.0
Based on the results in Table 7 shows the F valuecalculated of 121.247 while the significance value
of 0.000, which means it is smaller than the level of significant specified (0.05). So it can be concluded that Liquidity and Profitability together have a significant effect on Dividend Policy.
74 Table 8. Simultaneous Test Results (Test F)
Effect of CR, ROE and DPR on Company Value
ANOVAb Model Sum of Square s df Mean Squar e F Sig. 1 Regression 25,835 37,389 .000 3 77,5 06a Residual 66 335 96 .691 Total 143 841 99
a. Predictors: (Constant), DPR, CR, ROE b. Dependent Variable: PBV
Source: SPSS Output 24.0
Based on the results in Table 8 shows theF valuecalculated of 37,389 while the significance value of
0,000, which means it is smaller than the level of significant specified (0.05). So it can be concluded that Liquidity, Profitability and Dividend Policy together have a significant influence on Company Value.
Partial Test (t-test)
Table 9. Partial Test Results (t Test)
Testing Variable t Sig.
Hypothesis I
CR 🡪 DPR 11 455 0000 ROE 🡪 DPR 13,440 0000
Hypothesis II CR 🡪 PBV ROE 🡪 PBV -6762 -1240 0000 0018 DPR 🡪 PBV 6454 0000 Source: Secondary data were processed with SPSS output 24.0
Hypothesis I
LiquidityEffect on Dividend Policy
Based on Table 9. shows that the calculated value of the Liquidity of the Dividend Policy is 11,455> 1,660 with a significance level of 0,000 <0.05. Thus the results of this study accept the first hypothesis that Liquidity has a positive and significant effect on Dividend Policy in Pharmaceutical Sub Sector Manufacturing Companies in the Indonesia Stock Exchange in 2013-2017.
Effect of Profitability on Dividend Policy
Based on Table 9. shows that the t-value of the Profitability on Dividend Policy is 13,440> 1,660 with a significance level of 0,000 <0.05. Thus the results of this study accept the second hypothesis that profitability has a positive and significant effect on Dividend Policy in Pharmaceutical Sub Sector Manufacturing Companies in the Indonesia Stock Exchange in 2013-2017.
Dian Kristianti, dkk
The Impact Of Liquidity And Profitability On Firm Value With Dividend Policy As An Intervening Variable (Empirical Study Of Manufacturing Companies In The Pharmaceutical Sub Sector Listed On The Indonesia Stock Exchange In 2013-2017)
75
Effect of Liquidity on Firm Value
Based on Table 9. shows that the t-value of Liquidity against Firm Value is -6,762 <1,661 with a significance level of 0,000 <0.05. Thus the results of this study accept the third hypothesis that Liquidity has a negative and significant effect on Company Value in Pharmaceutical Sub Sector Companies in the Indonesia Stock Exchange in 2013-2017.
Effect of Profitability on Firm Value
Based on Table 9 shows that the t-value of the Profitability to Firm Value is -1,240 <1,661 with a significance level of 0.018 <0.05. Thus the results of this study accept the fourth hypothesis that profitability has a negative and significant effect on firm value in pharmaceutical sub-sector manufacturing companies on the Indonesia Stock Exchange in 2013-2017.
Effect of Dividend Policy on Firm Value
Based on Table 9 shows that the t-value of the Dividend Policy on Firm Value is 6,454> 1,661 with a significance level of 0,000 <0.05. Thus the results of this study accept the fifth hypothesis that profitability has a positive and significant effect on firm value in pharmaceutical sub-sector manufacturing companies on the Indonesia Stock Exchange in 2013-2017.
Determination Coefficient Test
Table 10. Determination Coefficient Test Results
Model Adj R2
Hypothesis I. 708 Hypothesis II .524
Source: Secondary data processed with SPSS output 24.0
Based on Table 10, the Adjusted R Square value for Hypothesis 1 is 0.708. This shows that the percentage of influence of independent variables (CR and ROE) on the dependent variable (DPR) is 70.8%, while the remaining 20.2% is influenced by other factors not included in this regression model. And the value of Adjusted R Square in hypothesis 2 is known as 0.524. This shows that the percentage of influence of independent variables (CR, ROE and DPR) on the dependent variable (PBV) is 52.4%, while the remaining 47.6% is influenced by other factors not included in this regression model.
Path Analysis Line Diagrams
The following is the path diagram results obtained from the analysis.
Figure 3. Structural Model Path Analysis
CR
(X
1)
DP
R
PB
V
(Y)
RO
E
(X
2)
0,713 0,729 -0,293 -0,105 0,60276
Direct Effects (X1→ Y) = -0.293 Indirect
Effects (X(X11→ Y) * (M → Y) = 0.713 x 0.602 = 0.429→ Y)
Profitability of
Direct EffectsX2 → Y) = -0.105 Indirect
Influence (X2 → Y) * (M → Y) = 0.729 x 0.602 = 0.438
Dividend Policy Mediating the Effect of Liquidity on Firm Value
Based on calculations using the Path analysis above, a coefficient of direct effect liquidity is obtained to the company's value of -0.293 and the indirect effect of liquidity on the company's value of 0.429, meaning that the indirect effect (0.429) is greater than the direct influence (-0.293), so it can be concluded that liquidity has an indirect effect on firm value through dividend policy.
Dividend Policy Mediates the Effect of Profitability on Firm Value
Based on calculations using the Path analysis above, the coefficient of direct effect on profitability on firm value is obtained and the indirect effect of liquidity on firm value is 0.438, meaning that the indirect effect (0.438) is greater than on direct influence (-0.105), so it can be concluded that liquidity has an indirect effect on firm value through dividend policy.
CONCLUSION Conclusion
Based on the results of research and discussion in this study, it can be concluded as follows: 1. The value of pharmaceutical sub-sector manufacturing companies listed on the Indonesia
Stock Exchange in 2013-2017 tends to fluctuate, there are two companies experiencing an increase namely PT Kimia Farma (Persero) Tbk and PT Merck Tbk, and 3 pharmaceutical companies that experienced a decline namely at PT Darya-Varia Laboratoria Tbk, PT Kalbe Farma Tbk, and PT. Tempo Scan Pacific Tbk.
2. Liquidity and profitability have a positive and significant effect on dividend policy on pharmaceutical sub-sector manufacturing companies listed on the Indonesia Stock Exchange in 2013-2017.
3. Liquidity and profitability have a negative and significant effect on firm value, while dividend policy has a positive and significant effect on firm value, and dividend policy is able to mediate the effect of liquidity and profitability on the value of pharmaceutical sub-sector manufacturing companies listed on the Indonesia Stock Exchange in 2013-2017.
Suggestion
Based on the conclusions, it is suggested as follows:
1. Companies should continue to improve their ability to generate profits, both in increasing sales or using assets optimally.
2. Companies should limit the use of large amounts of debt and make investments such as the addition of fixed assets can encourage company productivity.
3. Determine policies in the payment of dividends appropriately in order to determine the price of shares sold which later causes a positive stock price reaction so that investors will be interested in investing in the company.
Dian Kristianti, dkk
The Impact Of Liquidity And Profitability On Firm Value With Dividend Policy As An Intervening Variable (Empirical Study Of Manufacturing Companies In The Pharmaceutical Sub Sector Listed On The Indonesia Stock Exchange In 2013-2017)
77 Agus, T. B., & Prawoto, N. (2016). Analisis Regresi dalam Penelitian Ekonomi & Bisnis: Dilengkapi Aplikasi
SPSS & Eviews. Jakarta: Rajawali Pers.
Dewi, A. A., & Wirawati, N. G. P. (2018). Pengaruh profitabilitas terhadap nilai perusahaan dengan corporate social responsibility sebagai variable intervening. Jurnal Akuntansi Universitas Udayana,
22(2), 1557-1583.
Diswani, W. (2012). Pengaruh Struktur Modal dan Profitabilitas terhadap Nilai Perusahaan dengan
Kebijakan Dividen sebagai Variabel Intervening pada Perusahaan yang Masuk Kelompok Jakarta Islamix Index Periode 2007-2010. Bandung: Politeknik Negeri Bandung.
Fahmi, I. (2015). Analisis Laporan Keuangan. Cetakan Ketiga. Bandung: Penerbit Alfabeta.
Fenandar, G. I., & Raharja, S. (2012). Pengaruh keputusan investasi, kepurusan pendanaan, dan kebijakan dividen terhadap nilai perusahaan. Diponegoro Journal of Accounting, 1(2) 2012, 1-10.
Ghozali, I. (2018). Aplikasi Analisis Multivariate dengan Program SPSS. Semarang: Badan Penerbit UNDIP.
Gisela, P. R. (2013). Likuiditas, solvabilitas dan rentabilitas terhadap nilai perusahaan BUMN yang terdaftar di Bursa Efek Indonesia. Jurnal EMBA, 1(3), 252-262.
Hardiyanti, N. (2012). Analisis Pengaruh Insider Ownership, Leverage, Profitability, Firm Size dan Dividen
Payout Ratio terhadap Nilai Perusahaan (Studi Pada Perusahaan Manufaktur yang Terdaftar di BEI tahun 2007-2010). Semarang: Universitas Diponegoro.
Hemastuti, C. P. (2014). Pengaruh profitabilitas, kebijakan dividen, kebijakan hutang, keputusan investasi dan kepemilikan insider terhadap nilai perusahaan. Jurnal Ilmu & Riset Akuntansi, 3(4).
Hery. (2015). Analisis Kinerja Manajemen. Jakarta: PT Grasindo.
Jariah, A. (2016). Likuiditas, leverage, profitabilitas pengaruhnya terhadap nilai perusahaan manufaktur di indonesia melalui kebijakan dividen. Riset Akuntansi dan Keuangan Indonesia, 1(2), 108-118.
Kasmir. 2010. Pengantar Manajemen Keuangan. Edisi Kedua. Jakarta: Penerbit Prenadamedia Group. Mangasa, S. (2010). Pengetahuan Praktis Investasi Saham dan Dana Reksa. Jakarta: Mitra Wacana
Media.
Mardiyati, U, Ahmad, G. N., & Putri, R. (2012). Pengaruh kebijakan dividen, kebijakan hutang dan profitabilitas terhadap nilai perusahaan manufaktur yang terdaftar di bursa efek indonesia (bei) periode 2005-2010. Jurnal Riset Manajemen Sains Indonesia (JRMSI), 3(1).
Mardiyanto, H. (2009). Intisari Manajemen Keuangan. Jakarta: PT. Gramedia Widiasarana Indonesia (GRASINDO).
Nofrita, R. (2013). Pengaruh Profitabilitas Terhadap Nilai Perusahaan Dengan Kebijakan Deviden Sebagai
Variabel Intervening (Studi Empiris pada Perusahaan Manufaktur yang Terdaftar di BEI). Padang:
Universitas Negeri Padang.
Nufiati, N. M. B. (2015). Pengaruh profitabilitas dan likuiditas terhadap kebijakan dividen kas pada perusahaan pefindo 25. Jurnal Ilmu dan Riset Manajemen, 4(8), 1-18.
Parica, R. (2013). Pengaruh laba bersih, arus kas operasi, likuiditas dan profitabilitas terhadap kebijakan dividen pada perusahaan automotive and allied product yang terdaftar di BEI. Jurnal Akuntansi
Universitas Riau, 2(1).
Sarwono, J., & Suhayati, E. (2010). Riset Akuntansi Menggunakan SPSS. Yogyakarta: Graha Ilmu. Sugiarto, M. (2011). Pengaruh struktur kepemilikan dan kebijakan dividen terhadap nilai perusahaan
78 Sulistyowati, I., Anggraini, R., & Utaminingtyas, T. H. (2010). Pengaruh profitabilitas, leverage dan growth terhadap kebijakan deviden dengan good corporate governance sebagai variabel intervening.
Simposium Nasional Akuntansi XIII Purwokerto.
Susanti, R. (2010). Analisis Faktor-Faktor Yang Berpengaruh Terhadap Nilai Perusahaan. Semarang: Universitas Diponegoro.
JBK
Jurnal Bisnis & Kewirausahaan Volume 16, Issue 1, 2020 ISSN (print) : 0216-9843 ISSN (online) : 2580-5614
Homepage : http://ojs.pnb.ac.id/index.php/JBK
65
The Impact of Liquidity and Profitability on Firm Value With Dividend
Policy as An Intervening Variable
(Empirical Study of Manufacturing Companies in The Pharmaceutical
Sub Sector Listed on The Indonesia Stock Exchange in 2013-2017)
Dian Kristianti1, John E. H. J. Foeh2
1,2Faculty of Economics, Gunadarma University, Indonesia 1e-mail: diankris41@gmail.com
Abstract. The purpose of this research is to know the description of corporate value and the influence of liquidity and profitability to firm value with dividend policy as intervening variable of pharmaceutical sub sector manufacturing companies listed in Indonesian Stock Exchange from 2013 until 2017. Liquidity in this research is measured by using current ratio (CR), profitability is measured by return on equity (ROE), dividend payout ratio (DPR), and firm value measured by price to book value (PBV). This research uses secondary data obtained from pharmaceutical sub-sector manufacturing companies listed in Indonesia Stock Exchange. Data analysis method uses Quantitative Descriptive Analysis, Multiple Linear Regression Analysis and Path Analysis. Data is processed using SPSS data analysis package software version 24.0. The overall conclusion is liquidity and profitability simultaneously or partially have a positive and significant effect on dividend policy, while liquidity, profitability, and dividend policy simultaneously have a positive and significant effect to firm value. But partially liquidity and profitability have a negative and significant effect to firm value, while dividend policy has a positive and significant effect to firm value. And, dividend policy is able to mediate the influence of liquidity and profitability to the value of pharmaceutical sub-sector manufacturing companies listed in Indonesia Stock Exchange.
Keywords: firm value, liquidity, profitability and dividend policy
PENDAHULUAN
Company publicly traded is a company that sells shares to investors who traded in the stock market. The main purpose of a company going public is to increase the prosperity of the owner or shareholders through increasing the value of the company. According to Jariah (2016: 108), in his research stated that the value of the company can prosper the maximum shareholders if the share price rises. The higher the stock price, the higher the value of the company. The high value of the company becomes the desire of the owners of the company, because the high value indicates the higher the prosperity of the shareholders.
Several factors can affect the value of the company include liquidity, profitability and dividend policy. Liquidity is the company's ability to pay the company's short-term obligations. Companies that have good liquidity will be considered to have good performance by investors. Liquidity can be measured by Current Ratio, which illustrates how much the current availability of the company's assets compared to the total current liabilities (Hery, 2015: 152). According to Prisilia (2013: 261) in his research revealed that liquidity affects the value of the company.
66
corporate efficiency as well, so that good company performance is seen. In this study the profitability ratio is measured by return on equity (ROE). ROE is a ratio that shows how much the company's ability to generate net income for return of equity to shareholders. According to (Mardiyati et al., 2012: 16) Profitability has a significant positive effect on firm value.
Dividend policy is the company's financial decision whether the profits obtained will be distributed to shareholders or retained as retained earnings. Dividends distributed are usually presented in Dividend Payout Ratio (DPR). DPR is what determines the amount of dividend per share. Sugiarto (2011: 21) and Fenandar (2012: 7) states that dividend policy has a significant positive effect on firm value.
Liquidity and profitability have an important role in dividend policy, where this policy can maximize the value of the company. Therefore, based on the relationship between liquidity and profitability with dividend policy, this study determined dividend policy as an intervening variable that mediates the relationship between profitability and liquidity on firm value.
Research on organization esteem has been done previsously by Ria Nofrita (2013) with the title impact of benefit on firm an incentive with profit arrangement as a mediating variable (exact investigations on assembling organizations recorded on the Indonesia Stock Exchange). Result of study show that productivity and profit approach have a noteworthy beneficial outcome on firm worth, while the impact of profitability on devidend policy is not significant.
Based on the above description, this study aims to determine the factors that influence the value of the company, the factors are liquidity, profitability and deviden policy.
LITERATURE STUDY AND HYPOTHESIS Corporate Value
High company value can increase prosperity for shareholders, so shareholders will invest their fund in the company (Hemastuti, 2014: 3). There are several methods that could measure the company value such as Price to Book value (PBV), liquidity, profitability, and dividend policy. Company value is measured by using PBV (Price to Book Value) measured by the formula as follows (Fahmi, Irham. 2015):
PBV = Market Price per Share Book Value per Share
Liquidity, according to Hery (2015: 142), a liquidity ratio is a ratio that shows a company's ability to meet its short-term obligations. This ratio is used to measure to what extent the company's ability to pay off short-term obligations that will soon be due.
According to Mangasa Simatupang (2010:58), the current ratio is the ratio that illustrates the company's ability to meet short-term needs, namely by comparing current assets with current debt or short-term debt. The formulated by Kasmir (2020) as follows :
Current Ratio = Current Assets Current Liabilities
Profitability, according to Hery (2015: 192), profitability ratios are ratios to measure a company's ability to generate profits from its normal business activities. This ratio also aims to measure the effectiveness of management in carrying out company operations.
According to Mangasa Simatupang (2010: 55), return on equity (ROE) is a ratio that describes a company's ability to generate profits from its own capital. The formuated by Kasmir (2010) as follows:
Dian Kristianti, dkk
The Impact Of Liquidity And Profitability On Firm Value With Dividend Policy As An Intervening Variable (Empirical Study Of Manufacturing Companies In The Pharmaceutical Sub Sector Listed On The Indonesia Stock Exchange In 2013-2017)
67
ROE = Earning After Interest and Tax Equity
Dividend policy includes decisions regarding whether profits will be distributed to shareholders or will be retained for reinvestment in the company (Kamaludin and Indriani, 2012: 330).
Dividend payout ratio (DPR) is the ratio between dividends distributed compared to earnings per share obtained by the company (Mangasa, 2010: 39). Fahmi (2015) formulated as follows:
DPR = Dividend per Share Earning per Share
Previous Research
Research by Anak Agung Ayu Tisna Wulan Dewi, and Ni Gst. Putu Wirawati (2018) entitled "The Effect of Profitability on Company Value with Corporate Social Responsibility as Intervening Variables". The results showed that only profitability had a positive effect on firm value, whereas CSR did not. The profitability variable has a positive effect on CSR, and the role of CSR is not found to mediate the effect of profitability on firm value.
Windi Diswani's research (2012) entitled "The Effect of Capital Structure and Profitability on Firm Value with Dividend Policy as Intervening Variables in Companiesin the Included Jakarta Islamix Index 2007-2010". The results showed that: (1) Profitability had a positive and significant effect on dividend policy. (2) Capital structure has a negative and not significant effect on firm value. (3) Profitability has a positive and significant effect on firm value. (4) Dividend policy has a positive and significant effect on company value. (5) The results of this study cannot show that dividend policy can mediate a causal relationship between profitability and firm value. Thus, the effect of profitability on firm value is direct.
Hypothesis
Liquidity Against Corporate Value
Liquidity shows the ability of a company to fulfill its financial obligations which must immediately be fulfilled or when billed. Research (Prisilia, 2013: 261) liquidity has a positive and significant effect on firm value.
H1: Liquidity has a positive effect on company value
Profitability on Corporate Value
High profitability reflects the company's ability to generate high returns for shareholders. Research (Mardiyati et al., 2012: 16) the effect of profitability variables on firm value was found to have a positive and significant effect on manufacturing companies listed on the Indonesia Stock Exchange (BEI) for the period 2005-2010.
H2: Profitability has a positive effect on company value
Liquidity of Dividend Policy
According to Mardiyanto (2009: 54) liquidity measures the company's ability to pay off short-term obligations (debt) on time, including paying off the portion of long-term debt that falls due in the year concerned. The results of Nufiati's research (2015: 16) show that liquidity has a significant influence on cash dividends in pefindo companies 25.
H3: Liquidity has a positive effect on dividend policy
68
research conducted by Parica, et al (2013: 11) show that profitability has a significant influence on dividend policy.
H4: Profitability has a positive effect on dividend policy
Dividend Policy on Corporate Values
According to (Martono and Harjito, 2005: 2) in Susanti (2010: 16) states that the value of the company can be seen from the company's ability to pay dividends. If the dividend paid is high, then the stock price will tend to be high so the value of the company is also high, and vice versa. The ability to pay dividends is closely related to the company's ability to make a profit. If the company gets a large profit, then the ability to pay dividends will also be large.
H5: Dividend policy has a positive effect on firm value.
Figure 1. Research Model (Conceptual Framework)
RESEARCH METHOD
Type of research is quantitative descriptive, and is a causality research which means there is a relationship between two or more variables. The population were all pharmaceutical sub-sector manufacturing companies listed on the Indonesia Stock Exchange (IDX) in 2013-2017. Sampling is based on purposive sampling. Considerations as a sample selection criteria are as follows:
1. The pharmaceutical company is a company that has gone public and is listed on the Indonesia Stock Exchange in 2013-2017 which lists complete data consecutively during the study period.
2. The company published quarterly financial statements and ratios needed on the Indonesia Stock Exchange for 5 consecutive years from 2013-2017.
3. The company's financial statements have a financial year ending December 31.
Based on the sample criteria used in the study, a sample of 5 companies was obtained. Data used are secondary data. Secondary data in this study are in the form of current ratio (CR), return on equity (ROE), dividend payout ratio (DPR), and price to book value (PBV), where these data are sourced from the financial statements of pharmaceutical sub-sector manufacturing companies listed on the Indonesia Stock Exchange for the period 2013-2017. Data collection methods used literature study and documentation.
Exogenous variables in the path model are all variables that have no explicit causes or in the diagram there are no arrows in their direction, other than in the measurement error section,
CR
(X
1)
DPR
(M)
PBV
(Y)
ROE
(X
2)
H1 H2 H3 H4 H5Dian Kristianti, dkk
The Impact Of Liquidity And Profitability On Firm Value With Dividend Policy As An Intervening Variable (Empirical Study Of Manufacturing Companies In The Pharmaceutical Sub Sector Listed On The Indonesia Stock Exchange In 2013-2017)
69
(Sarwono & Suhayati, 2010). In this study who become independent variables including: Liquidity (X1) and Profitability (X2).
The dependent variable is a variable that includes an intermediate variable and a dependent/ dependent variable (Sarwono & Suhayati, 2010). The dependent variable in this study is dividend policy and firm value.
Intervening variable (M) is a variable located between the independent variable and the dependent variable, so that the independent variable does not directly explain or influence the dependent variable. And the intervening variable in this research is dividend policy.
Statistical analysis is a statistic used to analyze data by describing or describing data that has been collected as it is without intending to make conclusions that apply to the public or generalization (Sugiyono, 2016: 207).
TEST METHOD
Classical Assumption Normality Test
This test aims to test whether in the regression model, confounding or variables residual have a normal distribution (Ghozali, 2018: 161). Normality testing in this study is used by looking at the value of 2-tailed significant. If (sig)> 5%, it can be concluded that Ho is accepted, so the data is normally distributed and if (sig) <5%, then Ho cannot be accepted so the data is not normally distributed.
Multicollinearity Test
This test aims to test in the regression model whether there is a correlation between independent variables (Ghozali, 2018: 107). Testing of the possibility of multicollinearity can be seen by using themethod Tolerance Value or Variance Inflation Factor (VIF). The value commonly used to indicate the presence of multicollinearity is a tolerance value <0.10 or equal to VIF> 10.
Autocorrelation
This test test aims to test whether in the linear regression model there is a correlation between the error of the intruder in the t period and the error of the intruder in the t-1 period previous). If there is a correlation, then there is a problem called autocorrelation (Ghazali, 2018: 111). To test the presence or absence of autocorrelation using the Durbin-Watson test (DW test). The Durbin Watson (DW) number for detecting autocorrelation is: (1) A DW number below -2 means there is a negative autocorrelation. (2) A DW number between -2 to +2 means there is no correlation. (3) DW numbers above +2 mean there is a positive correlation.
Heteroscedasticity Test
Test aims to test whether in the regression model there is an inequality of variance from the residuals of one observation to another. A good model is homocedasticity or heteroscedasticity does not occur (Ghozali, 2018: 137), to detect the presence or absence of heteroscedasticity is to look at the plot graph between the predicted predictive value (ZPRED) and the residual (SRESID) where the Y axis is Y which has been predicted and the X axis is the residual (Y-Y predictions actually) that has distandardized.
Multiple Linear Regression Analysis
Regression aims to examine the relationship between one variable with another variable. Multiple linear regression equation:
Description: Y1 = α + β1X1 + β2X2 + ε Y2 = α + β1X1 + β2X2 + β3X3 + ε