Faculty of Science
Department of Physics
Tomislav Terzi´c
CHARACTERIZATION OF VERY HIGH
ENERGY GAMMA-RADIATION FROM
ACTIVE GALACTIC NUCLEI OBSERVED
BY THE MAGIC TELESCOPES
DOCTORAL THESIS
Faculty of Science
Department of Physics
Tomislav Terzi´c
CHARACTERIZATION OF VERY HIGH
ENERGY GAMMA-RADIATION FROM
ACTIVE GALACTIC NUCLEI OBSERVED
BY THE MAGIC TELESCOPES
DOCTORAL THESIS
Supervisor:
Dijana Dominis Prester
Prirodoslovno-matematiˇcki fakultet
Fiziˇcki odsjek
Tomislav Terzi´c
SVOJSTVA VISOKOENERGIJSKOGA
GAMA-ZRA ˇ
CENJA IZ AKTIVNIH
GALAKTI ˇ
CKIH JEZGRI OPA ˇ
ZANIH
TELESKOPIMA MAGIC
DOKTORSKI RAD
Mentor:
Dijana Dominis Prester
First and foremost I am grateful to my supervisor Dijana Dominis Prester, whom I consider not only a mentor, but also a dear friend. Working with her I developed as a scientist and as a person. This work would not have been possible without her guidance and patience. My work was also in great respect supervised by Karsten Berger, who introduced me to the world of MAGIC telescopes. I am immensely grateful to him as well.
In the beginning of my PhD research, I spent three months in the Max Planck Institute for Physics (Werner Heisenberg Institute) in Munich. I thank all the colleagues for their hospitality and knowledge I received during my stay there. Working for the MAGIC Collaboration was a wonderful scientific and life experience. I made many friends; too many to count. They make working environment in MAGIC pleasant to the extent that even working hard means having fun. I am especially grateful to the former and current members of the Croatian MAGIC Consortium for their support, help and friendship. Working at the Department of physics of University of Rijeka was also a very pleasant experience. For that I thank all my colleagues there.
I thank my parents Slavica and Ante and my brother Marijan for their support and encouragement. I am immeasurably grateful to Lidija for her love, support and patience, especially in the time of finalising this work.
Name: dr. sc. Dijana Dominis Prester
Position: Associate professor at the University of Rijeka – Department of Physics
Responsibility in the MAGIC collaboration: Main Observation Scheduler
Project management:
1. 2010, Hunt for the time delay in very high energy gamma rays from (AGN); International project; DAAD, MZOˇS
2. 2013 –, Istraˇzivanje strukture svemira optiˇckim i ˇCerenkovljevim teleskopima; Uni-versity of Rijeka science research support project nr. 13.12.1.3.02
3. 2014 –, Ravnopravno sudjelovanje Sveuˇciliˇsta u Rijeci u astroˇcestiˇcnim eksperi-mentima; University of Rijeka project
Conference organisation:
1. 13. – 20.9.1994, Perspectives in Particle Physics ’94; Brijuni, Croatia; Conference secretary
2. 9. 2010, MAGIC collaboration Meeting; Split, Croatia; Member of the organisa-tion committee
3. 10. 2009, 6th scientific meeting of the Croatian physical society; Primoˇsten, Croa-tia; Member of the organisation committee
PhD students; Rabac, Croatia; Member of the organisation committee
Review panels:
1. 2011 – 2013, Member of the international Review Panel of European Science Foun-dation (ESF) for EUROGENESIS projects
http://www.esf.org/coordinating-research/eurocores/running-programmes/eurogenesis/committees.html
2. Member of the review panel of Croatian Science Foundation (HRZZ)
Dijana Dominis Prester supervised 9 student theses (master/batchelor/diploma), and published 107 refereed articles in journals (Current Contents). She is the coordinator for the module ”Astrophyiscs and particle physics” of the physics master program at the University of Rijeka.
Selected articles (in last 5 years):
1. Cassan, A.; ...; Dominis Prester, D.; ... One or more bound planets per Milky Way star from microlensing observations. // Nature. 481 (2012) , 7380; 167-169
2. Aleksi´c, Jelena; ...; Dominis Prester, Dijana; ...; Ferenc, Daniel; ...; Godinovi´c, Nikola; ...; Hrupec, Dario; ...; Lelas, Damir; ...; Puljak, Ivica; ...; Suri´c, Tihomir; ...; ˇSnidari´c, Iva; ...; Terzi´c, Tomislav; ...; Zanin, R. Performance of the MAGIC stereo system obtained with Crab Nebula data. // Astroparticle physics. 35 (2012)
3. Aleksi´c, Jelena; ...; Dominis Prester, Dijana; ...; Ferenc, Daniel; ...; Godinovi´c, Nikola; ...; Hrupec, Dario; ...; Lelas, Damir; ...; Puljak, Ivica; ...; Suri´c, Tihomir; ...; ˇSnidari´c, Iva; ...; Terzi´c, Tomislav; ...; Ghisellini, G. MAGIC observations of the giant radio galaxy M 87 in a low-emission state between 2005 and 2007. // Astronomy and astrophysics. 544 (2012) ; A96-1-A96-8
Nikola; ...; Hrupec, Dario; ...; Lelas, Damir; ...; Puljak, Ivica; ...; Suri´c, Tihomir; ...; Terzi´c, Tomislav; ...; Buson, S. MAGIC discovery of VHE Emission from the FSRQ PKS 1222+21. // The Astrophysical journal. 730 (2011) , L8; 1-6
5. Gould, A.; ...; Dominis Prester, D.,... Frequency of Solar-like ystems and of Ice and Gas Giants Beyond the Snow Line from High-magnification Microlensing Events in 2005-2008. // Astrophysical Journal. 720 (2010) , 2; 1073-1089
Abstract
Active galactic nuclei (AGN) are bright compact regions in the centres of galaxies, that emit radiation across the entire electromagnetic spectrum. They are believed to be powered by supermassive black holes (SMBH), which actively accrete matter. Some of that matter is ejected in the form of collimated jets of ultrarelativistic particles. Jets are sources of electromagnetic radiation of all wavelengths. A significant portion of en-ergy radiated by AGN is emitted in the form ofγ-rays. In addition,γ-rays are produced through physical processes different from the ones responsible for lower energy radiation. Therefore, in order to understand how jets are formed and how particles are accelerated to ultrarelativistic energies, it is important to understand the mechanisms and locations of γ-ray production within AGN.
To reach closer to this goal here we study the very high energy (VHE) γ-radiation from three sources belonging to different classes of AGN: M87 (radio galaxy), PKS 1222+21 (flat spectrum radio quasar) and H1722+119 (BL Lac object). For these sources we ob-tained VHE γ-ray spectra and light curves using the MAGIC ground-based Cherenkov telescopes. We used long term monitoring of M87 to evaluate the level of low emission state. We propose a structured jet “spine-layer” scenario to explain the emission from M87. It places the VHEγ-ray emission region in the vicinity of the SMBH, and suggests that, if viewed head on, the emission from M87 would resemble that from a typical BL Lac. PKS 1222+21 was first detected by the MAGIC telescopes. Very short variability timescale and absence of a cut-off in the VHE spectrum sets constraints on VHE γ-ray emission region, and on emission models. We performed a multiwavelength study us-ing contemporaneous data, concludus-ing that the γ-ray emission region is most probably located outside of the broad line region, and that it is possible to explain the emission using a simple one-zone emission scenario. H1722+119 is a source with unknown red-shift, first detected by the MAGIC telescopes. We performed a multiwavelength study using contemporaneous data, and estimated the redshift of the source using γ-rays to z = 0.4.
As expected, different types of emission models are required to explain emission from different types of sources. However, we also find that the VHEγ-radiation originates in different locations in the sources we studied.
Key words: active galactic nuclei, blazars, gamma-rays, imaging atmospheric Cheren-kov telescopes, M87, PKS 1222+21, 4C +21.35, H1722+119
Aktivne galaktiˇcke jezgre (AGN) su sjajna i zbijena podruˇcja u srediˇstima galaksija, koja zraˇce preko cijelog spektra elektromagnetskog zraˇcenja. Smatra se da ih napajaju super-masivne crne rupe (SMBH) koje aktivno prikupljaju materiju. Dio te materije izbacuju u obliku kolimiranog mlaza ultrarelativistiˇckih ˇcestica. Mlazovi su izvori elektromagnet-skog zraˇcenja svih frekvencija. Znaˇcajan udio energije koju zraˇce AGN odnose γ-zrake. Uz to, γ-zrake nastaju u procesima razliˇcitima od onih u kojima nastaje zraˇcenje niˇzih energija. Stoga, da bismo razumjeli mehanizam nastanka mlazova i ubrzavanja ˇcestica do ultrarelativistiˇckih energija, vaˇzno je da razumijemo naˇcin i podruˇcje nastanka γ-zraka.
Da bismo se primakli tom cilju, u ovom radu smo prouˇcili γ-zraˇcenje vrlo visokih energija (VHE) iz tri izvora, od kojih svaki spada u drugi razred AGN: M87 (radio galaksija), PKS 1222+21 (radio kvazar ravnog spektra) te H1722+119 (objekt tipa BL Lac). Spektre i svjetlosne krivulje ovih izvora dobili smo promatraju´ci ih zemaljskim
ˇ
Cerenkovljevim teleskopima MAGIC. Opaˇzanjem M87 tijekom tri godine, odredili smo osnovnu razinu zraˇcenja. Predloˇzili smo strukturirani “kiˇcma-plaˇst” model za opis zraˇcenja, ˇcime smo pokazali da je mogu´ce objasniti emisiju iz podruˇcja u blizini SMBH u M87. VHEγ-zraˇcenje iz PKS 1222+21 je otkriveno teleskopima MAGIC. Opaˇzena prom-jenjivost toka zraˇcenja na kratkim vremenskim skalama postavlja granicu na veliˇcinu podruˇcja zraˇcenja, te na modele emisije. Koriste´ci istovremene podatke, napravili smo studiju zraˇcenja na razliˇcitim valnim duljinama i zakljuˇcili da se podruˇcje zraˇcenja γ-zraka najvjerojatnije nalazi izvan podruˇcja ˇsirokih linija (BLR) te da se emisija moˇze ob-jasniti jednostavnim modelom zraˇcenja iz jednog podruˇcja. H1722+119 je izvor nepoz-natog crvenog pomaka. VHE γ-zraˇcenje otkriveno je teleskopima MAGIC. Koriste´ci istovremene podatke, napravili smo studiju zraˇcenja na razliˇcitim valnim duljinama te procijenili crveni pomak izvora naz = 0,4. Prema oˇcekivanjima, potrebno je primijeniti razliˇcite teorijske modele da bismo opisali zraˇcenje iz razliˇcitih vrsta izvora. Medutim, vidjeli smo i da VHE γ-zrake nastaju na razliˇcitim mjestima u prouˇcavanim izvorima.
Kljuˇcne rijeˇci: aktivne galaktiˇcke jezgre, blazari, gama-zrake, atmosferski ˇ Cerenko-vljevi teleskopi, M87, PKS 1222+21, 4C +21.35, H1722+119
Contents
Abstract i
Saˇzetak ii
List of figures viii
List of tables xii
1 Introduction 1
1.1 Active galactic nuclei . . . 6
1.1.1 Supermassive black holes . . . 6
1.1.2 AGN paradigm . . . 10
1.1.3 Relativistic jet . . . 11
1.1.4 Electromagnetic radiation from AGN . . . 17
1.1.5 Open questions on AGN . . . 26
1.2 γ-ray astronomy . . . 27
1.2.1 Inverse Compton scattering . . . 27
1.2.2 Synchrotron radiation . . . 31
1.2.3 Astrophysical sources of γ-rays . . . 34
1.2.5 Ground based observations . . . 38
1.2.6 Extragalactic background light . . . 45
1.2.7 Cosmic rays . . . 46
2 The MAGIC telescopes 49 2.1 Hardware . . . 50
2.1.1 Construction and drive . . . 50
2.1.2 Reflector . . . 51
2.1.3 Camera . . . 53
2.1.4 Receiver boards . . . 53
2.1.5 Trigger . . . 54
2.1.6 Readout . . . 55
2.2 Observations with MAGIC . . . 56
2.2.1 iScream . . . 59
2.3 MAGIC data analysis . . . 64
2.3.1 Low level data processing . . . 65
2.3.2 Intermediate level data processing . . . 68
2.3.3 High level data processing . . . 71
3 Messier 87 79 3.1 Introduction . . . 79
3.2 Previous observations of M87 in the HE and VHE γ-ray range . . . 82
3.3 Observations and studies of M87 by the MAGIC Collaboration . . . 84
3.3.1 The 2005 – 2007 low state study . . . 84
3.4 Characteristics of the M87 emission . . . 88
3.5 Summary . . . 96
4 PKS 1222+21 99 4.1 Introduction . . . 99
4.2 MAGIC observations and data analysis . . . 102
4.2.1 Light curve for 2010 June 17 . . . 103
4.2.2 VHE spectrum . . . 105 4.3 Multiwavelength observations . . . 107 4.3.1 Fermi-LAT observations . . . 107 4.3.2 Swift observations . . . 108 4.3.3 Optical observations . . . 109 4.3.4 Radio observations . . . 110
4.3.5 Multiwavelength light curve . . . 112
4.3.6 The spectral energy distribution and plausible emission scenarios 114 4.4 Summary . . . 122
5 H1722+119 124 5.1 Introduction . . . 124
5.2 MAGIC observations and data analysis . . . 125
5.3 Multiwavelength observations . . . 127
5.3.1 Fermi-LAT . . . 127
5.3.2 Swift . . . 129
5.3.3 KVA data . . . 129
5.4 Multiwavelength properties . . . 131
5.4.1 Redshift . . . 131
5.4.2 Light curve . . . 132
5.4.3 Spectral energy distribution . . . 132
5.5 Summary . . . 135
6 Conclusions and outlook 136 7 Proˇsireni saˇzetak: Svojstva visokoenergijskoga gama-zraˇcenja iz ak-tivnih galaktiˇckih jezgri opaˇzanih teleskopima MAGIC 147 7.1 Uvod . . . 147
7.1.1 Aktivne galaktiˇcke jezgre . . . 148
7.1.2 γ-astronomija . . . 153
7.1.3 Opaˇzanje γ-zraka . . . 159
7.1.4 Izvangalaktiˇcka pozadinska svjetlost . . . 164
7.2 Kozmiˇcke zrake . . . 165
7.3 Teleskopi MAGIC . . . 166
7.3.1 Opis teleskopa . . . 167
7.3.2 Opaˇzanja teleskopima MAGIC . . . 168
7.3.3 Analiza podataka teleskopa MAGIC . . . 168
7.4 Messier 87 . . . 169
7.4.1 Studija niskog stanja emisije u razdoblju 2005.–2007. godine . . . 169
7.5 PKS 1222+21 . . . 170
7.5.1 Zraˇcenje na razliˇcitim valnim duljinama . . . 171
7.6.1 Zraˇcenje na razliˇcitim valnim duljinama . . . 173
7.7 AGN opaˇzene teleskopima MAGIC . . . 174
7.8 Zakljuˇcak . . . 176
Bibliography 179
Acronyms and abreviations xiii
Author’s contributions xvii
Curriculum vitae xix
1.1 Schematic illustration of AGN . . . 12
1.2 AGN classification scheme based on host galaxy, optical luminosity, and inclination . . . 13
1.3 SED of Markarian 421 . . . 15
1.4 Distribution of FSRQs and BL Lacs according to the redshift . . . 16
1.5 Geometry of Compton scattering with an electron initially at rest . . . . 28
1.6 Feynman diagrams for Compton scattering . . . 28
1.7 Cyclotron and synchrotron radiation energy flux and the geometry of the synchrotron radiation . . . 32
1.8 The synchrotron radiation power spectrum . . . 33
1.9 Position of known VHE γ-ray sources . . . 35
1.10 Logo and the image of the Fermi Gamma-ray Space Telescope. . . 37
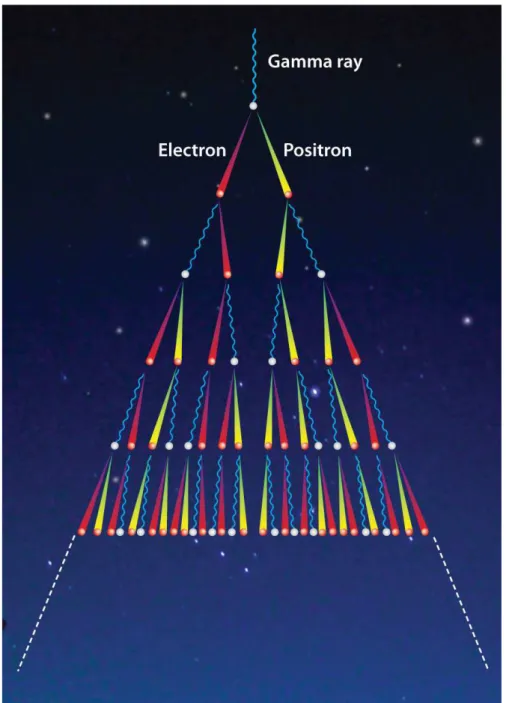
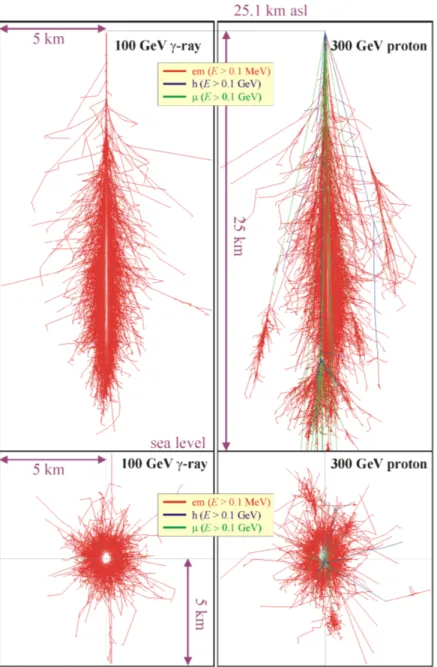
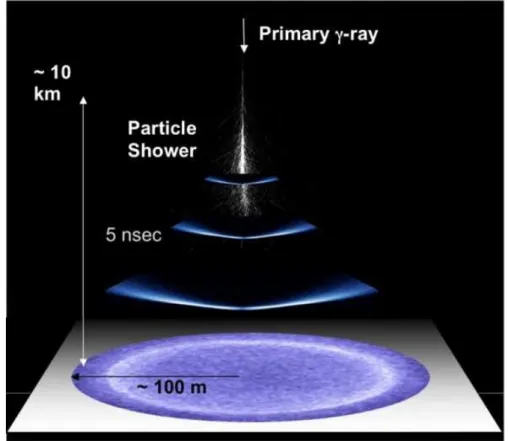
1.11 A sketch of a development of an electromagnetic EAS induced by aγ-ray 40 1.12 Vertical and horizontal projection of a Monte Carlo simulation of an EAS initiated by a 100 GeV γ-ray and a 300 TeV proton . . . 41
1.13 A sketch of aγ-ray induced shower and the Cherenkov light pool it creates 44 1.14 Schematic spectral energy distributions of the most important background radiation . . . 45
1.15 A collection of EBL SEDs obtained by different methods . . . 47
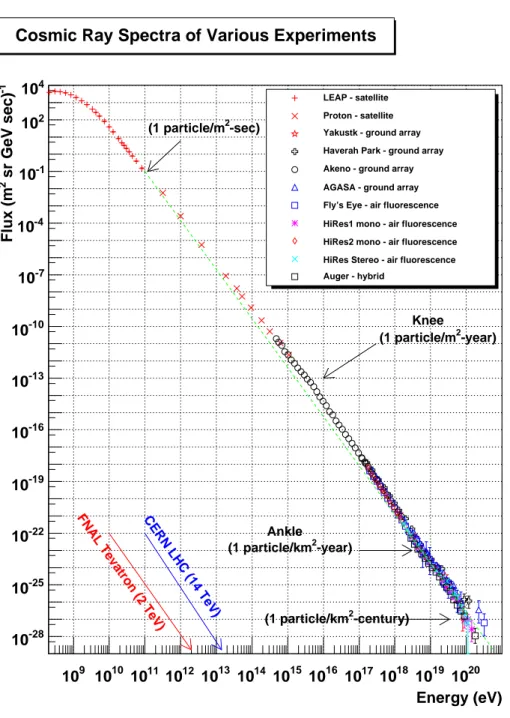
1.16 Compilation of measurements of the cosmic ray spectrum . . . 48
2.1 MAGIC telescopes at the Observatorio del Roque de los Muchachos . . . 50
2.2 Side view of the MAGIC-I telescope . . . 51
2.3 Front view of MAGIC-I reflector dish . . . 52
2.4 Front and back view of the MAGIC-II camera . . . 53
2.5 Front and back view of the old MAGIC-I camera, with pixels of two different sizes. . . 54
2.6 Website of the iScream monitoring tool. . . 60
2.7 Locations and functionalities of different parts of iScream. . . 61
2.8 Standard MAGIC analysis chain . . . 65
2.9 Reconstructed image of an EAS in MAGIC-I camera configuration, with some of the main image parameters . . . 67
2.10 Geometry of EAS observation . . . 70
2.11 An example of aθ2 plot . . . . 72
2.12 An example of a power-law shaped spectrum . . . 75
2.13 An example of a light curve . . . 75
2.14 An example of asignificance.C output. . . 77
3.1 Jet of M87 at different frequencies and scales . . . 81
3.2 Evolution of excess events from M87 over dead-time-corrected observing time . . . 85
3.3 Light curve of the integralγ-ray flux above 100 GeV during the 2005–2007 MAGIC observing period . . . 86
3.4 The combinedFermi-LAT and MAGIC differential energy flux over four orders of magnitude in energy starting from 100 MeV up until 2 TeV . . . 87
3.5 Combined M87 light curves for the 2008 multiwavelength campaign . . . 89 3.6 SED of M87 in the quiescent state . . . 91 3.7 A sketch of the “spine-layer” model . . . 93 3.8 Amplification factors for the emission from different components of the
jet, with respect to the viewing angle . . . 97
4.1 A schematic description of the MAGIC PKS 1222+21 campaign . . . 101
4.2 PKS 1222+21 light curve above 100 GeV, in 6 minutes bins, for 2010 June 17 . . . 104 4.3 Observed and intrinsic differential energy spectrum of PKS 1222+21 as
measured by MAGIC on 2010 June 17 . . . 105 4.4 Radio and millimetre light curves of PKS 1222+21 for the period between
2009 January 1 (MJD 54837) and 2011 February 28 (MJD 55620) . . . . 111 4.5 Total intensity and linear polarization images of PKS 1222+21 observed
by VLBA at 15 GHz in different epochs as part of the MOJAVE program 112 4.6 Multiwavelength light curves of PKS 1222+21 for the 2010 April 9 –
Au-gust 4 (MJD 55295–55412) period . . . 113 4.7 Spectral energy distribution of PKS 1222+21 duringγ-ray flaring episodes
of 2010 April 29 and 2010 June 17, and and a quiescent state . . . 117
5.1 θ2 distribution of ON-source and OFF-source events . . . 127
5.2 MAGIC light curve for energies above 150 GeV; one point per night . . . 128 5.3 Combined light curve for year 2013 . . . 133 5.4 H1722+119 spectral energy distribution . . . 134
6.1 Distribution of MAGIC AGN according to redshift. . . 139 6.2 Intrinsic spectral slope of MAGIC AGN grouped according to the spectral
6.3 Intrinsic spectral slope of MAGIC AGN grouped according to the AGN class versus redshift . . . 141
2.1 Periods in the MAGIC experiment history based on hardware upgrades and observation modes . . . 57
3.1 Input parameters for the “spine-layer” scenario shown in Figure 3.6 . . . 95
4.1 Daily upper limits estimated by MAGIC for E>150 GeV assuming a spectrum slope 3.7. . . 103
4.2 List of facilities used in this study and frequency bands in which the observations were performed. . . 107
4.3 Parameters for the SED shown in Figure 4.7 . . . 120
5.1 Flux densities of H1722+119 in optical – UV bands measured by Swift-UVOT. . . 129
Chapter 1
Introduction
Very high energy (VHE, 100 GeV – 10 TeV) γ-ray astronomy is a relatively new field of research. Technological means to observe the most energetic processes in the universe have been accessible only in the past few decades. γ-rays only partially penetrate atmo-sphere, creating cascades of particles and depositing their energy. Ground based γ-ray observatories use atmosphere as a calorimeter, detecting faint flashes of light known as Cherenkov radiation. This methodology is very similar to the one used in elementary particle and nuclear experiments.
Active galactic nuclei (AGN) are bright compact regions in the centres of galaxies emit radiation across the entire electromagnetic spectrum. They are believed to be powered by accretion of matter by supermassive black holes (SMBH), that exist in centre of every massive galaxy. Some AGN form collimated jets through which accreted matter is ejected at ultrarelativistic speeds. AGN may, thus, also be considered giant natural particle accelerators1.
For these reasons the study of AGN inγ-ray energy band is considered a hybrid between astrophysics and elementary particle physics. This new field is known as astroparticle physics.
1There are indications of protons and heavier atomic nuclei being accelerated to energies above
The most widely accepted description of AGN structure and physical mechanisms is usually referred to as the AGN paradigm [2]. According to this description, SMBH in galactic centres actively accrete matter, which forms a thin accretion disc. Clouds of gas at approximately (1.6−6.7)×1014m from the SMBH have to orbit the black hole
very rapidly in order to maintain their distance, while the clouds of gas further away, at 1017
−1019m from the SMBH rotate at lower rate [3]. Nucleus is surrounded by
a torus of dust. Approximately 10% of AGN form collimated jets of matter at their poles [4]. The accreted material is propelled through the jets at relativistic speeds. The matter in the accretion disc is ionised, so it is a source of optical and UV continuous thermal radiation. Clouds of gas, that rotate around the nucleus, absorb and reprocess radiation coming from the accretion disk and emit it in the optical and the UV band. The emission lines visible in the spectrum are broadened because of the Doppler effect. The effect is larger for the faster rotating gas clouds, so they are called broad (emission) line region (BLR), while the clouds further away from the nucleus are called the narrow (emission) line region (NLR). Torus is opaque and it obscures the view of the nucleus, if observed under higher angles. It itself is a source of continuous thermal radiation in IR band. Jets are sources of continuous non-thermal radiation of all wavelengths, from radio to VHE γ-rays.
The AGN paradigm will be presented in more details in Section 1.1.2. Although accepted as a broad description of AGN, there are many open questions that we need to answer in order to fully understand the nature of AGN. The most fundamental question is how is the gravitational and rotational energy of SMBH transferred to particles to form jets? To put it more specifically, through which mechanisms are particles accelerated to ultrarelativistic energies, and how are they collimated to form narrow jets? Studying γ-ray emission from AGN carries the potential to shed light on these questions. γ-rays constitute a significant part of the electromagnetic radiation from AGN. Even more important is the fact that γ-rays are produced through inverse Compton scattering, particle-antiparticle annihilation, or particle decay, which are fundamentally different physical processes compared to synchrotron or thermal emission, which is responsible
for electromagnetic radiation in lower energy bands. Therefore, through observations of AGN inγ-ray energy band we access information that is not available in electromagnetic radiation of lower energies. The most important questions regarding the production of γ-rays in AGN are discussed in Section 1.1.5.
All of the AGN that emit VHE γ-rays have jets, and as we shall see in Section 1.1.3 the majority of them are blazars, meaning that the angles between the axes of their jets and our line of sight is up to only a few degrees. To-date only four non-blazar AGN were detected in the VHE γ-ray band (M87 [5], Centaurus A [6], NGC 1275 [7], and IC 310 [8]), and they are classified as radio galaxies. Blazars are subdivided according to the characteristics of their spectra into two classes: BL Lacs and flat spectrum radio quasars (FSRQ). We will see in Section 1.1.3 that members of these two classes are not equally distributed according to the distance to the Earth, FSRQs being more common at larger distances. As a result only three FSRQs have been detected in the VHE γ-ray band so far2.
The first relativistic jet was discovered by H. D. Curtis [9] in 1918. It is propelled by the AGN in a radio galaxy Messier 87 (M87). However, the first AGN detected in the VHE γ-ray band was a blazar Markarian 421, detected by the Whipple telescope in 1992 [10]. The VHE γ-ray emission from M87 was first detected by the HEGRA collaboration in 2003 [5]. The discovery was confirmed by the H.E.S.S. collaboration in 2006 [11]. It was the first detection of VHE γ-rays from a non-blazar AGN.
In this study, we analyse the VHE γ-ray emission from three sources observed with MAGIC telescopes. The main purpose was to understand the similarities and differences between VHE γ-ray emission in different classes of AGN. Therefore, we have chosen one source from each of the AGN classes mentioned above: a radio galaxy M87, a FSRQ PKS 1222+21, and a BL Lac H1722+119, described in more detail below. We study characteristics of their VHE γ-ray emission, and include also observations performed at lower energy bands.
2This is a consequence of attenuation of VHE γ-ray flux by the extragalactic background light as
Messier 87 (M87) is a giant radio galaxy, and the closest AGN to the Earth at a distance of 16.7±0.2 Mpc [12]. It is the centre of the Virgo cluster, and of our local universe. Due to its proximity, M87 offers an opportunity to study the jet structure in details. Other studies of M87 in the VHEγ-ray band ([11, 13, 14, 15, 16], etc.) are focused on studying variability of the source. Given the sparsity ofγ-rays, episodes of pronounced variability and enhanced emission are very practical because a large amount of data can be collected in a shorter observation time. Even more interesting is the fact that variability can be used to set constraints on the size of the emission region (see Section 1.1.4), or to identify γ-ray emission regions by comparing γ-ray light curves with emission in lower energy bands3. Nevertheless, we have chosen to study the source in a stable quiescent state.
Our goal was to understand whether there is a base line emission that is stable over a long period of time. M87 was a good candidate for this kind of study, because it was (and still is) regularly observed during several years. A study based on contemporaneous observations by all three currently active Cherenkov telescopes (H.E.S.S., MAGIC and VERITAS) and VLBA at 43 GHz in 2007 and 2008 [14] suggested that the VHE γ-ray emitting region is located in the nucleus of M874. Therfore, in our study, we tried to find
a scenario that would explain the observed radiation with the emission region located within the nucleus. We suggest a structured jet model that was developed by Tavecchio and Ghisellini [17].
PKS 1222+21 is a FSRQ at a redshift ofz = 0.432 [18], and only third object of this class detected in the VHEγ-ray band so far. At the time of discovery, it was the second most distant source of the VHE γ-radiation with a well known redshift. MAGIC measured flux variability on the order of 10 minutes, which indicates a very compact emission region (see expression 1.13). In addition, the VHE γ-ray spectrum shows no sign of a cut-off at least up to 130 GeV, which suggests that the emission region is outside of the BLR. This result is quite different from the case of M87. We also collected data from observations in lower frequency bands and divided them in three separate subsamples 3As we shall see in Sections 1.2.4 and 2.1.3 the angular resolutions ofγ-ray detectors are too small
to determine the position of theγ-ray emitting region by direct observation.
according to the source activity. We propose an emission scenario that explains the fast variability and lack of cut-off in the VHE γ-ray band with the γ-ray emission region located outside of the BLR.
H1722+119 is classified as a BL Lac object [19, 20]. Very little is known about this source. Linford et al. [21] (source name: F17250+1151) described it as a compact source with a short jet. The redshift is not determined. In the most recent study Farina et al. (priv. comm.) were unable to detect the host galaxy in the optical band. They set a lower limit on redshift at 0.4. The VHE γ-ray emission was first detected by the MAGIC telescopes in 2013 [22]. We combined results from the observations performed with the MAGIC telescopes with data from quasi simultaneous observations in lower frequency bands to study multiwavelength characteristics of the source. We used MAGIC and Fermi-LAT data to estimate the most likely redshift of the source, pointing out another application for observations in γ-rays.
It should be noted that these three campaigns were rather different considering the observation strategy. While M87 was monitored over a period of three years, the other two campaigns were significantly shorter. Also M87 was already a confirmed source of VHE γ-rays at the time the analysis was performed, while no VHE γ-ray signal was detected from PKS 1222+21 or H1722+119 before. Therefore, the PKS 1222+21 and H1722+119 data had to be analysed promptly after each observation. Still, these two sources required somewhat different approaches. In case of H1722+119, the flux was quite constant, so each observation contributed until the statistical significance was high enough to claim the discovery. PKS 1222+21, on the other hand, had a very unstableγ-ray flux during the campaign. After first several observations it was apparent that the signal was below the telescope sensitivity, unless it was in a strong flaring state. Although the data analyses for these sources were the same in principal, the differences we just mentioned required the analyser to adapt to specific tasks. Even more so considering there were time lapses of few years between campaigns, during which the instrument was significantly upgraded (see Table 2.1), requiring modifications of software analysis.
In the rest of this chapter we will cover our present understanding of AGN and introduce the field of γ-ray astronomy. The VHE γ-ray observations used in this study were performed using the MAGIC telescopes. The experiment, observation techniques, and data analysis are described in Chapter 2. Characterisation of VHE γ-radiation from M87, PKS 1222+21 and H1722+119 is presented in Chapters 3, 4 and 5, respectively. Our conclusions are summarised in Chapter 6.
1.1
Active galactic nuclei
Active galactic nuclei are accreting supermassive black holes (SMBH) in the centres of galaxies that emit radiation across the entire electromagnetic spectrum. Although some of the radiation can be explained as thermal radiation, there is an obvious non-thermal component in the spectrum. The origin of the non-non-thermal radiation is still not unambiguously explained. Several different groups of theoretical models offer possible explanations to the emission mechanisms. In this section we will cover our present understanding of AGN, and state some open problems.
1.1.1
Supermassive black holes
Some AGN are so bright that they outshine the entire galaxy in which they reside. Considering also that the emission region is quite compact, we believe that the observed radiation is a consequence of accretion of matter by SMBH. The geometry of empty spacetime around a spherical mass is described by the Schwarzschild metric [23]
ds2 =1− rS r c2dt2−1− rS r −1 dr2−r2 dθ2+ sin2θdφ2 , (1.1)
where cis the speed of light in vacuum, and rS is the Schwarzschild radius given as
rS=
2GM
Here G is the gravitational constant and M is the mass with the centre of gravity at r = 0. We see that the Schwarzschild metric has singularities at r = 0 and r = rS.
Unlike r = 0, which is a true singularity, r = rS is a consequence of our choice of
coordinate system. Nevertheless, a spherical surface located at rS from the centre of
gravity of the mass M has some interesting properties. If rS is reachable, that is if the
physical radius in which the mass M is contained is smaller than rS, a black hole (BH)
will form. A space-time curvature at region bounded by rS is such that a photon from
that region will never cross the r = rS surface in a finite time, and events occurring
within that region will not affect the region outside of the r = rS surface. For that
reason the r =rS surface is called an event horizon.
BHs can be divided in several classes according to their mass: micro black holes, stellar mass black holes, intermediate mass black holes and SMBHs.
It is a commonly accepted belief that a centre of every massive galaxy harbours a SMBH. The smallest SMBH known so far is the one in the centre of late-type bulgeless disc galaxy NGC 4178 [24] with the estimated mass of M = 2.0+8−1..26×105M
⊙ (obtained
from X-ray and radio luminosity; the possible range of mass is ∼104
−105M
⊙), where
M⊙ denotes the solar mass i.e. (1.98855± 0.00025)× 1030kg. The largest SMBH
found so far is located in a giant elliptical galaxy NGC 4889. The mass is estimated to (0.55−3.7)×1010M
⊙, with the best fit of 2.1×10¹⁰M⊙ [25]. From equation (1.2),
we can easily calculate that the Schwarzschild radius for this SMBH is 6.2×10¹³m,
which is over 400 astronomical units. Detections of binary systems of two SMBHs in the centres of galaxies have also been reported. The elliptical radio galaxy 4C +37.11 (Galaxy 0402+379) [26] is the most interesting case because the two SMBHs are of comparable masses with the shortest projected separation between them detected so far of only 7.3 pc (24 ly). The system has a combined mass of ∼ 1.5×10⁸M
⊙, with the
orbital period of ∼ 1.5×10⁵yr. It is believed that systems like this one resulted from
a collision of two massive galaxies, each of which hosted a SMBH in the centre.
A SMBH in the centre of Milky Way galaxy is positionally consistent with a radio source Sagittarius A* [27], and has a mass of (4.31±0.36) ×106M
distance to the galactic centre to be R0 = 8.33 kpc). The largest SMBH in the Milky
Way’s neighbourhood appears to be that of giant elliptical galaxy Messier 87 (M87), with the mass of (6.4±0.5)×109M
⊙ [28]. SMBHs exhibit a correlation between their
masses and properties of the host galaxy bulge component [29], e.g. the mass of the SMBH is typically 0.1% of the stellar mass of the host galaxy’s bulge [30, 31]. This leads to a conclusion that the evolutions of SMBHs and their host galaxies are interconnected.
However, there are examples of large deviations from this behaviour. Some recent discoveries may demand modifications of galaxy — SMBH co-evolution models [32, 33]. The most prominent example is a compact, lenticular galaxy NGC 1277. The entire galaxy has a mass of 1.2×10¹¹M
⊙, while the SMBH in its centre has a mass of 1.7×
1010M
⊙, which constitutes incredible 59% of the galaxy’s bulge mass [34]. A SMBH
has also been discovered in the centre of a dwarf galaxy. A peculiar case of an irregular starburst galaxy Henize 2-10 [35] shows that even galaxies without a bulge can host a SMBH. Moreover, this example could imply that the SMBH formed prior to the galactic bulges. Similar to NGC 1277, the mass of the SMBH in Henize 2-10 (∼2×10⁶M
⊙) is
quite large compared to the mass of the host galaxy (3.7×10⁹M
⊙). Interesting as the
case of Henize 2-10 my be, it is still too early to extend the conjecture of every galaxy harbouring a SMBH to dwarf galaxies, e.g. as far as we know there is no SMBH in a satellite galaxy of the Milky Way, the Large Magellanic Cloud.
Using equation (1.2), we can see that the average density inside of a BH decreases as the mass of the BH increases
ρ= 4Mπ
3 r3S
= 3c
6
32πG3M2, (1.3)
so larger BHs will have lower average density. It is interesting to note that the average density inside of a BH of mass greater than 1.36×10⁸M
⊙ will be less than the density
of water (103kg/m3).
The Schwarzschild metric is a solution to the Einstein field equations, obtained assuming that the mass is stationary and electrically neutral. Although numerical simulations
show that stationary black holes can form jets, the outflow is stronger for rotating black holes [36]. The gravitational field outside of a rotating uncharged axially-symmetric black hole is described by the Kerr metric [37, 38]
ds2 = 1− rSr ρ2 c2dt2−ρ 2 ∆dr 2 −ρ2dθ2− − r2+α2+rSrα 2 ρ2 sin 2θ sin2θdφ2+2rSrαsin 2θ ρ2 cdtdφ, (1.4) with substitutes α≡ J M c, (1.5) ρ2 ≡r2 +α2cos2θ, (1.6) ∆≡r2 −rSr+α2. (1.7)
rS is the Schwarzschild radius given in expression (1.2), and J denotes the angular
momentum of a black hole. The amount of angular momentum of a black hole is usually expressed in a convenient dimensionless parameter
a= cJ
GM2. (1.8)
For a stationary BH a = 0, and the Kerr metric becomes Schwarzschild metric. A maximally rotating BH has a = 1. The radius of the event horizon will now include a factor dependant on the spin of the BH
rin =
1 2rS
1 +√1−a2. (1.9)
Another physically important surface is determined by the sign change of the purely temporal component of the metric
rout =
1 2rS
The space between surfaces determined byrinandrout is called theergosphere. A particle
within the ergosphere can cross the event horizon and fall into the BH, but it can also leave the ergosphere by crossing the surface defined by rout. But, due to relativistic
effects, while inside the ergosphere, it has to rotate in the same direction of the central mass.
Using radio interferometry observations at 1.3 mm wavelength, the spin of the SMBH in giant elliptical galaxy Messier 87 (M87) was set to a > 0.2 [39]. In the most general case, a BH has some net electric charge, but it is unlikely for an astrophysical BH to have enough charge to be dynamically important.
1.1.2
AGN paradigm
Around 1% of SMBHs actively accrete matter. According to the most widely accepted description of AGN, the so-called AGN paradigm [2], actively accreting SMBH are engines that power AGN. Matter falling into the black hole usually forms a thin disc, called an accretion disc. An accretion disc is defined by its inner (rin) and outer radii
(rout). rin is the innermost stable orbit, and it depends on the rotation of the BH. For
non-rotating BHs rin = 6rg, where rg is the gravitational radius, equal to the 1/2 of
the Schwarzschild radius. rg is obtained by equating the centrifugal force of a particle
rotating at the speed of light around a BH, with the gravitational force. For maximally rotating Kerr BHs rin = (1 −1.2)rg. rout is less strictly determined. Once the self
gravity of the disc in the vertical direction becomes greater than the vertical component of the central gravitational filed, the matter will start to form small clumps, and will no longer keep the form of a thin disc. Due to the intense gravitational gradient within the disc, a strong friction occurs between its layers, resulting in high temperatures and ionisation of matter. Accretion disc is a source of thermal electromagnetic radiation. Most of the radiation is emitted from the region around 10rg (see [40] for a review).
The peak of the spectral energy distribution is usually in the optical/UV energy band, and is called the big blue bump. The accretion disc is enclosed in a spherical shell of
HE electrons, the so-calledcorona. Electrons upscatter the radiation from the accretion disc through inverse Compton to produce X-rays [41]. The nucleus is surrounded by gas clouds distributed in a spherical shell at distance of around (1.6−6.7)×1014m.
Atoms in those clouds absorb radiation from the accretion disc and emit lines in the optical and the UV band. Because of the vicinity of the clouds to the black hole, they revolve around it at velocities of (1−25)×103km/s. As a consequence their emission
is Doppler shifted in a wide range, hence Broad (emission) Line Region (BLR). The number density of the gas in the BLR is >109cm−3, with the total mass estimated to
103 −104M
⊙ (see [3] for a review). The gas clouds at distances of few parsec to few
hundred parsec (1017
−1019) m from the black hole orbit at lower velocities (<500) km/s
so their emission lines are much narrower, hence Narrow Line Region (NLR). The gas in the NLR has lower density (≈ 103cm−3). The black hole, accretion disc and BLR
are wrapped in a large thick torus of dust, located at around 1 parsec from the black hole, and can extend to up to hundreds of parsecs [42]. The torus is opaque to any form of electromagnetic radiation except radio, and it obscures the nucleus if viewed from a large angle. It itself is a source of IR thermal radiation. Approximately 10% of AGN eject matter through relativistic jets [4].
The torus is thick and dense enough to prevent any electromagnetic radiation passing through it. Therefore what the observer sees depends on the angle under which the AGN is being observed. Since the AGN are classified according to the emission we observe, how we classify each AGN depends in great respect on the angle its central axis spans with the direction to Earth. AGN structure is schematically illustrated in Figure 1.1, and the classification of AGN is summarised in Figure 1.2.
1.1.3
Relativistic jet
As already mentioned, approximately 10% of AGN propel matter away from the nucleus forming a conical collimated jet of relativistic matter in the direction of the AGN’s axis. Jets are sources of electromagnetic radiation of all wavelengths from radio to γ-rays.
e scattering log( )pcr Radio Galaxy Narrow Line Quasar 2 Seyfert 2 Core Dominated Radio Loud Quasar Lobe Dominated Radio Loud Quasar Radio Galaxy Broad Line reddened Quasar 1 Seyfert 1.5 Quasar 1 Seyfert 1 Broad emission Line Region Line Region Narrow emission − Region 0 1 2 3 −5 −4 −3 −2 −1 Jet −2 −3 −4 −5 −1 0 1 2 Disk Torus pc z log( )
Figure 1.1 Schematic illustration of AGN. The usual components are indicated, as well as the classes of AGN depending on the viewing angle. The scale is logarithmic. How-ever, some shapes are inconsistent with the scale in order to make them visually more comprehensible (e.g. the gas cloud in the BLR should look like a square with round corners, the base corner of conical jet should be closer to 90◦). Arrows indicate the
direction of the observation. Next to each arrow a respective class of AGN is indicated. Adopted from [43].
The emitted radiation is clearly of non thermal origin. A jet forms in the vicinity of the black hole and extends up to megaparsec distances from the nucleus (e.g. [45]). In some jets, one or several brighter spots are observed, called knots (e.g. [46]). These knots are often characterised by apparent superluminal motion, which is the result of the combination of the velocity of the emission region, and the viewing angle. Because of relativistic speeds, knots “chase” the light they emit. If the angle between the jet axis and the line of sight is small, two emitted signals will reach observer in shorter time interval than the interval between emission, and that will make the observed knot
Figure 1.2 AGN classification scheme based on host galaxy (radio loudness), optical luminosity, and inclination. Adopted from [44].
appear to be travelling faster than light. Some jets in the end extend to double, roughly ellipsoidal structures called lobes (e.g. [47]). In AGN whose inclination angle to our line of site is large enough, one can see jets emerging on both sides of the galaxy plane. Although it has not been proven, it is usually assumed that this is the case with all AGN.
We still lack a comprehensive understanding of the physics of relativistic jets, including the process of jet formation. Blandford-Znajek model [48] is the most widely accepted one. It states that the vacuum surrounding the rotating BH will be unstable, which would lead to the electromagnetic field in the vicinity of the event horizon becoming approximately force-free. They find that energy and angular momentum of rotating BH can be extracted by a purely electromagnetic mechanism. According to Blandford-Payne model [49], the angular momentum is magnetically removed from the accretion disc and transferred to the jet. Another puzzling characteristic of relativistic jets is that they stay collimated over huge distances. Possible explanations are that jets are either magnetically or kinetic energy dominated (see e.g. [50]). In the former case the jet is magnetically driven and self-collimated by the toroidal component of the magnetic field. If the jet is kinetic energy dominated, the matter propagates in a ballistic manner and stays grouped as long as it is not perturbed.
The first relativistic jet ever discovered was the one emanating from the centre of the giant radio galaxy M87 [9]. Because of its proximity to Earth, M87 was extensively observed and studied. The details on M87 and the AGN it harbours will be discussed in Chapter 3. For now it is interesting to note that all of the above mentioned properties (knots, lobes, indication of a counter-jet) have been discovered in its jet, making M87 one of the favourite laboratories for studying AGN.
So far γ-radiation has only been observed from AGN with jets, so we will restrict our study on that category of AGN.
Most of the AGN that are confirmed sources of VHE γ-rays are blazars (see Table 6.1), which means their jet’s axes close an angle of up to few degrees with the line of sight.
[Hz] ν 10 10 12 10 14 10 16 10 18 10 20 10 22 10 24 10 26 10 28 10 ] -1 s -2 [erg cm ν F ν -14 10 -13 10 -12 10 -11 10 -10 10 -9 10 MAGIC Fermi Swift/BAT RXTE/PCA Swift/XRT Swift/UVOT ROVOR NewMexicoSkies MITSuME GRT GASP WIRO OAGH SMA VLBA_core(BP143) VLBA(BP143) VLBA(BK150) Metsahovi Noto VLBA_core(MOJAVE) VLBA(MOJAVE) OVRO RATAN Medicina Effelsberg
Figure 1.3 SED of Markarian 421, a typical and one of the brightest blazars [51].
The spectral energy distribution (SED) of these sources is characterised by two peaks: a lower-energy peak in optical to X-ray region and a higher-energy peak inγ-ray region. This can be seen in Figure 1.3, which shows the SED of a typical blazar Markarian 421. Blazars are divided in two classes according to the characteristics of their emission: flat spectrum radio quasars (FSRQ) and BL Lacertae objects (BL Lac). FSRQs are known to have prominent broad and narrow emission lines, in addition to strong optical and X-ray continuum emission. Quite common feature is high and wide peak in the optical-UV region associated with thermal emission from the accretion disc. BL Lacs, on the other hand show very narrow line emission if any at all. They are characterised by a strong linear polarisation in optical and radio range. With respect to the position of the first peak in the SED, Nieppola et al. [52] subdivide BL Lacs in low-energy-peaked BL Lacs (LBL; logνs <14.5), intermediate-energy-peaked BL Lacs (IBL; 14.5< logνs <16.5),
and high-energy-peaked BL Lacs (HBL; logνs > 16.5). In Figure 1.4 we can see that
FSRQs active in HE γ-rays are more common at redshifts 1 and higher, while BL Lacs are grouped around z = 0.2. For a further discussion on differences and similarities
Redshift
0 0.5 1 1.5 2 2.5 3
Normalized number of sources
0 0.02 0.04 0.06 0.08 0.1 FSRQs Redshift 0 0.5 1 1.5 2 2.5 3
Normalized number of sources
0 0.05 0.1 0.15 0.2 0.25 BLLacs
Figure 1.4 Distribution of FSRQs (top) and BL Lacs (bottom) according to the redshift. Solid lines represent blazars in the second Fermi-LAT catalog of AGN, and dashed the complete 5 year sample of WMAP. Adopted from [55].
between FSRQs and BL Lacs see e.g. [53, 54].
Only four non-blazar AGN have been detected in VHE γ-ray band so far: M87 [5], Centaurus A [6], NGC 1275 [7], and IC 310 [8]. They are all classified as radio galaxies (RG), the type of AGN very luminous in radio band with huge input of energy to intergalactic medium (1060
− 1061erg [56]). Their axes are declined from our line of
1.1.4
Electromagnetic radiation from AGN
What is the origin of the observed radiation? In the simplest approach, emission region is modelled as a spherical blob of plasma propagating down the jet with bulk Lorentz factor Γ = (1−β2)−1/2, where β is the velocity of the blob in units of the speed of light
(β =v/c). These models are usually referred to as single zone models (see e.g. [57]). If the jet closes angle θ with our line of sight, we can define the Doppler factor
δ= [Γ(1−βcosθ)]−1. (1.11)
Due to relativistic effects, energies of observed photons will be blueshifted by a factor of δ and the variability time scales shortened by the same factor, while the observed bolometric flux will beδ4 times higher [58]. The blob is also filled with magnetic fields,
so the moving charges within it will emit synchrotron radiation. There is a general consensus that the lower-energy peak in the SED is a result of ultrarelativistic electrons emitting synchrotron radiation. In case of FSRQs, the synchrotron component will be present, but dominated by the thermal radiation from the accretion disc and the dust torus. A debate on the origin of the emission in X-ray through γ-ray bands, on the other hand, is still not settled. The two fundamentally different approaches are usually referred to as leptonic and hadronic emission models. The main difference comes from the question whether protons in AGN jets are accelerated to high enough energies to contribute significantly to observed emission.
Leptonic emission models
According to leptonic models, X-rays and γ-rays are the result of inverse Compton scattering of low energy seed photons up to TeV energies, by ultrarelativistic electrons. If the seed photons originate from synchrotron radiation of these same electrons (as is the case with BL Lacs), we talk about synchrotron self Compton (SSC) models (see e.g. [57, 59]). External Compton (EC) models (see e.g. [60]), on the other hand, are more
suited to the description of FSRQs, because seed photons are mostly thermally radiated from the BLR, the dust torus and the accretion disc, with some contribution from synchrotron radiation. The spectral distribution of electrons in the blob is described by a broken power-law (PL) N(γ) = n0γ−p1, γ < γbr n0γbrp2−p1γ−p2, γ > γbr, (1.12)
where n0 is the normalisation factor of the number density of electrons, and γbr the
Lorentz factor at the spectral break. p1 and p2 are spectral slopes below and above the
break, respectively. The break in the power-law comes from the fact that above certain energy electrons start to rapidly lose energy (cool off) through synchrotron radiation. The slope of the spectrum after the break is a balance between acceleration of electrons in the jet and cooling. The motivation for choosing the power-law in the first place comes from observations. A power-law distribution of ultrarelativistic electrons will produce a power-law distributed synchrotron radiation (see Section 1.2.2), and that is what we measure in the data. The size of the blob is usually estimated to ∼ 1016cm, and can
be constrained by the duration of any observed variability of the flux. Because of the causality, the radius of the blob has to be less than the distance the light can travel for the duration of the variability (tvar)
R≤ctvar
δ
1 +z. (1.13)
Seed photons are inverse Compton scattered on the same population of electrons to produceγ-rays. Because of the power-law spectral distribution of electrons, the scattered photons will also be power-law distributed (see Section 1.2.1). In SSC models there will be electrons with energies below and above the break, and the same will hold for synchrotron emitted photons. So there will be four combinations contributing to the inverse Compton spectrum. A cut-off in the γ-ray spectrum is possible in case inverse Compton scattering enters the Klein-Nishina regime (see Section 1.2.1). EC models
usually have additional parameters that describe the source of thermal radiation, such as the accretion disc, or dust torus luminosity, as well as the position of the γ-ray emission region. If the emission region is located inside the BLR, the photons from the accretion disc will be reflected from the gas particles in the BLR and towards the emission region. In that case, a cut-off in the VHE band is expected. VHE γ-rays annihilate with photons emitted from the gas clouds of the BLR to create electron-positron pairs, which attenuates the flux and manifests as a cut-off in the VHE part of the spectrum. In case the emission region is located outside the BLR, the source of seed photons is the dust torus, and we expect no cut-off in the VHE part of the spectrum.
The total jet power in the host galaxy reference frame is
Pj= 2πR2βΓ2Utot =Pj,par+Pj,B, (1.14)
where Utot is the total energy density in the jet [61, 62, 59]. Total jet power is the sum
of particle (Pj,par) and the magnetic field contribution (Pj,B). The factor 2 accounts for
two-sided jet. The energy density of electrons is
Ue =
Z γmax
γmin
dγγN(γ), (1.15)
where N(γ) is given in relation (1.12) while the energy density of the magnetic field is UB = B2/8π. If only synchrotron emission is present, the jet power will be minimised
under the assumption of equipartition of energy in the jet, Pj,par ≈ Pj,B. However, a
contribution from the inverse Compton scattering will in general imply a different energy density in electrons compared to the magnetic field energy density [60].
For some sources, the simplest one-zone models do not provide a satisfactory fit to the observation data, so more complex models are being devised, such as two zone models (e.g. [63]), spine-layer model [64], jets within jets model [65], decelerating jet model [66] etc.
Hadronic emission models
Hadronic models have similar configuration to leptonic, that is the emission region is imagined as a spherical blob of ultrarelativistic particles. Here, however, electrons mostly contribute to emission at lower energies with synchrotron radiation, while the higher-energy peak is a result of several processes. Protons that have energies above the threshold for photo-pion production will interact with soft photons and produce pions through
γ+ p →n +π+, γ+ p→p +π0.
Charged pions will decay to muons, electrons and corresponding neutrinos
π+→νµ+µ+ →νµ+νµ+νe+ e+,
while neutral pions will decay to two γ-rays. Neutrons will decay through β− decay to
protons, electrons, and electron anti-neutrinos. Further, protons and secondary charged particles (π±, µ±) will synchrotron radiate γ-rays. Additional γ-rays will come from
inverse Compton scattering of soft photons on secondary charged particles. Photo-pion production becomes important if protons are accelerated to energies &1019eV.
A nice overview of emission models can be found in [67] and references therein.
Hadronic models require very strong magnetic fields of few tens of Gauss (∼ 2 orders of magnitude higher than in leptonic models) in order to maintain ultrarelativistic protons within the emitting region (blob). Apart from that, hadronic models imply a high flux of neutrinos. It is expected then that a higher flux of neutrinos would be observed simultaneously to observations of higher flux of γ-rays. This has not been observed so far. According to cooperation agreement between collaborations MAGIC and IceCube South Pole neutrino observatory5, MAGIC receives alerts from IceCube about enhanced
neutrino fluxes, believed to originate in AGN. On two occasions, MAGIC observed given 5icecube.wisc.edu
AGN after such alerts, but no enhanced γ-ray signal was measured. Leptonic models do not suffer from these problems, and in general seem to be more successful in modelling observation data.
Explaining the emission from AGN
How do we go about finding physical interpretation for the observed emission from a given source? As explained in the previous two sections, particular models are used for different types of sources. The simplest class of models are one-zone SSC models. They have two peaks in the SED. The higher energy peak in γ-ray band is associated with inverse Compton scattering of seed photons on ultrarelativistic electrons. The seed pho-tons are the result of synchrotron radiation of the same ultrarelativistic electrons, and they account for the lower energy peak in optical through X-ray band. These models are usually applied to BL Lacs, because BL Lacs show no indication of any other kind of emission. Unlike BL Lacs, spectral energy distributions of FSRQs show additional contribution in optical and UV band other than synchrotron. This contribution is con-sistent with being due to the thermal radiation from the accretion disc. Additionally, thermal contribution from the dust torus might be prominent in the IR band. Obvi-ously, one-zone SSC models are not appropriate for explaining radiation from FSRQs. The physical interpretation of SSC models is not in agreement with the interpretation of observed emission, and the discrepancy between a theoretical model and the observed data would be obvious and large. When it comes to FSRQs, EC models are usually ap-plied, because we expect that a significant part of seed photons come from the accretion disc, the BLR, or the dust torus.
When choosing a model, the tendency is to use model with the least number of compo-nents. For example, we cannot justify using an EC model or a two-zone SSC model if there are no additional peaks in the SED that would suggest a contribution either from thermal radiation, or another IC scattering zone. Additionally, the simpler the model is, the less parameters it has. One-zone SSC models are usually described by nine free
parameters (see e.g. [57, 68]). In addition to n0 (the electron number density
normali-sation factor), γbr (the Lorentz factor at the spectral break), p1 and p2 (spectral slopes
below and above the break) mentioned above, minimal and maximal Lorentz factor of the electron population γmin and γmax are defined to fully specify the electron energy
distribution. The other three parameters are the radius of the emission region R, the Doppler factor δ and the magnetic field intensity B.
Once we have selected a model that is physically compatible with the observations, we choose a set of model parameters that best fit the data. Fitting is usually done by eye. It is important to realise that out goal is to propose a physical interpretation for the observed emission. This in no way excludes other possible scenarios, but shows that a particular explanation is possible. Since we are not performing any minimisation method, we cannot quantify the goodness of the fit, so our choice of applied model and parameter values is justified by the physical scenario that we choose to describe the processes in the observed source. There are several reasons we face when trying to describe the observed emission with a theoretical model. First, these models are still somewhat unrefined and there is room for fine tuning. For example, the emission region, although usually referred to as a blob, is in fact described as a perfect sphere defined only by its radius. This means that there is an abrupt boundary on the region where all of the γ-rays are produced. A sphere with a fuzzy boundary, or a gradual transition from γ-loud to γ-quiet region would probably be a more realistic description. Also, the electron energy distribution could be more precisely modelled by introducing additional breaks in the spectrum or smoothing the distribution. However, each of these corrections inevitably introduces additional free parameters into the model. There is a real danger of the parameter set outgrowing data samples. Furthermore, it is possible that we simply do not fully understand all physical processes in AGN.
From the observational point of view the problem is collecting an adequate data sample. Since models predict emission across the whole electromagnetic spectrum, we want to have as many frequency bands covered as possible. But in order to be able to constrain model parameters using observations, the data have to be strictly contemporaneous.
Simultaneous multi-instrument and multiwavelength observation campaigns are some-times organised, but only for a few sources (see e.g. [51, 69]). In all the other cases, we collect data from other observatories that were by chance taken at the same time with our observations. Overlapping is, of course, rarely perfect in these cases. If the observations do not overlap perfectly, quasi-simultaneous observations can be used, if the flux in all bands was stable during observations. However, some sources are only detectable in the VHE γ-ray band during enhanced emission states (e.g. PKS 1222+21 [70]), and in such cases the emission can be quite variable. Separating data in very short time bins and selecting strictly simultaneous observations would ensure that we are not mixing emission from different states of the source, but in this case we would be limited by the sparsity of γ-rays. Again we can use PKS 1222+21 as a good example. MAGIC telescopes detected VHE γ-radiation from PKS 1222+21 on 2010 June 17, during what was considered a quite violent flare. Nevertheless, in 30 minutes of observations, only 190 VHE γ-rays were detected [71]. So if we construct an SED in short time intervals, we will not have to consider variability having different shape across the spectrum, but tightening time intervals will result in high measurement uncertainty in the γ-ray band.
Furthermore, we face a problem of identifying the emission region. As we shall see in the dedicated sections, the angular resolution of γ-ray telescopes is 0.1◦ or lower,
which means that AGN are considered to be point like sources. Therefore, resolving the γ-ray emission region, determining its size and pinpointing the exact location by direct observation is not feasible. We saw in previous section that emission models predict that γ-ray emission regions are also sources of radiation of lower frequencies. Telescopes observing in lower frequencies have better resolution than γ-ray telescopes. This is especially true for radio telescopes, whose angular resolution can be as high a few tens of a milliseconds of arc. So by combining γ-ray observations with observations in lower frequencies we can try to identify the emission region responsible for the radiation across the entire electromagnetic spectrum. However, this is only possible if there is a similar pattern in the emission at different frequencies. That means that we need simultaneous observations to compare the light curves. It is important to note that if a
single emission zone is a source of radiation of all frequencies, and if there is a prominent emission variation, identifying it as a distinct source of radiation in different frequencies is very difficult. First of all, some of the radiation might be absorbed within the region and reprocessed. This might cause the variation pattern to disappear in some parts of the spectrum or to appear at a later time. But even if this does not happen, we have to remember thatγ-rays are emitted at much lower rates than photons in lower frequencies. Therefore, if there was a disturbance in the emission region that left its signature in the emission variation, the patterns at different frequencies will not be identical. In addition, there could be regions that are sources of e.g. radio waves, but not of γ-rays. γ-ray emission regions might also be only a part of radio emission region. In fact, from the example of PKS 1222+21, we can see that there is more than one component of radio emission, and that radio emission regions are much larger than the dimension of γ-ray emission region obtained from the causality condition (equation 1.13). Of course, there might be more than one γ-ray emission region too, but we would not be able to resolve them with current instruments.
Last, but certainly not the least problem is the difference between the instruments. Observation of electromagnetic radiation across the whole spectrum requires different observation techniques. Not just because of technical, but also fundamental reasons. This causes further dissimilarities between patterns in the signal at different frequencies, but it also means that different instruments and the analysis of data acquired with them have different methods of error assessment.
In some cases (see e.g. [72, 73]) a minimisation method is used, but these cases are exceptions rather than a rule. Mankuzhiyil et al. [72] model emission from Markarian 421, which is a very bright and very well sampled source, and the data are carefully separated in nine different contemporaneous samples. A one-zone SSC model is used, which is considered to be appropriate for Markarian 421, since it is a BL Lac type of source. A numerical minimisation method is applied to all of the samples separately and independently. There are obvious differences between parameters obtained for different samples, while the χ2 value is of the same order. So no single set of parameters can be
adopted as the characteristic one for this particular source. One could define an interval of values for each parameter, but that does not mean that modelling on some future observations data would not result in parameters having values outside those intervals. However, the real value behind this work is that the authors are able to compare pa-rameters for different states of the source, and check for possible correlation between them. Although, the objections raised above hold in this case too, they equally apply to all subsamples. Therefore, these problems should not affect the parameter comparison. Cutini et al. [73] study a FSRQ 4C +49.22 (alternative designation S4 1150+49). As expected for a FSRQ, the archival data show prominent thermal radiation from the accretion disc. Those observations were performed during a quiescent state. However, recent observations performed during a flare episode and in a post-flare state show that the non-thermal synchrotron radiation is dominant over the thermal emission from the accretion disc. The authors modelled the emission using two different models: a two-zone SSC, and a combination of a SSC and an EC model. They use a χ2 based test in
order to find out which of these models fits the data best, but the results of the χ2 test
are rather similar. For the flaring episode the results for the two-zone SSC and SSC+EC models are 0.29 and 0.44, respectively. For the post-flare state, the difference is even smaller, 0.23 and 0.20, respectively. The authors conclude that both of the adopted models are appropriate to describe the observations in these two states.
Emission from two out of three sources covered in this work is explained using leptonic models. Specifically, for the emission from M87 we chose a structured jet SSC emission model, since there is a feature in the SED that cannot be explained by a one-zone SSC model. We used a combination of SSC and EC for PKS 1222+21, which is a FSRQ with obvious thermal contribution from the accretion disc and dust torus. As we shall see in the dedicated chapters, no numerical minimisation procedure is used. In case of M87 we intended to show that it is possible to explain the observations with emission region situated close to the nucleus. We will also see that PKS 1222+21 is a very peculiar source. A combination of its very fast variability and VHE γ-ray spectrum without an apparent cut-off, was very puzzling at the moment of the discovery. It was our goal
to show that it is possible to explain the observed emission using simple one-zone SSC model in combination with EC, while other authors proposed emission scenarios with two emission zones [63], or with exotic means of transport of VHE γ-rays through the BLR [74, 75]. Particularities of the specific scenarios are explained in the dedicated chapters.
1.1.5
Open questions on AGN
There are many aspects of AGN that have not been confirmed, and many questions that remain open for discussion. Probably the most important one is the method of particle acceleration in AGN. Considering the enormous amount of energy emitted by AGN, we are convinced that this energy has to come from conversion of gravitational energy of accreted matter into kinetic by the presence of a SMBH. What exactly happens between accretion and ejection of matter through jets, and how exactly is the gravita-tional energy converted to kinetic energy is not yet clear. We have already mentioned Blandford-Znajek and Blandford-Payne models of particle acceleration, but for now we have not managed to confirm, or reject any of them. But in order to understand how the particles are accelerated to ultrarelativistic energies, we should first understand the electromagnetic radiation they produce. γ-rays are the most energetic form of the elec-tromagnetic radiation and we expect them to be created in the most extreme conditions. Since γ-radiation accounts for a significant part of energy emitted from AGN (Figure 1.3) and since γ-ray emission regions are also sources of radiation at lower frequencies, as we shall see when we discuss the emission models from AGN (Section 1.1.4), we believe that understanding the γ-ray emission would be a great step in that direction. Understanding the γ-ray emission means answering following questions: What is the correct model of γ-ray production? Where are the γ-rays produced, and what is the structure of the emission region? What is the cause of the emission variability, and is there an underlying emission that is stable between emission outburst episodes? It is also important to understand the universality of answers to these questions. Is any
![Figure 1.3 SED of Markarian 421, a typical and one of the brightest blazars [51].](https://thumb-ap.123doks.com/thumbv2/123dok/3731138.2454758/35.892.176.734.162.521/figure-sed-markarian-typical-brightest-blazars.webp)
![Figure 1.8 The synchrotron radiation power spectrum. Adopted from [80].](https://thumb-ap.123doks.com/thumbv2/123dok/3731138.2454758/53.892.184.748.167.417/figure-synchrotron-radiation-power-spectrum-adopted.webp)

![Figure 1.15 A collection of EBL SEDs obtained by different methods. Adopted from [108].](https://thumb-ap.123doks.com/thumbv2/123dok/3731138.2454758/67.892.168.743.157.623/figure-collection-ebl-seds-obtained-different-methods-adopted.webp)