35
Appendix 1. The result of normality with Kolmogorov-Smirnov method and descriptive
Tests of Normality
Kolmogorov-Smirnov(a) Shapiro-Wilk
Statistic df Sig. Statistic df Sig. VISKO .083 70 .200(*) .969 70 .076
AW .103 70 .063 .913 70 .000
KA .100 70 .082 .947 70 .005
JML_MO .100 70 .077 .968 70 .071
* This is a lower bound of the true significance. a Lilliefors Significance Correction
Descriptives
Statistic Std. Error
Mean .84750 .008267
Lower Bound .83101 95% Confidence
Interval for Mean Upper Bound
.86399
5% Trimmed Mean .84708
Median .83600
Variance .005
Std. Deviation .069169
Minimum .750
Maximum .954
Range .204
Interquartile Range .13200
Skewness .156 .287
AW
Kurtosis -1.408 .566
Mean 41.318245 .4912990
Lower Bound 40.338130 95% Confidence
Interval for Mean Upper Bound
42.298360 5% Trimmed Mean 41.232635
Median 40.703250
Variance 16.896
Std. Deviation 4.1105024
Minimum 35.0124
Maximum 49.5607
Range 14.5483
Interquartile Range 7.204325
Skewness .303 .287
KA
36
VISKO Mean 463.5714 16.10882
95% Confidence Interval for Mean
Lower Bound
431.4352
Upper Bound
495.7077
5% Trimmed Mean 463.8889
Median 450.0000
Variance 18164.596
Std. Deviation 134.77610
Minimum 200.00
Maximum 700.00
Range 500.00
Interquartile Range 200.0000
Skewness .071 .287
Kurtosis -.799 .566
JML_MO Mean 4.9480 .18991
95% Confidence Interval for Mean
Lower Bound
4.5691
Upper Bound
5.3269
5% Trimmed Mean 4.8409
Median 4.2600
Variance 2.525
Std. Deviation 1.58888
Minimum 3.00
Maximum 9.10
Range 6.10
Interquartile Range 1.4950
Skewness 1.029 .287
1
Appendix 2. The result of chemical
water activity analysis
Univariate Analysis of Variance
Between-Subjects Factors
Value
Label
N
Kons_Jahe 1.00
0%
14
2.00
0.5%
14
3.00
1
14
4.00
1.5%
14
5.00
2%
14
Umur_sim .00
10
1.00
10
2.00
10
3.00
10
4.00
10
5.00
10
6.00
10
Descriptive Statistics
Dependent Variable: AW
Kon_Jahe Umur_sim Mean
Std.
Deviation
N
.00
.76100
.005657
2
1.00
.78900
.002828
2
2.00
.82800
.004243
2
3.00
.85800
.004243
2
4.00
.89900
.004243
2
5.00
.93850
.002121
2
6.00
.95200
.002828
2
0%
Total
.86079
.070237
14
.00
.76000
.005657
2
1.00
.78650
.002121
2
2.00
.82150
.003536
2
3.00
.86300
.002828
2
4.00
.89250
.004950
2
5.00
.93550
.003536
2
6.00
.95100
.002828
2
0.5%
Total
.85857
.070129
14
.00
.75550
.002121
2
1.00
.77750
.002121
2
1
2
3.00
.83600
.001414
2
4.00
.88000
.002828
2
5.00
.92750
.003536
2
6.00
.94950
.002121
2
Total
.84821
.070899
14
.00
.75100
.001414
2
1.00
.76900
.002828
2
2.00
.80150
.004950
2
3.00
.82700
.004243
2
4.00
.86800
.004243
2
5.00
.91900
.001414
2
6.00
.94700
.001414
2
1.5%
Total
.84036
.071386
14
.00
.75000
.000000
2
1.00
.76500
.001414
2
2.00
.79350
.009192
2
3.00
.80950
.003536
2
4.00
.84200
.005657
2
5.00
.90850
.002121
2
6.00
.93850
.002121
2
2%
Total
.82957
.068528
14
.00
.75550
.005503
10
1.00
.77740
.010058
10
2.00
.81120
.013919
10
3.00
.83870
.021024
10
4.00
.87630
.021536
10
5.00
.92580
.011755
10
6.00
.94760
.005400
10
Total
Total
.84750
.069169
70
Tests of Between-Subjects Effects
Dependent Variable: AW
Source
Type III
Sum of
Squares
df
Mean
Square
F
Sig.
Corrected Model
.330(a)
34
.010
719.711 .000
Intercept
50.278
1
50.278
3732190
.483
.000
Kon_Jahe
.009
4
.002
174.605 .000
Umur_Sim
.318
6
.053
3928.49
7
.000
Kon_Jahe * Umur_sim
.003
24
.000
8.365
.000
Error
.000
35
1.347E-05
Total
50.608
70
Corrected Total
.330
69
3
Estimated Marginal Means
Grand Mean
Dependent Variable: AW
95% Confidence Interval
Mean
Std.
Error
Lower
Bound
Upper
Bound
.848
.000
.847
.848
Post Hoc Tests
KON_JAHE
Homogeneous Subsets
AW
Duncana,b
14 .82957
14 .84036
14 .84821
14 .85857
14 .86079
1.000 1.000 1.000 .119
KON_JAHE 2%
1.5% 1 0.5% 0% Sig.
N 1 2 3 4
Subset
Means for groups in homogeneous subsets are displayed. Based on Type III Sum of Squares
The error term is Mean Square(Error) = 1.347E-05. Uses Harmonic Mean Sample Size = 14.000. a.
4
UMUR_SIM
Homogeneous Subsets
AW
Duncana,b
10 .75550
10 .77740
10 .81120
10 .83870
10 .87630
10 .92580
10 .94760
1.000 1.000 1.000 1.000 1.000 1.000 1.000
UMUR_SIM .00
1.00 2.00 3.00 4.00 5.00 6.00 Sig.
N 1 2 3 4 5 6 7
Subset
Means for groups in homogeneous subsets are displayed. Based on Type III Sum of Squares
The error term is Mean Square(Error) = 1.347E-05. Uses Harmonic Mean Sample Size = 10.000. a.
Appendix 3. The result of chemical (moisture content) analysis
Univariate Analysis of Variance
Between-Subjects Factors
0% 14
0.5% 14
1 14
1.5% 14
2% 14
10 10 10 10 10 10 10 1.00
2.00 3.00 4.00 5.00 KON_JAHE
.00 1.00 2.00 3.00 4.00 5.00 6.00 UMUR_SIM
Descriptive Statistics
Dependent Variable: KA
36.699300 .0084853 2
38.659050 .0154856 2
40.303550 .1095308 2
42.554750 .1177333 2
45.558450 .0348604 2
46.441650 .2918230 2
49.394750 .2346887 2
42.801643 4.3871070 14
36.331750 .0215668 2
38.258050 .2312946 2
39.781300 .0033941 2
41.277950 .0894490 2
44.598300 .0322441 2
46.437100 .0111723 2
48.191450 .0053033 2
42.125129 4.2293897 14
36.639350 .2717411 2
38.848800 .1115815 2
39.738450 .1106622 2
41.582325 .0485429 2
43.222725 .0861610 2
46.433525 .0648770 2
48.533300 .2630437 2
42.142639 4.0712753 14
35.229000 .0000000 2
36.924100 .0000000 2
37.464000 .0000000 2
39.184100 .0000000 2
40.827900 .0000000 2
44.292500 .0000000 2
45.632600 .0000000 2
39.936314 3.7237152 14
35.047600 .0497803 2
36.339250 .1761403 2
37.598750 .0768625 2
38.567050 .0125158 2
40.703250 .0265165 2
43.968300 .0562857 2
44.874300 .1245922 2
39.585500 3.6071356 14
35.989400 .7523624 10
37.805850 1.0537958 10
38.977210 1.2640554 10
40.633235 1.5909431 10
42.982125 2.0627117 10
45.514615 1.2005327 10
47.325280 1.8520048 10
41.318245 4.1105024 70
UMUR_SIM .00 1.00 2.00 3.00 4.00 5.00 6.00 Total .00 1.00 2.00 3.00 4.00 5.00 6.00 Total .00 1.00 2.00 3.00 4.00 5.00 6.00 Total .00 1.00 2.00 3.00 4.00 5.00 6.00 Total .00 1.00 2.00 3.00 4.00 5.00 6.00 Total .00 1.00 2.00 3.00 4.00 5.00 6.00 Total KON_JAHE 0% 0.5% 1 1.5% 2% Total
Tests of Between-Subjects Effects
Dependent Variable: KA
1165.368a 34 34.276 2544.446 .000
119503.816 1 119503.816 8871369 .000
118.206 4 29.552 2193.758 .000
1031.457 6 171.909 12761.703 .000
15.705 24 .654 48.579 .000
.471 35 .013
120669.656 70
1165.840 69
Source
Corrected Model Intercept KON_JAHE UMUR_SIM
KON_JAHE * UMUR_SIM Error
Total
Corrected Total
Type III Sum
of Squares df Mean Square F Sig.
R Squared = 1.000 (Adjusted R Squared = .999) a.
Estimated Marginal Means
Grand Mean
Dependent Variable: KA
41.318 .014 41.290 41.346
Mean Std. Error Lower Bound Upper Bound 95% Confidence Interval
Post Hoc Tests
KON_JAHE
Homogeneous Subsets
KA
Duncana,b
14 39.585500
14 39.936314
14 42.125129
14 42.142639
14 42.801643
1.000 1.000 .692 1.000
KON_JAHE 2%
1.5% 0.5% 1 0% Sig.
N 1 2 3 4
Subset
Means for groups in homogeneous subsets are displayed. Based on Type III Sum of Squares
The error term is Mean Square(Error) = .013. Uses Harmonic Mean Sample Size = 14.000. a.
UMUR_SIM
Homogeneous Subsets
KA
Duncana,b
10 35.989400
10 37.805850
10 38.977210
10 40.633235
10 42.982125
10 45.514615
10 47.325280
1.000 1.000 1.000 1.000 1.000 1.000 1.000
UMUR_SIM .00
1.00 2.00 3.00 4.00 5.00 6.00 Sig.
N 1 2 3 4 5 6 7
Subset
Means for groups in homogeneous subsets are displayed. Based on Type III Sum of Squares
The error term is Mean Square(Error) = .013. Uses Harmonic Mean Sample Size = 10.000. a.
Appendix 4. The result of physical analysis
Univariate Analysis of Variance
Between-Subjects Factors
0% 14
0.5% 14
1 14
1.5% 14
2% 14
10 10 10 10 10 10 10 1.00
2.00 3.00 4.00 5.00 KON_JAHE
.00 1.00 2.00 3.00 4.00 5.00 6.00 UMUR_SIM
Descriptive Statistics
Dependent Variable: VISKO
675.0000 35.35534 2
562.5000 17.67767 2
500.0000 .00000 2
450.0000 .00000 2
375.0000 35.35534 2
325.0000 35.35534 2
237.5000 17.67767 2
446.4286 143.73358 14
675.0000 35.35534 2
575.0000 35.35534 2
525.0000 35.35534 2
437.5000 17.67767 2
437.5000 17.67767 2
325.0000 35.35534 2
212.5000 17.67767 2
455.3571 150.37727 14
675.0000 35.35534 2
550.0000 70.71068 2
550.0000 .00000 2
425.0000 35.35534 2
400.0000 .00000 2
350.0000 .00000 2
262.5000 17.67767 2
458.9286 137.14364 14
675.0000 35.35534 2
575.0000 35.35534 2
487.5000 17.67767 2
450.0000 .00000 2
412.5000 17.67767 2
375.0000 35.35534 2
287.5000 17.67767 2
466.0714 125.04120 14
700.0000 .00000 2
600.0000 .00000 2
525.0000 35.35534 2
512.5000 17.67767 2
425.0000 35.35534 2
375.0000 35.35534 2
300.0000 .00000 2
491.0714 132.14471 14
680.0000 25.81989 10
572.5000 34.25801 10
517.5000 28.98755 10
455.0000 34.96029 10
410.0000 29.34469 10
350.0000 33.33333 10
260.0000 35.74602 10
463.5714 134.77610 70
UMUR_SIM .00 1.00 2.00 3.00 4.00 5.00 6.00 Total .00 1.00 2.00 3.00 4.00 5.00 6.00 Total .00 1.00 2.00 3.00 4.00 5.00 6.00 Total .00 1.00 2.00 3.00 4.00 5.00 6.00 Total .00 1.00 2.00 3.00 4.00 5.00 6.00 Total .00 1.00 2.00 3.00 4.00 5.00 6.00 Total KON_JAHE 0% 0.5% 1 1.5% 2% Total
Tests of Between-Subjects Effects
Dependent Variable: VISKO
1226482.143a 34 36073.004 46.979 .000
15042892.9 1 15042892.86 19590.744 .000
16035.714 4 4008.929 5.221 .002
1188982.143 6 198163.690 258.074 .000
21464.286 24 894.345 1.165 .334
26875.000 35 767.857
16296250.0 70
1253357.143 69
Source
Corrected Model Intercept KON_JAHE UMUR_SIM
KON_JAHE * UMUR_SIM Error
Total
Corrected Total
Type III Sum
of Squares df Mean Square F Sig.
R Squared = .979 (Adjusted R Squared = .958) a.
Estimated Marginal Means
Grand Mean
Dependent Variable: VISKO
463.571 3.312 456.848 470.295
Mean Std. Error Lower Bound Upper Bound 95% Confidence Interval
Post Hoc Tests
KON_JAHE
Homogeneous Subsets
VISKO
Duncana,b
14 446.4286 14 455.3571 14 458.9286 14 466.0714
14 491.0714
.094 1.000
KON_JAHE 0%
0.5% 1 1.5% 2% Sig.
N 1 2
Subset
Means for groups in homogeneous subsets are displayed. Based on Type III Sum of Squares
The error term is Mean Square(Error) = 767.857. Uses Harmonic Mean Sample Size = 14.000. a.
UMUR_SIM
Homogeneous Subsets
VISKO
Duncana,b
10 260.0000
10 350.0000
10 410.0000
10 455.0000
10 517.5000
10 572.5000
10 680.0000
1.000 1.000 1.000 1.000 1.000 1.000 1.000
UMUR_SIM 6.00 5.00 4.00 3.00 2.00 1.00 .00 Sig.
N 1 2 3 4 5 6 7
Subset
Means for groups in homogeneous subsets are displayed. Based on Type III Sum of Squares
The error term is Mean Square(Error) = 767.857. Uses Harmonic Mean Sample Size = 10.000. a.
Appendix 5. The result of microbiological analysis
Univariate Analysis of Variance
Between-Subjects Factors
0% 14
0.5% 14
1 14
1.5% 14
2% 14
10 10 10 10 10 10 10 1.00
2.00 3.00 4.00 5.00 KON_JAHE
.00 1.00 2.00 3.00 4.00 5.00 6.00 UMUR_SIM
Value Label N
Descriptive Statistics
Dependent Variable: JML_MO
KON_JAHE UMUR_SIM Mean Std. Deviation N
.00 3.9850 .02121 2
1.00 4.1450 .02121 2
2.00 4.2600 .02828 2
3.00 5.2700 .01414 2
4.00 5.8800 .08485 2
5.00 7.4250 .02121 2
6.00 9.0750 .03536 2
0%
Total 5.7200 1.84053 14
.00 3.8600 .01414 2
1.00 4.0200 .01414 2
2.00 4.1600 .02828 2
3.00 4.7650 .54447 2
4.00 5.2850 .04950 2
5.00 7.4300 .08485 2
6.00 8.4250 .27577 2
0.5%
Total 5.4207 1.74048 14
.00 3.5500 .05657 2
1.00 3.6050 .37477 2
2.00 4.0950 .00707 2
3.00 4.2800 .08485 2
4.00 5.0550 .02121 2
5.00 5.3700 .01414 2
6.00 7.2850 .03536 2
1
Total 4.7486 1.26375 14
.00 3.0000 .00000 2
1.00 3.5450 .03536 2
2.00 3.8350 .04950 2
1.5%
4.00 4.8100 .29698 2
5.00 5.2450 .00707 2
6.00 7.2900 .04243 2
Total 4.5457 1.37202 14
.00 3.0000 .00000 2
1.00 3.0000 .00000 2
2.00 3.5700 .04243 2
3.00 3.9900 .01414 2
4.00 4.2600 .02828 2
5.00 5.2100 .19799 2
6.00 7.1050 .06364 2
2%
Total 4.3050 1.39943 14
.00 3.4790 .43895 10
1.00 3.6630 .44417 10
2.00 3.9840 .26500 10
3.00 4.4800 .53452 10
4.00 5.0580 .57253 10
5.00 6.1360 1.11531 10
6.00 7.8360 .82466 10
Total
Total 4.9480 1.58888 70
Tests of Between-Subjects Effects Dependent Variable: JML_MO
Source
Type III Sum
of Squares df Mean Square F Sig. Corrected Model 173.507(a) 34 5.103 260.062 .000 Intercept 1713.789 1 1713.789 87336.379 .000 KON_JAHE * UMUR_SIM 6.209 24 .259 13.185 .000
KON_JAHE 20.083 4 5.021 255.862 .000
UMUR_SIM 147.215 6 24.536 1250.370 .000
Error .687 35 .020
Total 1887.983 70
Corrected Total 174.194 69
a R Squared = .996 (Adjusted R Squared = .992)
Estimated Marginal Means
Grand Mean Dependent Variable: JML_MO
95% Confidence Interval Mean Std. Error Lower Bound Upper Bound
4.948 .017 4.914 4.982
KON_JAHE
Homogeneous Subsets
JML_MO Duncan
Subset
KON_JAHE N 1 2 3 4 5
2% 14 4.3050
1.5% 14 4.5457
1 14 4.7486
0.5% 14 5.4207
0% 14 5.7200
Sig. 1.000 1.000 1.000 1.000 1.000 Means for groups in homogeneous subsets are displayed. Based on Type III Sum of Squares The error term is Mean Square(Error) = .020.
UMUR_SIM
Homogeneous Subsets
JML_MO Duncan
Subset
UMUR_SIM N 1 2 3 4 5 6 7
.00 10 3.4790
1.00 10 3.6630
2.00 10 3.9840
3.00 10 4.4800
4.00 10 5.0580
5.00 10 6.1360
6.00 10 7.8360
Sig. 1.000 1.000 1.000 1.000 1.000 1.000 1.000
Means for groups in homogeneous subsets are displayed. Based on Type III Sum of Squares The error term is Mean Square(Error) = .020. a Uses Harmonic Mean Sample Size = 10.000.
Appendix 6. Questioner form
Nama : (P/L)
Umur :
Tanggal :
Berkaitan dengan penelitian yang saya lakukan tentang penambahan jahe pada produk
selai, maka saya meminta bantuan saudara/i untuk mengisi kuesioner dibawah ini. Dan
saya mengucapkan terima kasih atas kesediaan saudara/i mengisi kuesioner tersebut.
Kuesioner
Mohon mengisi tabel dibawah ini yang sesuai menurut anda, setelah sampel selai
diberikan.
Sampel
Rasa
Tekstur
Warna
Aroma
Overall
121
264
357
468
567
Kriteria pengisian nilai:
1. sangat suka
2. suka
3. kurang suka
4. tidak suka
5. sangat tidak suka
TERIMA KASIH
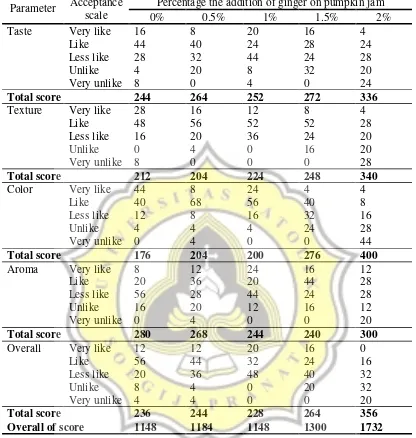
Table 7. Organoleptic analysis
Percentage the addition of ginger on pumpkin jam
Parameter
Acceptance
scale
0%
0.5%
1%
1.5%
2%
Taste
Very like
Like
Less like
Unlike
Very unlike
16
44
28
4
8
8
40
32
20
0
20
24
44
8
4
16
28
24
32
0
4
24
28
20
24
Total score
244
264
252
272
336
Texture
Very like
Like
Less like
Unlike
Very unlike
28
48
16
0
8
16
56
20
4
0
12
52
36
0
0
8
52
24
16
0
4
28
20
20
28
Total score
212
204
224
248
340
Color
Very like
Like
Less like
Unlike
Very unlike
44
40
12
4
0
8
68
8
4
4
24
56
16
4
0
4
40
32
24
0
4
8
16
28
44
Total score
176
204
200
276
400
Aroma
Very like
Like
Less like
Unlike
Very unlike
8
20
56
16
0
12
36
28
20
4
24
20
44
12
0
16
44
24
16
0
12
28
28
12
20
Total score
280
268
244
240
300
Overall
Very like
Like
Less like
Unlike
Very unlike
12
56
20
8
4
12
44
36
4
4
20
32
48
0
0
16
24
40
20
0
0
16
32
32
20
Total score
Overall of score
236
1148
244
1184
228
1148
264
1300
356
1732
The example of calculation sensory analysis (taste of ginger 0%):
Total score = (4x100 %x1)+(11x100 %x2)+(4x100 %x3)+(11x100 %x4)+(4x100 %x5)
25 25 25 25 25
= 244
Appendix 8. The result of correlations factor
Correlations
Correlations
KON_JAHE UMUR_SIM AW KA VISKO JML_MO
Pearson
Correlation 1 .000 -.166 -.299(*) .106 -.332(**) Sig. (2-tailed) . 1.000 .169 .012 .384 .005 KON_JAHE
N 70 70 70 70 70 70
Pearson
Correlation .000 1 .976(**) .935(**) -.968(**) .864(**) Sig. (2-tailed) 1.000 . .000 .000 .000 .000 UMUR_SIM
N 70 70 70 70 70 70
Pearson
Correlation -.166 .976(**) 1 .974(**) -.954(**) .909(**) Sig. (2-tailed) .169 .000 . .000 .000 .000 AW
N 70 70 70 70 70 70
Pearson
Correlation -.299(*) .935(**) .974(**) 1 -.934(**) .926(**) Sig. (2-tailed) .012 .000 .000 . .000 .000 KA
N 70 70 70 70 70 70
Pearson
Correlation .106 -.968(**) -.954(**) -.934(**) 1 -.874(**) Sig. (2-tailed) .384 .000 .000 .000 . .000 VISKO
N 70 70 70 70 70 70
Pearson
Correlation -.332(**) .864(**) .909(**) .926(**) -.874(**) 1 Sig. (2-tailed) .005 .000 .000 .000 .000 . JML_MO
N 70 70 70 70 70 70
* Correlation is significant at the 0.05 level (2-tailed).