EISSN: 2086-4094 DOI: 10.4308/hjb.21.2.76
_________________
∗Corresponding author. Phone: +82-2-8804541/4978,
Fax:+82-2-8732056, E-mail: [email protected]
Prediction of Physicochemical Properties of
Indonesian Indica Rice Using Molecular Markers
PUJI LESTARI1,2, REFLINUR1,2, HEE-JONG KOH2∗
1Indonesian Center for Agricultural Biotechnology and Genetic Resources Research and Development, IAARD Jalan Tentara Pelajar No. 3A, Bogor 16111, Indonesia
2College of Agriculture and Life Science, Seoul National University, San56-1, Kwanak-gu, Seoul, South Korea
Received October 28, 2013/Accepted May 8, 2014
Physicochemical properties determine the palatability and cooking quality of rice, which must be determined
efficiently in order to satisfy consumer demand. To date, little information exists on the use of molecular markers to predict physicochemical properties of the “indica” rice varieties found in Indonesia. The objective of this study
was to investigate physicochemical properties and genetic variation of Indonesian rice varieties, and to formulate regression equations to analyze sets of DNA markers which could predict amylose content (AC), protein content
(PC) and pasting properties of the varieties. A total of 24 Indonesian indica rice varieties were chosen based on their genetic background and agricultural characteristics. We then measured selected physicochemical properties, and genotyped the varieties using 30 DNA markers. The chosen varieties showed favorable values for PC, AC, and six rapid viscosity analyzer (RVA) pasting properties, which was supported by molecular data. As demonstrated by
principal component analysis (PCA), markers could provide a complementary method for differentiating rice varieties,
as an alternative to measuring physicochemical properties. PCA analysis also allowed us to establish marker sets using multiple regression analysis. We formulated eight model regression equations comprising data regarding 15 to 19 markers with high coefficients (R2=0.98-0.99). The formulas provided results that consistently correlated and
therefore predicted the physicochemical properties of indica rice. Further validation of these marker sets may provide rapid and efficient means for predicting the physicochemical properties of Indonesian-bred indica rice in the future.
Keywords: indica rice, molecular marker, physicochemical properties, multiple regression
___________________________________________________________________________
INTRODUCTION
Rice is one of the major cereal crops in the world and has been bred for many years. As a consequence, it has undergone many genetic changes before achieving its current form. In Asia, indica and japonica types are most commonly used, but they differ in physical and chemical properties. These differences have lead to differentiation of food habits in different regions, japonica rice denotes short grain cultivars, with a soft and sticky texture; while indica rice is typically long-grain and remains
separate, light and fluffy after cooked. There
are many types of indica rice, which are usually grown in hot climates, particularly in Southern and Southeast Asian countries such as India, Thailand, Vietnam and Indonesia (Izawa 2008; Mohapatra & Bal 2011). Tropical climate conditions in Indonesia along with consumer taste, has lead to a preference for growing indica rice over other types.
Eating and/or cooking quality is determined primarily by the physicochemical properties of rice starch, and such characteristics have been given much research attention (Ramesh et al. 1999; Kuo et
al. 2001). In evaluating rice grain quality, amylose content (AC) and protein content (PC) are among the important factors determining eating quality
(palatability) such as texture, flavor and stickiness;
and cooking qualities (such as grain elongation, gel consistency, and gelatinization temperature). However, rice varieties with similar AC may have different starch pasting viscosity. Higher AC and different levels of PC and pasting properties of indica varieties are observed in comparison with japonica rice. Genetic studies have been increasingly conducted in relation to physicochemical properties with respect to indica rice palatability/cooking quality. The most current discoveries elucidated from genetic level research has been integrated with conventional breeding in order to develop of new rice varieties (Pooni et al. 1993; Li et al. 2003; Bao
et al. 2008).
Conventional methods have commonly been used to measure the physicochemical properties of rice to inform efforts to enhance the palatability and cooking quality of rice varieties. PC and AC are typically measured based on Association of
Official Analytical Chemists (AOAC) calculations using specific equipment. Pasting viscosity can be
and amylograph. All these measurements require
large rice samples, and technically it is a difficult, inefficient, costly and time-consuming endeavor.
To provide indica rice cultivars which can satisfy consumers with respect to consumption quality, it is necessary to establish a rapid detection method to
enable efficient selection.
Advances in scientific understanding of molecular markers confirmed their potential application to
genetic research of different kinds, and for molecular-assisted breeding (Tian et al. 2005). Several types of DNA markers such as simple sequence repeat (SSR), single nucleotide polymorphism (SNP), sequence tagged-site (STS), and insertions/deletions (Indels) related to the physicochemical properties of rice
have been identified. These markers can be used for
genotyping, genetic diversity analyses and genetic mapping. DNA markers have also been used to assist in breeding programs aimed at improving the
eating quality of rice, including predicting specific
food qualities and physicochemical properties of japonica rice (Ohtsubo et al. 2002, 2003; Lestari
et al. 2009). However, no study has been published regarding detection of physicochemical properties of Indonesian indica rice using DNA markers. Most markers for physicochemical properties determining palatability/cooking quality have been developed based on polymorphic and association analyses (Bao et al. 2006a,b; Patindol et al. 2010; Zhao et al. 2012). By using molecular markers developed for japonica and indica genomes, predicting physicochemical properties of indica rice should be
much more efficient.
In this study, 24 indica rice varieties originating from Indonesia were analyzed for their physicochemical properties, and genotyped using 30 DNA markers. Genetic variation among the rice varieties was investigated and then model equations were formulated using the molecular markers in order to predict the physicochemical properties of Indonesian indica rice.
MATERIALS AND METHODS
Plant Materials and DNA Extraction. For this study, two landraces and 22 indica rice varieties/ strains bred in Indonesia were chosen from the germplasm collection of Indonesian Center for Agricultural Biotechnology and Genetic Resources Research and Development (Table 1). Information on their genetic background and known agricultural characteristics was also collected. The plant samples used for physicochemical analysis, came from all varieties and were grown using conventional cultural
practices at the experimental farm of Seoul National University, Korea. Rice grains were dried to 15% moisture content before analysis. For DNA isolation and analysis, plants for each rice variety were grown in a greenhouse until tillering stage. Genomic DNA was extracted from young leaf tissue using the cetyl trimethyl ammonium bromide (CTAB) method as described by Murray and Thompson (1980).
Primer and PCR Amplification. For DNA analysis in this study, we used a total of 30 molecular markers comprising SSR, STS, dCAPS/CAPS, and Indel. Some of these had been reported previously (Lestari et al. 2009) and some were newly developed during the study. The list of markers and their sequences is presented in Table 2. Standard PCR was carried out in a PTC-200 Peltier Thermal Cycler (MJ Research, Inc.) under the following conditions: a total of 35 cycles comprising 1 minute at 95 oC, then 30 seconds at 55 oC and finally, 1 min at 72 oC. PCR amplification of DNA was performed in a total volume of 20 μL with the following PCR reagents: 2 μL of DNA at 20 ng/μL, 2 μL of 10X buffer containing 25 mM MgCl2, 1 μL of 2.5 mM dNTPs, 1 U of Taq Polymerase (Intron
Biotechnology, Korea), and 1 μL each of forward and reverse primers (10 μM). The amplicons were
separated by electrophoresis on 3% agarose gels and/or by non-denaturing 8% polyacrylamide gels stained with ethidium bromide (Model MGV, CBG
Scientific Co.).
Measurement of Physicochemical Properties. The rice grains were hulled and milled to 91% yield. Protein content (PC) was calculated by means of multiplication of total nitrogen by 5.95 after determination of the nitrogen content of rice material using the Micro-Kjeldahl method (AOAC 1995). Amylose content (AC) of milled rice was measured by using the relative absorbancy of starch-iodine
color in solution of 100-mesh rice flour digested
according to the previous method (Perez & Juliano 1978). Pasting properties were determined on a rapid visco analyser (RVA) following the procedures listed in the manufacturer user manual (NewPort Sci.
Co., Australia). The pasting profiles of rice starch
samples were described based on six parameters: peak viscosity (PV), hot paste viscosity (HPV), cool paste viscosity (CPV), breakdown viscosity (BDV=PV-HPV), setback viscosity (SBV=CPV-PV), and consistency viscosity (CTV=CPV-HPV)
according to Bao and Xia (1999). These rice starch properties were measured and confirmed in three
replications.
Table 1. Twenty four Indonesian-bred rice varieties used in this study and their characteristics
Name Variety Pedigree Type Days to
maturity
Unhulled rice grain color Lusi/B7136C-MR-22-1-5 (Bengawan Solo)
Hairy grain surface, lowland cereh
cereh, upland cereh, new type cereh, lowland cereh, tidal swamp cereh, lowland cereh, semi new type cereh, lowland cereh, lowland cereh, lowland cereh, lowland cereh, lowland
cereh, sometime hairy, lowland cereh, lowland
cereh, sometimehairy, lowland cereh, lowland yellow, purple on tip clear yellow
changes from reference and alternate alleles, following the previous scoring method (Lestari et al. 2009). This study focused on formulation of regression equations using the binary data from a total 30 molecular markers, and the statistical means of physicochemical properties of 24 rice varieties. Thus, for the values obtained for measurements of AC, PC, and six RVA pasting properties (PV, HPV, CPV, BDV, SBV, and CTV) for each of the studied rice varieties, we simply calculated the range and mean. We searched for patterns of variation in the rice varieties by analyzing our genotyping data from DNA markers as well as the physicochemical property measurements, using Principal Component Analysis (PCA) in NTSYS (Exeter Software, Setauket, NY) package (Rohlf 1993). Then, multiple regression analysis was performed to establish any association between molecular markers and physiochemical traits, using SAS software (SAS 2002).
For statistical analysis, binary data of 30 markers along with mean values of the measurements for each trait for each rice variety, were formatted in
an Excel file and exported to SAS, then analyzed to
determine R2 values that would indicate a significant association of combination of markers. Several outputs of primer combinations from the lowest to highest R2 were obtained. Then, selection of specified number of primers combinations for each
trait was carried according to the highest R2 which showed a relatively small number of primers in the combination. By using multiple regression analysis (SAS 2002), the best model equation for prediction
was identified using physicochemical properties/
scores as dependent variables and the binary data from molecular markers as independent variables. Summary statistics, the parameter estimate with
significant t value of each marker for every
combination led to the creation of an equation: Y= a
+ bX1 + cX2…..Xn where Y= the calculated value
of each trait which is predicted; a= intercept of total
markers in the set; b, c……n = parameter estimate value in the corresponding primer; X1, X2…Xn =
binary data of each primer (zero, 0 or one, 1); plus (+) and minus (-) denote math symbols shown in parameter estimates.
Table 2. List of 30 primers and their sequences used in this study
Primer Sequences
Forward (‘5—3’) Reverse (‘5—3’)
A7 E30 F4 G4 G28 S13 T16 WK9 P3 TreB AMs GPA AcPh S3cI S3cII GBSS1 PP2 PFruc Aglu LDS BE2 Isa SS1 SBE3 P3A P4 Pul3 CBG HP P7
TGCCTCGCACCAGAAATAG
TACCTGGTTGATGTATACAGATCTGGTT ACCACTCCATATATATCATCCAAAG GAGACCGATATGCGATTC
GGCGGTCGTTCTGCGAT
GTCGTTCCTGTGGTTAGGACAGGGT GGTGAACGCTGTAGTTGGAATATA CCCGCAGTTAGATGCACCATT AACGGGCCAAAAACGGAGGT CACTCCAGTTCCTGCTCAAA CTTCCAAGGACCCCATCCT CCAAATACGCGGCCTTCT AGTTGTGGTTTAAGCATAGG CCACTCTCATGTCCTTGAAC TTCCATGATGTGCCACTCTC CAAATAGCCACCCACACCAC TTTGAATAGGTCCACTGCTT CTTCTTCTTCGGGTGTCTCG CCTCTGGAATCTTGCTATTTAGG CGAGGAGACAGACAGCATCA GCCCCGAACATGATTCTA CCTGTCTTGCACGTGCGGTA TCTAGATTGCTACACGTGAGAGG TCGGTCAATTCGGTTAGTCTCCTC AATCCAACGCATCAAGGCTGGC TGAGCTTTACCTCCCCTCCTAACC GGGTTCGCTTTCACAACACAG AGCTTCCCTAATGGCTTCGT TGGAGGAGATGTACGTCGAG AGTTAAACAACCTCCCCACTGC
TGCCTCGCACCATGAG
ATCCCTCGATCCCTCTAGCATTAT ACCACTCCATATCACCACAAGG GTGGTGTTTAGATCCAGAGACTTA GGAGAATCCCACAGTAAGTTTTTCTTTG GTCGTTCCTGCTGGTGTCTCAGAT GGTGAACGCTCAGATTTAAATATAAT CCGCAGTTAGATCAAGTGGC AACGGGCCAACGCAG CACCTCCAAAACGAATATGG CCCAACATCTCCGTCAGAAT AGTTTCTGGGCTCGGAGGA ATTGTCCTTTTCTTTAAAGTTTATTA GCCATGACATTTGGACAT
RESULTS
Physicochemical Properties of Rice. Since phenotypic characters contributed in formulation of model equations using molecular markers, 24
Indonesian indica varieties with defining food and
cooking characteristics related to physicochemical properties were selected according to the available phenotypic description of each variety (Table 1). In addition to two landraces of different texture (Rojolele and Kalimutu), there were 22 Indonesian-bred varieties with a range of AC from low (<20%) to high (>25%) and distinctive texture ranging from
fluffy to separate (Allidawati & Bambang 1989).
Most of the varieties were types adapted for lowland cultivation, and for comparison we also included a tidal swamp variety (Batanghari) and two upland varieties (Jatiluhur and Cirata). Most varieties had cereh as typical indica type, and only one variety is hairy grain surface, javanica type (Rojolele) selected for its aromatic and good taste.
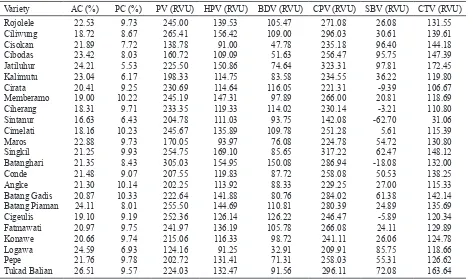
The measurement of physicochemical properties of our rice varieties (Table 3) differed somewhat in AC value, from that given by the description of the varieties but were relatively comparable. These varieties showed ranges of AC, PC, and RVA pasting-property values of indica rice. Of all of the physiochemical properties, only AC was positively skewed in the varieties. AC and PC in the varieties ranged from 16.63 (Sintanur) to 26.51% (Tukad Balian) and 5.53 (Jatiluhur) to 10.33% (Batang
Gadis) with averages of 21.38% and 8.84%, respectively. Pasting viscosity values including PV, HPV, BDV, CPV, SBV, and CTV were 219.64, 127.58, 92.06, 255.24, 35.6, and 127.66 RVU, with a range of 124.16-305.03, 91.00-169.10, 32.91-150.08, 142.08-323.31, -26.25-100.75, and 31.06-172.45, respectively. These selected physicochemical properties were very important to be examined in order to support association analysis with molecular data for the formulation of marker set.
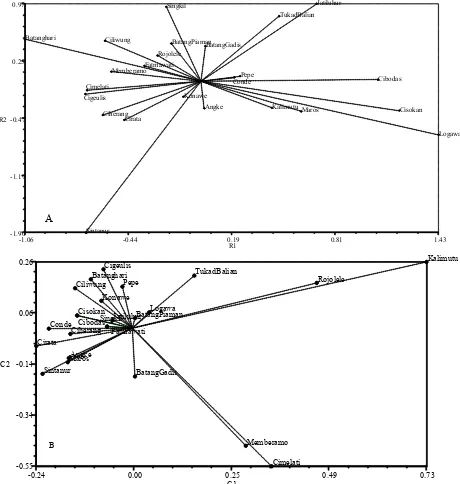
Variation of Rice Varieties. Molecular analysis using 30 markers showed genetic variation among 24 rice varieties. Examples of clear banding patterns produced by some markers in some varieties are presented in Figure 1. GPA and P3A were the polymorphic markers (Figure 1A,C) which showed differentiation among certain varieties, while S3cI was monomorphic (Figure 1B). The variation among varieties is very important to set the basis for marker set formulation, thus principal component analyses (PCA) were generated based on physicochemical properties and genotyping data from total molecular markers (Figure 2). PCA showed distinctive relative positions for the varieties for both physicochemical properties and molecular characteristics. Regarding physicochemical properties, PCA revealed that the Sintanur variety had very low AC, PC, SBV, and CTV values, which were much lower than those of most other varieties, but similar to the tidal swamp variety Batanghari, characterized by
separated-Table 3. Values of physicochemical properties of 24 indica rice varieties
Variety AC (%) PC (%) PV (RVU) HPV (RVU) BDV (RVU) CPV (RVU) SBV (RVU) CTV (RVU) Batang Gadis Batang Piaman Cigeulis Fatmawati Konawe Logawa Pepe Tukad Balian
grain texture and low SBV. Some varieties such as Cibodas, Logawa, and Cisokan had physiochemical values that were notably more similar to each other than to other varieties. With regard to PCA values, the two landraces (Rojolele and Kalimutu) with different taste and texture, also were quite distinct in marker characterization each other and from the other improved varieties (Table 1, 3, Figure 2A,B). Marker genotyping was also able to identify the preferred taste varieties characterized by low AC and high PC. These varieties were Memberamo and Cimelati, clearly distinguished from the other varieties based on physicochemical properties (Figure 2B). Thus, these results suggest that there is a preliminary indication of interaction among 30 markers to differentiate rice with different genetic background and physicochemical properties.
Formulation of Molecular Marker Sets. Association analysis between molecular markers and physicochemical properties was performed using the same method previously described to predict eating quality of japonica rice.
In this
analysis,
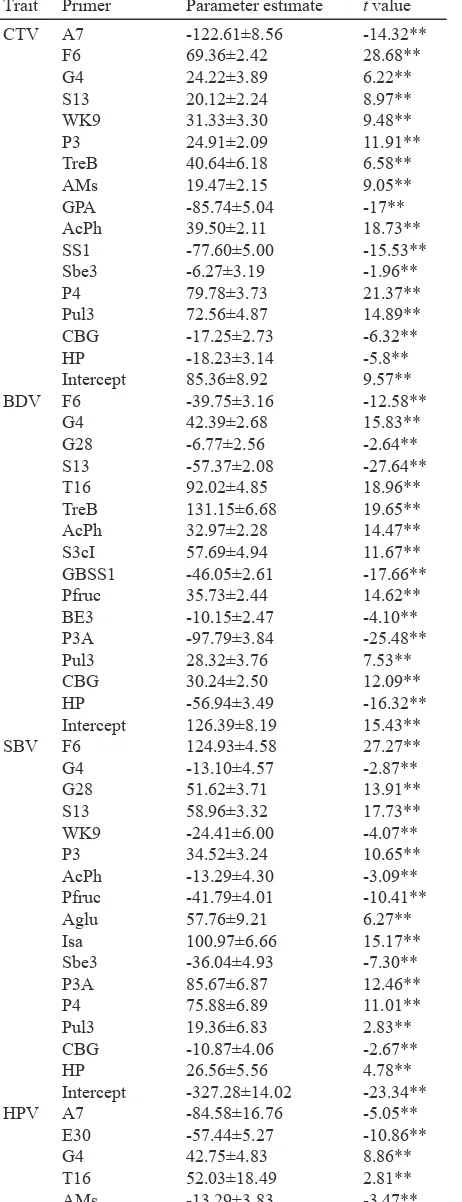
only significant markers were includedin the equations with parameter estimates used
as regression coefficients for each marker (Table
4). The significant markers used as independent
variables were able to generate equations to estimate each rice physicochemical property. The model equations that resulted from multiple regression analysis to predict physicochemical properties A M 1 2 3 4 5 1. Ciliwung, 2. Rojolele, 3. Jatiluhur, 4. Cibodas, 5. Kalimutu); (B) Primer S3cI (1. Ciliwung, 2. Rojolele, 3. Cisokan, 4. Cibodas, 5. Jatiluhur); (C) Primer P3A (lane 1. Ciliwung, 2. Rojolele, 3. Cisokan, 4. Cibodas, 5. Batanghari).
Table 4. The parameter estimates and t value of markers used as
significant coefficient
Table 4. Continued
Trait Primer Parameter estimate t value CTV
Table 4. Continued
Trait Primer Parameter estimate t value HPV
**significant at 1% level.
such as AC, PC, and six RVA pasting properties of
indica rice are shown in Table 5. Highly significant
two markers (PFruc and HP) were shared for most traits but not for CTV. AcPh and CBG dominated most equations for evaluation of physicochemical properties excluding PV and HPV, respectively.
DISCUSSION
High rice quality, attributable to preferred physicochemical properties, is necessary to meet high consumer demand for desired palatability and cooking quality of rice. Evaluation of physicochemical properties has long been conducted on japonica and indica rice by well understood and
commonly used means of measurement. However, conventional methods to determine for PC, AC, and major descriptors of pasting properties are
not efficient. Molecular markers may provide an
alternative approach for predicting rice starch characteristics. At present, several molecular marker sets have been established for prediction of japonica rice palatability (Ohtsubo et al. 2002, 2003; Lestari
et al. 2009).
The wide range of physicochemical properties of 24 indica rice varieties used in this study, along
with different genetic profiles, provides a good
basis for association analysis of physicochemical Figure 2. Principal component analysis (PCA) of 24 Indonesian-bred indica rice varieties based on physicochemical properties (A)
and 30 molecular markers (B).
R1
-1.06 -0.44 0.19 0.81 1.43
R2
-1.90 -1.19 -0.47 0.25 0.97
Rojolele Ciliwung
Cisokan Cibodas Jatiluhur
Kalimutu Cirata
Memberamo
Ciherang
Sintanur Cimelati
Maros Singkil
Batanghari
Conde
Angke BatangGadis BatangPiaman
Cigeulis
Fatmawati
Konawe
Logawa Pepe
TukadBalian
A
C1
-0.24 0.00 0.25 0.49 0.73
C2
-0.55 -0.34 -0.14 0.06 0.26
Rojolele Ciliwung
Cisokan
Cibodas Jatiluhur
Kalimutu
Cirata
Memberamo Ciherang
Sintanur
Cimelati Maros
Singkil Batanghari
Conde
Angke
BatangGadis BatangPiaman Cigeulis
Fatmawati Konawe
Logawa Pepe
TukadBalian
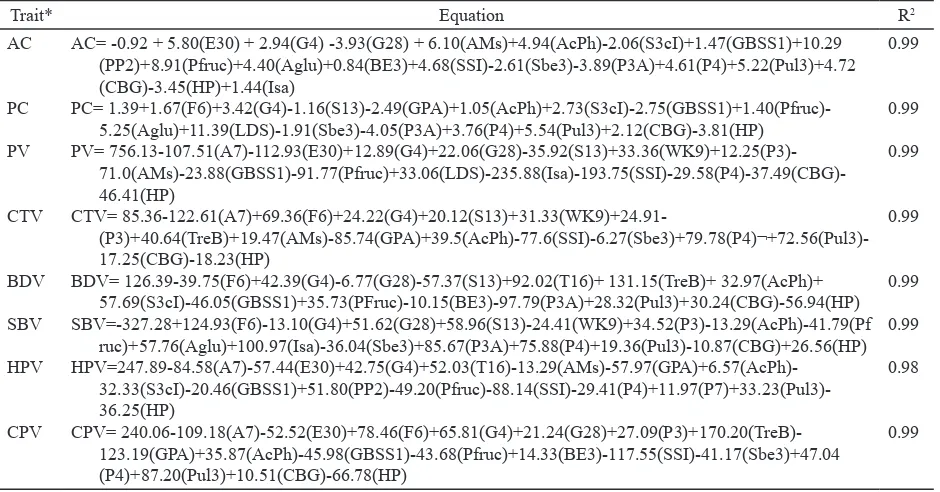
Table 5. Model equations containing significant molecular markers generated by multiple regressions analysis for prediction of
physicochemical properties of Indonesian-bred indica rice
Trait* Equation R2
AC
PC
PV
CTV
BDV
SBV
HPV
CPV
AC= -0.92 + 5.80(E30) + 2.94(G4) -3.93(G28) + 6.10(AMs)+4.94(AcPh)-2.06(S3cI)+1.47(GBSS1)+10.29 (PP2)+8.91(Pfruc)+4.40(Aglu)+0.84(BE3)+4.68(SSI)-2.61(Sbe3)-3.89(P3A)+4.61(P4)+5.22(Pul3)+4.72 (CBG)-3.45(HP)+1.44(Isa)
PC= 1.39+1.67(F6)+3.42(G4)-1.16(S13)-2.49(GPA)+1.05(AcPh)+2.73(S3cI)-2.75(GBSS1)+1.40(Pfruc)-5.25(Aglu)+11.39(LDS)-1.91(Sbe3)-4.05(P3A)+3.76(P4)+5.54(Pul3)+2.12(CBG)-3.81(HP) PV=
756.13-107.51(A7)-112.93(E30)+12.89(G4)+22.06(G28)-35.92(S13)+33.36(WK9)+12.25(P3)- 71.0(AMs)-23.88(GBSS1)-91.77(Pfruc)+33.06(LDS)-235.88(Isa)-193.75(SSI)-29.58(P4)-37.49(CBG)-46.41(HP)
CTV=
85.36-122.61(A7)+69.36(F6)+24.22(G4)+20.12(S13)+31.33(WK9)+24.91- (P3)+40.64(TreB)+19.47(AMs)-85.74(GPA)+39.5(AcPh)-77.6(SSI)-6.27(Sbe3)+79.78(P4)¬+72.56(Pul3)-17.25(CBG)-18.23(HP)
BDV= 126.39-39.75(F6)+42.39(G4)-6.77(G28)-57.37(S13)+92.02(T16)+ 131.15(TreB)+ 32.97(AcPh)+ 57.69(S3cI)-46.05(GBSS1)+35.73(PFruc)-10.15(BE3)-97.79(P3A)+28.32(Pul3)+30.24(CBG)-56.94(HP) SBV=-327.28+124.93(F6)-13.10(G4)+51.62(G28)+58.96(S13)-24.41(WK9)+34.52(P3)-13.29(AcPh)-41.79(Pf
ruc)+57.76(Aglu)+100.97(Isa)-36.04(Sbe3)+85.67(P3A)+75.88(P4)+19.36(Pul3)-10.87(CBG)+26.56(HP)
HPV=247.89-84.58(A7)-57.44(E30)+42.75(G4)+52.03(T16)-13.29(AMs)-57.97(GPA)+6.57(AcPh)- 32.33(S3cI)-20.46(GBSS1)+51.80(PP2)-49.20(Pfruc)-88.14(SSI)-29.41(P4)+11.97(P7)+33.23(Pul3)-36.25(HP)
CPV= 240.06-109.18(A7)-52.52(E30)+78.46(F6)+65.81(G4)+21.24(G28)+27.09(P3)+170.20(TreB)-123.19(GPA)+35.87(AcPh)-45.98(GBSS1)-43.68(Pfruc)+14.33(BE3)-117.55(SSI)-41.17(Sbe3)+47.04 (P4)+87.20(Pul3)+10.51(CBG)-66.78(HP)
0.99
0.99
0.99
0.99
0.99
0.99
0.98
0.99
*AC: amylose content, PC: protein content, PV: peak viscosity, CTV: consistency viscosity, BDV: breakdown viscosity, SBV: setback viscosity, HPV: hot peak viscosity, CPV: cook peak viscosity.
properties with molecular data. The varieties used were diverse with regard to historical indica type (cereh and hairy grain surface), days to maturity, and suitability for cultivation in different habitats: either upland, lowland, or tidal swamp. Most of varieties had medium AC and PC, typical indica (cereh), and high yield potency (Table 1 & 3). The number of varieties analyzed genetically in this study is similar to the number used for indica rice taste estimation of 22 varieties which proved to be enough to establish marker sets (Lestari et al. 2009). AC, PC and pasting properties are usually measured for routine analyses when screening germplasm, as part of the selection process in rice breeding. All physicochemical properties of starch differ by plant variety, each of which possesses a
different genetic profile as well. AC and PC values
seemed to relate to different patterns of rice grain quality. Most of the RVA pasting properties have been attributed to palatability, whereas AC levels tended to affect cooking quality (Allahgholipour
et al. 2006; Lestari et al. 2009; Sun et al. 2011). In indica rice germplasm for large-grain varieties, pasting properties have been shown to relate to more or less gelatinous consistency (Allahgholipour et al. 2006; Lin et al. 2010). Differences in magnitude of the values for pasting properties provide additional characters for differentiating rice grain (Gravois & Webb 1997). Overall, AC and pasting properties are good indicators to measure rice cooking quality.
Thus, the selection of plant materials with diverse physicochemical properties was valuable in order to formulate market sets in regression analysis.
The high fidelity of molecular markers in
contrast to nucleotide variation on the genome is useful for various genetic studies, and in particular for differentiating varieties in our research. Several molecular markers associated with physicochemical properties and overall rice eating and cooking qualities have been developed. These markers were derived from several genes that are associated with physicochemical properties of rice such as starch synthesizing genes (He et al. 2006; Bao et al. 2006a,b) and rice palatability (Ohtsubo
et al. 2002, 2003). The markers used in our study were developed on the basis of genes linked to physicochemical properties-QTL, genes involved in starch synthesis in the rice pathway, and markers associated with rice physicochemical properties. Therefore, these markers are likely to hold potential for the development of PCR-based methods of prediction not only of rice palatability but also of
the specific physicochemical properties of both
indica and japonica rice.
A total of eight parameters, namely PC, AC, and six RVA pasting viscosities (PV, CPV, BDV, HPV, CTV, and SBV) were used for PCA of 24 indica varieties, and compared with molecular markers
identified using PCA. This useful tool allowed for
well as possible group affinities, and relationships
among individuals (Li et al. 2011). The dot plots for PCA based on marker data and physicochemical trait data were distinguishable. The plot of DNA marker data tended to pool of most varieties on the basis of shared genetic background and characteristics, whereas the plot of physicochemical properties revealed more dispersed varieties. Markers were able to separate clearly two landraces (Rojolele and Kalimutu) and two improved varieties with preferred taste characteristics, from other improved
varieties that could not be otherwise identified by
physicochemical properties. This PCA indicates that DNA markers could be a valuable tool to complement differentiation of varieties based on physicochemical characters. A previous study evaluating japonica rice eating quality showed that examining the genetic relationship among varieties based only on data from a single marker may not be effective (Lestari et al. 2009), therefore, a set of multiple markers is needed for rice varieties differentiation.
A combination of markers is better than individual markers to estimate rice eating quality. Multiple regression analyses for association of a number of traits and molecular data have been performed (Tuyen & Prasad 2008; Fahliani et al. 2011) and have proved to be rapid and effective for predicting rice eating qualities using formulated markers (Ohtsubo
et al. 2003; Lestari et al. 2009; Sun et al. 2011). The same approach may be applicable for evaluation of indica rice physicochemical properties.
The model equations formulated in this study included most of our previously developed markers based on eating quality-QTL and selected candidate genes in rice pathway. Our equations had high
regression coefficients ranging from 0.98 to 0.99
(Table 5). The regression equations contained
15 to 19 significant markers, a feasible number for PCR amplification. These markers sets are
comparable with marker sets containing 13 and 14 markers in the sets for estimation of japonica rice eating quality based on the Toyo taste meter, and sensory test, respectively (Lestari et al. 2009). In particular, the marker set based on Toyo taste meter after validation, can be used as a tool in the service of sample analysis for evaluation of Korean rice germplasm and populations. Clearly, even though these markers were developed from both japonica and indica rice genomes (Ohtsubo et al. 2002, 2003; Ohtsubo & Nakamura 2007; Lestari et al. 2009) they worked well on indica varieties.
A number of markers such as PFruc, HP, AcPh and CBG, were shared among equations. Some CAPS/dCAPS markers transformed into dominant SNAP markers (Lestari & Koh 2013) and included in the marker sets clearly may increase the reliability of the formulated marker sets. Since these regression equation results were part of a preliminary analysis, these marker sets may possibly be reformulated using a larger number of rice accessions. Further
studies are also needed to confirm our findings
and validate the formulated marker sets in the equations using more diverse indica rice varieties and breeding lines. PCR analysis requires much less sample material for testing, and allows the use of leaves rather than rice grains as a source of genomic DNA. This means testing can be conducted in early generations of population-crossing, which makes this tool even more promising. Ultimately, the marker sets in our study could be useful for assisting in the selection process to enhance breeding for indica rice varieties with improved eating and cooking qualities in Indonesia in the future.
ACKNOWLEDGEMENT
This work was supported by a grant (No. 609001-5) from the Agricultural Research and Development Promotion Center for Agriculture and Forestry, Ministry of Agriculture and Forestry, Republic of Korea.
REFERENCES
Allahgholipour M, Ali AJ, Alinia F, Nagamine T, Kojima Y. 2006. Relationship between rice grain amylose and pasting properties for breeding better quality rice varieties. Plant Breed 125:357-262. http://dx.doi.org/10.1111/j.1439-0523.2006.01252.x
Allidawati, Bambang K. 1989. Metode uji mutu beras dalam program pemuliaan padi. Dalam: Ismunadji M, Syam M, Yuswadi (Eds). Padi Buku 2. Pusat Penelitian dan Pengembangan Tanaman Pangan, Bogor. p 363-375.
[AOAC] Association of Official Analytical Chemists. 1995. AOAC Official Methods of Analysis. 16th ed.; AOAC:
Gaithersburg, MD. p 30.
Bao JS, Corke H, Sun M. 2006a. Microsatellites, single nucleotide polymorphisms and a sequence tagged site in starch-synthesizing genes in relation to starch physicochemical properties in non-waxy rice (Oryza sativa L.). Theor Appl Genet 113:1185-1196. http://dx.doi. org/10.1007/s00122-006-0394-z
Bao JS, Jin L, Xiao P, Shen S, Sun M, Corke H. 2008. Starch
physicochemical properties and their associations with microsatellite alleles of starch-synthesizing genes in a rice RIL population. J Agric Food Chem 56:1589-1594. http:// dx.doi.org/10.1021/jf073128+
Bao JS, Xia YW. 1999. Genetic control of the paste viscosity
characteristics in indica rice (Oryza sativa L.). Theor Appl Genet 98:1120-1124. http://dx.doi.org/10.1007/s001220051175 Fahliani RA, Khodambashi M, Houshmand S, Arzani A,
Sorkheh K. 2011. Heritability for some agronomic characters of rice (Oryza sativa L.) and their linked
microsatellites identification. Turk J Agric For 35:481-490. Gravois KA, Webb BD. 1997. Inheritance of long grain rice
amylograph viscosity characteristics. Euphytica 97:25-29. http://dx.doi.org/10.1023/A:1003082930147
He Y, Han YP, Jiang L, Xu CW, Lu JF, Xu ML. 2006. Functional
analysis of starch-synthesis genes in determining rice eating and cooking qualities. Molecular Breeding 18:277-290. http://dx.doi.org/10.1007/s11032-006-5505-7
Izawa T. 2008. The process of rice domestication: a new model based on recent data. Rice 1:127-134. http://dx.doi. org/10.1007/s12284-008-9014-7
Kuo BJ, Hong MC, Thseng FS. 2001. The relationship between the amylographic characteristics and eating quality of japonica rice in Taiwan. Plant Prof Sci 4:112-117. http:// dx.doi.org/10.1626/pps.4.112
Lestari P, Ham TH, Lee HH, Woo MO, Jiang WJ, Chu SH, Kwon SK, Ma KH, Lee JH, Cho YC, Koh HJ. 2009. PCR marker-based evaluation of eating quality of cooked rice (Oryza sativa L.). J Agric Food Chem 57:2754-2762. http:// dx.doi.org/10.1021/jf803804k
Lestari P, Koh HJ. 2013. Development of new CAPS/dCAPS and SNAP markers for rice eating quality. Hayati J Biosci 20:15-23. http://dx.doi.org/10.4308/hjb.20.1.15
Li Z, Wan J, Xia J, Yano M. 2003. Mapping of quantitative
trait loci controlling physicochemical properties of rice grains. Breeding Sciences 53:209. http://dx.doi.org/10.1270/ jsbbs.53.209
Li ZM, Zheng XM, Ge S. 2011. Genetic diversity and
domestication history of African rice (Oryza glaberrima) as inferred from multiple gene sequences. Theor Appl Genet 123:21-31. http://dx.doi.org/10.1007/s00122-011-1563-2
Lin Q, Liu ZH, Xiao H, Li L, Yu FX, Tian W. 2010. Studies
on the pasting and rheology of rice starch with different protein residual. IFIP AICT 317:407-419.
Mohapatra D, Bal S. 2011. Physical properties of indica rice in relation to some mechanical properties indicating grain characteristics. Food and Bioprocess Technol http://dx.doi. org/10.1007/s11947-011-0539-1215.
Murray MG, Thompson WF. 1980. Rapid isolation of high molecular weight DNA. Nucleic Acids Res 8:4321-4325. http://dx.doi.org/10.1093/nar/8.19.4321
Ohtsubo K, Nakamura S. 2007. Variety identification of rice
(Oryza sativa L.) by Polymerase Chain Reaction method and its application to processed rice products. J Agric Food Chem 55:1501-1509. http://dx.doi.org/10.1021/jf062737z Ohstubo K, Nakamura S, Imamura T. 2002. Development of the
primer sets for identification of a rice variety, Koshihikari,
by PCR. Nippon Nogeikagaku Kaishi 76:388-397. http:// dx.doi.org/10.1271/nogeikagaku1924.76.388
Ohstubo K, Nakamura S, Okadome H. 2003. Investigation on estimation of rice palatability by DNA analysis (studies on estimation of rice palatability by DNA analysis part I). Nippon Nogeikagaku Kaishi 50:122-132.
Patindol J, Guraya H, Champagne E, Chen MH, McClung A. 2010. Relationship of cooked-rice nutritionally important starch fractions with other physicochemical properties. Starch/Starke 62:246-256. http://dx.doi.org/10.1002/ star.200900260
Perez CM, Juliano BO. 1978. Modification of the simplified
amylose test for milled rice. Starch/Staerke 30:424-426. http://dx.doi.org/10.1002/star.19780301206
Pooni HS, Kumar I, Khush GS. 1993. Genetical control of amylose content in selected crosses of indica rice. Heredity 70:269-280. http://dx.doi.org/10.1038/hdy.1993.39 Ramesh M, Ali SZ, Bhattacharya KR. 1999. Structure
of rice starch and its relation to cooked-rice texture. Carbohydr Polym 38:337-347. http://dx.doi.org/10.1016/S0144-8617(98)00125-8
Rohlf FJ. 1993. NTSYS-PC Numerical Taxonomy and Multi Variate Analysis System, version 1.8; Exeter Publishers: Setauket, NY.
[SAS] Statistical Analysis Systems. 2002. SAS User’s Guide, release 8.2; Statistical Analysis Systems Institute: Cary, NC.
Sun MM, Abdula SE, Lee HJ, Cho YC, Han LZ, Koh HJ, Cho YG. 2011. Molecular aspect of good eating quality formation in japonica rice. PloS One 6, e18385. http:// dx.doi.org/10.1371/journal.pone.0018385
Syamsir E, Hariyadi P, Fardiaz D, Andarwulan N, Kusnandar F. 2012. Pengaruh proses heat-moisture treatment (HMT)
terhadap karakteristik fisikokimia pati. J Teknol Industri Pangan XXIII:100-106.
Tian R, Jiang GH, Shen LH, Wang LQ, He YQ. 2005. Mapping quantitative trait loci underlying the cooking and eating quality of rice using a DH population. Molecular Breeding 15:117-124. http://dx.doi.org/10.1007/s11032-004-3270-z Tuyen DD, Prasad DT. 2008. Evaluating difference of yield trait
among rice genotypes (Oryza sativa L.) under low moisture condition using candidate gene markers. Omonrice 16:23-33.