Building iPhone and iPad Electronic Projects by Mike Westerfield
Copyright © 2013 James M. Westerfield. All rights reserved.
Printed in the United States of America.
Published by O’Reilly Media, Inc., 1005 Gravenstein Highway North, Sebastopol, CA 95472.
O’Reilly books may be purchased for educational, business, or sales promotional use. Online editions are also available for most titles (http://my.safaribooksonline.com). For more information, contact our corporate/ institutional sales department: 800-998-9938 or [email protected].
Editor: Courtney Nash
Production Editor: Melanie Yarbrough Copyeditor: Rachel Head
Proofreader: Linley Dolby
Indexer: WordCo Indexing Services Cover Designer: Randy Comer Interior Designer: David Futato Illustrator: Rebecca Demarest
September 2013: First Edition
Revision History for the First Edition: 2013-09-10: First release
See http://oreilly.com/catalog/errata.csp?isbn=9781449363505 for release details.
Nutshell Handbook, the Nutshell Handbook logo, and the O’Reilly logo are registered trademarks of O’Reilly Media, Inc. Building iPhone and iPad Electronic Projects, the cover image of a magpie, and related trade dress are trademarks of O’Reilly Media, Inc.
Many of the designations used by manufacturers and sellers to distinguish their products are claimed as trademarks. Where those designations appear in this book, and O’Reilly Media, Inc., was aware of a trade‐ mark claim, the designations have been printed in caps or initial caps.
While every precaution has been taken in the preparation of this book, the publisher and authors assume no responsibility for errors or omissions, or for damages resulting from the use of the information contained herein.
ISBN: 978-1-449-36350-5
Table of Contents
Preface. . . vii
1. Getting Familiar with techBASIC and Built-in Sensors. . . 1
Your Own Tricorder 1
A Crash Course in techBASIC 2
techBASIC Sampler 2
Running Your First Program 3
Creating a Program 5
The Accelerometer 8
2. Accessing the Other Built-in Sensors. . . 21
The Gyroscope 22
Radians or Degrees? 30
The Magnetometer 30
Faster Sensor Response 38
Heading 42
Location 43
Your Own Tricorder 44
3. Creating a Metal Detector. . . 45
The iPhone/iPad Magnetometer 45
The Earth’s Magnetic Field 46
Using the iPhone or iPad as a Metal Detector 48
Converting the Magnetometer Sample into a Metal Detector 50
Using the Metal Detector 52
Finding Out More 54
4. HiJack. . . 55
What Is HiJack? 55
Building the Sensor 57
External Power for HiJack 61
Hello HiJack 63
When Things Go Wrong 65
A Better HiJack Program 65
For More Information 71
5. Creating a Moisture Meter with HiJack. . . 73
Adding a Moisture Meter to the Tricorder 73
Assembling the Moisture Meter 74
Calibration 75
Collecting the Calibration Data 76
Moving Datafiles to and from techBASIC 77
Using the Calibration Data 78
Better Software 81
The Complete Moisture Meter Source 89
6. Bluetooth Low Energy. . . 93
What Is Bluetooth Low Energy? 93
The TI SensorTag 95
Writing Bluetooth Low Energy Programs 97
The Accelerometer 112
What’s an Accelerometer? 112
Accessing the Accelerometer 113
Using the Accelerometer 115
The Source 117
The Barometer 121
Accessing the Barometer 121
The Source 126
The Gyroscope 130
Accessing the Gyroscope 130
Using the Gyroscope 133
The Source 133
The Magnetometer 137
Accessing the Magnetometer 138
Using the Magnetometer 140
The Source 141
The Humidity Sensor (Hygrometer) 145
Accessing the Hygrometer 145
The Source 147
The Thermometer 151
Accessing the Thermometer 151
Using the Thermometer 154
The Source 154
Further Explorations 158
7. Bluetooth Low Energy iPhone Rocket. . . 159
A Bit of Rocket Science 159
Parts Lists 161
ST-1 161
ST-2 162
Other Items for Both Rockets 163
Why Use a SensorTag? 164
Construction 164
ST-2: The iPhone/SensorTag Rocket 164
ST-1: The SensorTag Rocket 171
The Data Collection Program 174
SensorTag 8G Software 185
Flight Tips 187
Engines 187
Parachutes 188
Flight Conditions 188
Power Up! 188
The Data 189
Analyzing the Data 189
Rocket Data Analysis 191
Velocity and Altitude 192
Rotation and Pressure 194
What We Found 195
ST-1 Results 195
ST-2 Results 196
8. Hacking a Radio-Controlled Truck with Bluetooth Low Energy and Arduino. . . 197
Controlling a Truck with BLE 198
Selecting a Truck 200
Disassembly 200
Hacking the Truck 205
The H Bridge 205
The TI Chip 207
Wiring the Complete Circuit 209
Controlling the Arduino Uno 217
Installing Arduino 217
Downloading Firmata 219
The Software 223
Pulse Width Modulation 223
Back to the Software 225
Start Your Engines! 237
9. Peer-to-Peer Bluetooth Low Energy. . . 239
Bluetooth Low Energy Slave Mode 239
BLE Chat 240
Setting Up the Services 240
Using the Services 242
10. Paddles: A Bluetooth Pong Tribute. . . 253
The Classic Game of Pong 253
The Paddles Game 254
The Paddle Software 256
The Paddles Console Software 260
11. WiFi. . . 273
Worldwide Sensors 273
HTTP, FTP, and TCP/IP 274
WiFly 275
The Circuit 276
Establishing a Network Connection 277
Communication with TCP/IP 279
A Simple Terminal Program 279
WiFi Arduino 281
Loading Software onto the Arduino 281
The Circuit 283
Communication Using the Terminal Program 285
12. WiFi Servos. . . 287
Servos: They’re Where the Action Is 287
The Pololu Serial Servo Controller 289
The Circuit 292
Halloween Hijinks 293
The Software 293
Take It for a Spin 298
Push and Pull with Servos 298
Pomp and Circumstance 301
Index. . . 303
Preface
You carry an amazing scientific instrument around in your pocket every day, using it for mundane tasks like making phone calls or listening to music. Your iPad 2 is as fast as a Cray-2 supercomputer from just a few decades ago, yet most people only use it to read books or surf the Web. What a waste.
This book is all about connecting your iPhone, iPod Touch, or iPad to the real world. You’ll start by learning how to access the sensors built right into your device. Next you’ll see how to connect wired sensors through the headphone port using a wonderful little device called HiJack. Several chapters show various ways to use Bluetooth low energy to connect to sensors, Arduino microcontrollers, motor controllers, and even other iPhones or iPads. Finally, you’ll see exactly how to use WiFi to connect to the Internet or physical devices connected to WiFi devices.
It would be pretty boring to make all of these connections just to make a few LEDs light up, so the book is organized around fun, interesting projects. The built-in sensors are used to create a metal detector. HiJack is hooked up to a simple electrical device so it can be used as a plant moisture sensor. Bluetooth low energy connects to a Texas In‐ struments SensorTag to detect acceleration to track the flight of a model rocket, and later to an Arduino microcontroller to hack a radio-controlled car, showing how to create robots and control them with your iPhone. Bluetooth low energy can also be used for peer-to-peer communication between iOS devices. You will learn how this is done by creating an arcade game that uses iPhones for game paddles. WiFi will be hooked up to a serial bridge to control servos, ultimately hacking a candy dispenser to give you candy under iPhone control.
Our look at each topic starts with a chapter that introduces the basic concepts using a simple project. One or more chapters follow these introductions, presenting the fun projects just mentioned. You may not want to build every one of them yourself, but reading through how they are created and how they work, you will get ideas about how to build your own projects.
You don’t need to go through this book linearly. If a project in the middle of the book seems really interesting, jump right to it. Each chapter starts with a section called “About This Chapter.” It lists the prerequisites, telling you which other chapters contain infor‐ mation you might need before attempting the project in the chapter you are interested in.
All of the hardware in the book is developed with electronic components you can buy from many Internet stores, but some of it is hard to find locally. Plan ahead. Glance at the parts list in a chapter a week or two before you want to get started, and order the parts you need.
Finally, the projects in this book cover several disciplines. There’s a lot of software, quite a bit of electronics, and a fair amount of mechanical engineering involved. Some of the stuff in this book is going to seem beyond your abilities. I know a few of the projects seemed that way to me as I wrote the book. After all, even though most of us have some technical ability, either through education or experience with hobbies, almost no one is fully qualified at computer science, electrical engineering, mechanical engineering, and physics.
Be brave, grasshopper.
Everything is laid out very carefully. If you don’t know much about software, start with the completely developed programs in the book, all of which are built right into tech‐ BASIC. If you don’t know one end of a battery from another, just wire stuff as you see it in the diagrams and photos that carefully document each circuit. As you learn more, you can experiment. Sure, there will be some failures along the way. I burned out a circuit or two and crashed a lot of software writing the book, and you’ll do the same as you read it. That’s how we learn.
I hope you don’t just build the projects in this book, though. The whole point is to learn how to do things, not just follow some plans. Whether you’re a professional trying to figure out how to remotely access data from a buried seismograph, a student exploring robotics for a science fair project, or an inventor tinkering with awesome ideas in your garage, I hope this book gives you some techniques and ideas that will enable you to create amazing things by combining software, electronics, and mechanics to build de‐ vices.
So, let’s go forth and control our world!
Conventions Used in This Book
The following typographical conventions are used in this book:
Italic
Indicates new terms, URLs, email addresses, filenames, and file extensions.
Constant width
Used for program listings, as well as within paragraphs to refer to program elements such as variable or function names, databases, data types, environment variables, statements, and keywords.
Constant width bold
Shows commands or other text that should be typed literally by the user.
Constant width italic
Shows text that should be replaced with user-supplied values or by values deter‐ mined by context.
This icon signifies a tip, suggestion, or general note.
This icon indicates a warning or caution.
Using Code Examples
This book is here to help you get your job done. Where this book includes code examples, you may use the code in this book in your programs and documentation. You do not need to contact us for permission unless you’re reproducing a significant portion of the code. For example, writing a program that uses several chunks of code from this book does not require permission. Selling or distributing a CD-ROM of examples from O’Reilly books does require permission. Answering a question by citing this book and quoting example code does not require permission. Incorporating a significant amount of example code from this book into your product’s documentation does require per‐ mission.
We appreciate, but do not require, attribution. An attribution usually includes the title, author, publisher, and ISBN. For example: “Building iPhone and iPad Electronic Projects by Mike Westerfield (O’Reilly). Copyright 2013 James M. Westerfield, 978-1-449-36350-5.”
If you feel your use of code examples falls outside fair use or the permission given above, feel free to contact us at [email protected].
Safari® Books Online
Safari Books Online is an on-demand digital library that delivers expert content in both book and video form from the world’s lead‐ ing authors in technology and business.
Technology professionals, software developers, web designers, and business and crea‐ tive professionals use Safari Books Online as their primary resource for research, prob‐ lem solving, learning, and certification training.
Safari Books Online offers a range of product mixes and pricing programs for organi‐ zations, government agencies, and individuals. Subscribers have access to thousands of books, training videos, and prepublication manuscripts in one fully searchable database from publishers like O’Reilly Media, Prentice Hall Professional, Addison-Wesley Pro‐ fessional, Microsoft Press, Sams, Que, Peachpit Press, Focal Press, Cisco Press, John Wiley & Sons, Syngress, Morgan Kaufmann, IBM Redbooks, Packt, Adobe Press, FT Press, Apress, Manning, New Riders, McGraw-Hill, Jones & Bartlett, Course Technol‐ ogy, and dozens more. For more information about Safari Books Online, please visit us online.
How to Contact Us
Please address comments and questions concerning this book to the publisher:
O’Reilly Media, Inc.
1005 Gravenstein Highway North Sebastopol, CA 95472
800-998-9938 (in the United States or Canada) 707-829-0515 (international or local)
707-829-0104 (fax)
We have a web page for this book, where we list errata, examples, and any additional information. You can access this page at http://www.oreil.ly/building-iphone-ipad. To comment or ask technical questions about this book, send email to bookques [email protected].
For more information about our books, courses, conferences, and news, see our website at http://www.oreilly.com.
Find us on Facebook: http://facebook.com/oreilly
Follow us on Twitter: http://twitter.com/oreillymedia
Watch us on YouTube: http://www.youtube.com/oreillymedia
Acknowledgments
When I was a young nerd toting my slide rule back and forth to the library, one of my favorite books was The Amateur Scientist, a collection of articles from Scientific Amer‐ ican. It was a remarkably diverse collection of projects. I added a significant amount of wear to that book, and eventually bought and wore out my own copy.
I hope this book is a lot like that one—it’s a book of projects, some of which you’re unlikely to take the time to build yourself. I hope you wear it out thumbing through the pages. As you do, though, keep in mind that it’s not the work of a single person. Oh, sure, I wrote it, but as Newton famously remarked, “If I have seen further it is by standing on the shoulders of giants.”
I owe a great deal to the people who educated me, both in and out of the classroom. A lot of them were in the early Apple II community. I won’t even try to name them, but you can find their footprints all through this book. Check out the KansasFest archives to meet some of these astoundingly creative people.
My wife is an amazing person. She’s my cheerleader, my critic, and the first person to read and correct each page. She watched our house as it was taken over by rockets, robot cars, and remote-controlled gadgets, encouraging me without complaining about the mess. She even pitched in on many of the projects. Among other things, the eyeball in Chapter 11 is her artwork. What an amazing best friend.
Thomas Schmid from the University of Utah took the time to answer a lot of questions about the HiJack, no doubt keeping me from frying a few. Like a lot of components, HiJack is manufactured by Seeed Studio. Leslie Liao from Seeed Studio kindly supplied the book’s reviewers with HiJacks so they could try the projects in Chapter 4 and Chap‐ ter 5.
I have some great new Internet friends at the Texas Instruments facility in Norway. Jarle Bøe was fantastic, getting me started with the SensorTag before it even came out. He also let me use some of his photos, which are credited in the text. His staff was more than just helpful—Jomar Hoensi even wrote a special version of the firmware so it could collect data up to ±8G for rocket flights, and took the time to answer a lot of neophyte questions as I came up to speed on Bluetooth low energy. The rockets you see in Chap‐ ter 7 exist because of their efforts. I’m happy to say the rockets got to go to Norway for some trade shows, even if I never made it there myself.
My reviewers patiently slogged through all or part of this book. The amazing and tal‐ ented Ryan family made up most of the reviewers. Kevin Ryan, Jess Finley, and Ken Moreland spent countless hours making sure everything worked and the descriptions were clear enough to follow. They even had electronics parties where they got together to build the projects. Doyle Maleche joined, from afar, bringing his experience as an educator to bear on the book. I even got to get acquainted with a great O’Reilly author,
Alasdair Allan, who took the time to review parts of the book. Their comments made this a much better book than it would otherwise have been.
I’ve done a lot of writing for magazines over the years, and published software with a number of companies. While this is my first traditional book, I’ve worked with pub‐ lishers and editors for a long time. I was pretty lucky to get some early training and encouragement from the editors and writers at Call A.P.P.L.E. I had pretty much given up on finding a publisher that really cared that much about its authors and products, but O’Reilly sure seems to be another one. I’ve been fortunate to have two great editors on this book. Brian Jepson got me started, then handed me off to Courtney Nash when Make: split from O’Reilly. Finding two people of their quality in a row says a lot for this company. If you decide to write, be sure to drop them a line. They are good people.
So, to all of you, from the Apple II buds in my early years to my newest friends at O’Reilly, thanks for making me look good!
Credits
While modified for the book, Chapter 5 originally appeared in the June 2012 issue of Nuts & Volts Magazine and is reprinted by permission of T & L Publications, Inc.
The SensorTag photo from Chapter 6 is courtesy of Jarle Bøe at Texas Instruments.
The illustration of the declination of the Earth’s magnetic field in Chapter 3 is courtesy of Wikimedia Commons.
CHAPTER 1
Getting Familiar with techBASIC
and Built-in Sensors
About This Chapter
Prerequisites
You should already be familiar with using your iPhone. You should have some idea what programming is all about, although you do not need to be an ace programmer. It helps to know some variant of BASIC, but this is not required.
Equipment
You will need an iPhone, iPod Touch, or iPad running iOS 5 or later.
Software
You will need a copy of techBASIC or techBASIC Sampler.
What You Will Learn
This chapter starts with an introduction to techBASIC, the technical programming language used in this book for accessing sensors. It shows how to access the accel‐ erometer that is built into every iOS device, starting with a simple one-line program and working up to a sophisticated accelerometer app.
Your Own Tricorder
I was always a little jealous when Spock pulled out his tricorder on Star Trek and began measuring practically every physical value you could imagine. It’s staggering how far technology has come, though. I carry a tricorder around in my pocket all the time now! Mine measures acceleration, rotation, and magnetic fields, giving both the strength and direction of each. It’s not quite as sophisticated as Spock’s, but it’s also not so large and clunky.
This book is all about using your iPhone and iPad to control electronic devices, often sensors. We’re going to start off with the sensors that are built right in, so you can pop out your tricorder and measure stuff, too.
The iPod Touch
The iPod Touch is essentially an iPhone without the phone, or, depending on your viewpoint, an iPad with a pocket-sized screen. Nothing in this book uses the phone part of the iPhone, so any time you see the iPhone mentioned, you can also use an iPod Touch. For the most part, we won’t talk about the iPod Touch specifically, but keep in mind that you can always use one instead of an iPhone.
A Crash Course in techBASIC
We’ll get started on the first instrument for our tricorder in a moment. First, though, let’s take a look at the language we’ll use for programming.
Our programs will be developed in a technical programming language called techBA‐ SIC, available in the App Store. There are a number of reasons for using techBASIC instead of Objective C, the programming language used to write most apps (including techBASIC). Here are some of the big ones:
• techBASIC runs right on your iPhone or iPad. You don’t have to use, or even own, a Macintosh computer to write or run these programs.
• techBASIC is less expensive. While Xcode (the development environment for Ob‐ jective C) is free, you must join Apple’s developer program to actually move pro‐ grams to your iOS device. That costs $99 every year. techBASIC costs $14.99 one time.
• techBASIC is simpler. It’s designed specifically for writing technical programs and connecting to external devices. Programs that would take a half-dozen to a dozen classes, each with a half-dozen to a dozen methods, can often be written with just a few lines in techBASIC.
• techBASIC is easier to learn and more forgiving than Objective C, so you can con‐ centrate on the fun part—writing the programs to control the Internet of Things.
techBASIC Sampler
There is a free version of techBASIC called techBASIC Sampler. It’s also displayed in some places with the shortened name techSampler. The free version lets you view and run all of the samples that come with techBASIC. All of the programs from this book
are samples in techBASIC, so you can use the free version to run the programs. You can even use the debugger to trace through the programs. The only limitation is editing. techBASIC Sampler doesn’t let you change a program or create a new one. When you try to edit a program or create a new one, techBASIC Sampler will invite you to upgrade to the full version of techBASIC using an in-app purchase. You can do that or just buy techBASIC.
That said, there are a couple of places in the book where we will create very short programs that are not preloaded as samples. These are typically used to show a simple feature before it gets buried in a longer program or to show how to use techBASIC. You can skip entering those programs without missing anything significant.
We’ll just talk about techBASIC in the book, but other than editing, you can always perform the same tasks with techBASIC Sampler.
Where to Get techBASIC
Like all iOS apps, techBASIC and techBASIC Sampler are available from Apple’s App Store.
• techBASIC is the full version of the development environment. It includes the sam‐ ples from this book.
• techBASIC Sampler (also called techSampler, so the name will show up under the icon on the iPhone and iPad) is the free version of techBASIC. It allows you to run programs, including the samples from this book, but you cannot edit existing pro‐ grams or create new ones. There is an in-app purchase to enable editing, which makes this program feature-for-feature compatible with techBASIC.
You can find more information about both programs, as well as a technical reference manual, at the Byte Works website.
Running Your First Program
Crank up techBASIC and you will see a display something like Figure 1-1, depending on the device you are using. If you are using an iPad and holding it in portrait view, tap the Programs button at the top left of the screen to see the list of programs. The iPhone will start off showing the programs, but if you switch to another display, you can switch back by tapping the Programs button at the lower left of the iPhone display.
Figure 1-1. Initial techBASIC display
The program list shows all of the sample programs, contained in folders used to organize them. One of the folders is called O’Reilly Books, as shown in Figure 1-2. Tap the name and it will expand to show the programs in the folder. Tap the Programs navigation button at the top of the screen and the folder closes, moving you back to the original list of folders.
Figure 1-2. The O’Reilly Books folder
One of the programs is called Accelerometer. Tap the Edit button next to the program’s name to see the source code for the program. On the iPhone, you can tap the Programs button to get back to the program list.
You run a program by tapping on the name of the program, as shown later in Figure 1-7. Give the accelerometer a try. The display will shift to the graphics screen, where you’ll see a constantly updating plot of the acceleration experienced by the iPhone or iPad, as shown in FIG 1-4. The accelerometer is the first sensor for our tricorder, and we’ll dig into the program in detail in a moment. Stop the program by tapping the Quit button.
Figure 1-3. Running and editing programs
Creating a Program
Our first techBASIC program will turn on the accelerometer built into the iPhone or iPad; read the acceleration along the vertical axis, the horizontal axis, and through the screen of the device; record the time when the measurement was made; and print these values. It will then turn off the accelerometer to preserve battery life.
It sounds like a pretty sophisticated program, and it is. Here’s the source code:
PRINT Sensors.accel
Let’s see how it works. Sensors is the name of a class that is built into techBASIC. It’s the class used to access all of the sensors that are built into the iPhone and iPad. One of the methods in the Sensors class is accel. It returns an array of four values: the current acceleration along the x-axis (vertically through the device), the y-axis (horizontally through the device), and the z-axis (perpendicular to the screen), and a timestamp indicating exactly when the reading was made.
PRINT is a statement in BASIC that prints any value, from numbers to strings to arrays. In this case, it prints all four values from the array returned by Sensors.accel.
Case Sensitivity
BASIC is not a case-sensitive language. The program shown will work just as well if you type:
print sensors.accel
The programs in this book follow a convention of showing all of the reserved words from the BASIC language in uppercase letters and capitalizing all class names. This is just a convention to make the programs easier for you to read. Use it or ignore it as you please.
It’s time to enter the program and run it. If you are still in the O’Reilly Books folder, back up to the top folder level by tapping the Programs navigation button just above the list of programs.
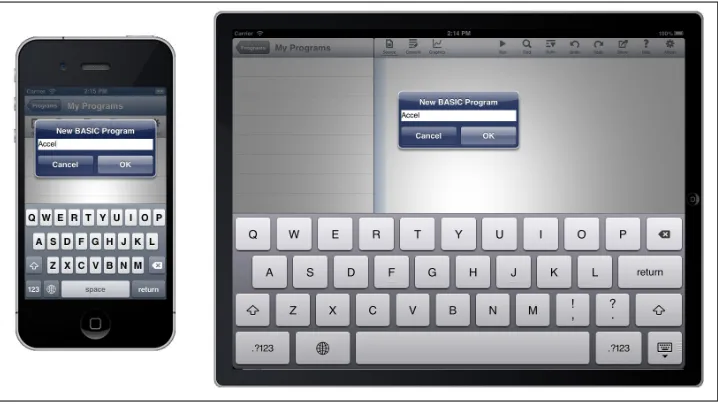
From the program list, tap the My Programs folder. Tapping the name of a folder not only opens the folder, it also indicates which folder the program you’re about to create will be placed in. Now tap the New button. You will see a dialog like Figure 1-4.
Figure 1-4. The New dialog
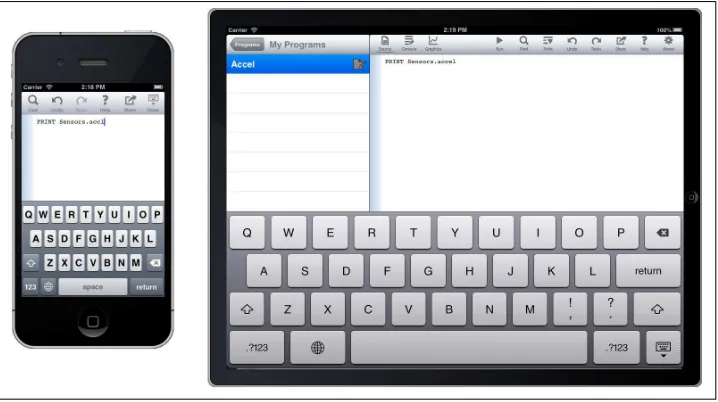
Enter Accel and tap OK. This creates a new, empty program. Enter the source code from our first program:
PRINT Sensors.accel
You should see something like what’s shown in Figure 1-5.
Figure 1-5. The Accel program
If you’re on an iPhone, you will need to dismiss the keyboard by tapping the Dismiss Keyboard button, then navigate back to the program list by tapping the Programs but‐ ton. The Dismiss Keyboard button is the button at the top right that looks like a little keyboard with a triangle under it. You can dismiss the keyboard on the iPad, too, but it’s optional.
Now tap the name of the program. On the iPad, you can also tap the Run button on the button bar. The screen will shift automatically to the console, which is the display that shows text input and output. Here’s what I saw on my iPad when I ran the program:
-0.912109 -2.288818E-04 -0.394318 80395.372433
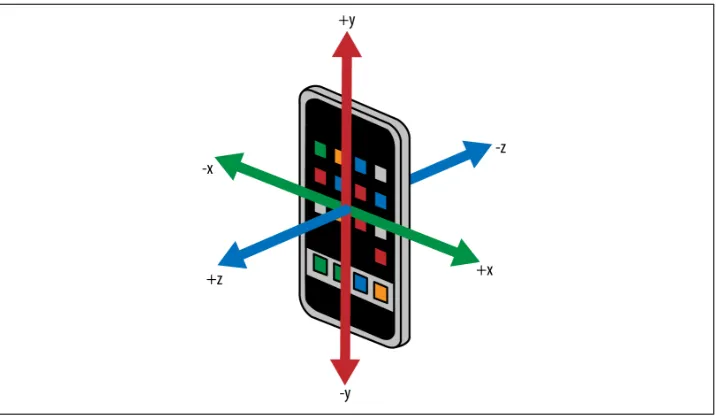
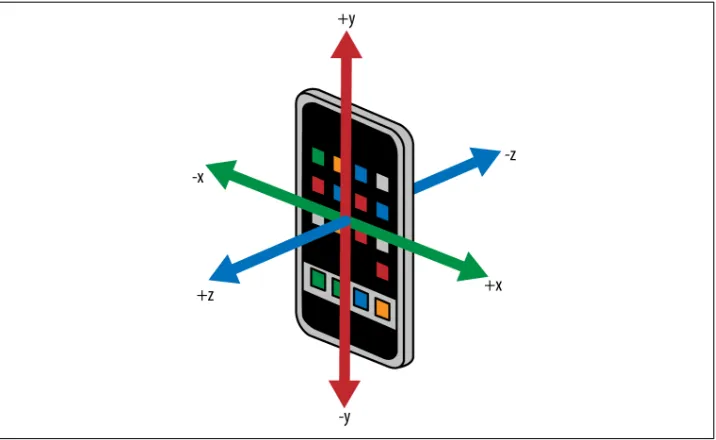
Acceleration is measured in units of gravities. These numbers show I was using my iPad in portrait mode, with the home button to the right. The acceleration along the x-axis is nearly –1, indicating that the left edge of the iPad was down. Apparently my desk is just about perfectly level, because acceleration along the y-axis was zero to three decimal places. The iPad was tipped back slightly on a folding stand, so the z acceleration was slightly negative. Figure 1-6 shows the coordinate system used by iPhone and iPad sensors. The time code doesn’t tell you the actual time, just the number of seconds that have elapsed since some arbitrary time.
Figure 1-6. The coordinate system used by sensors on the iPhone and iPad—the coordi‐ nates stay fixed as the iPhone rotates, so –y always points to the home button
Run the program a few times, holding the iPhone or iPad in various orientations. You’ll clearly see the sensor readings change.
The Accelerometer
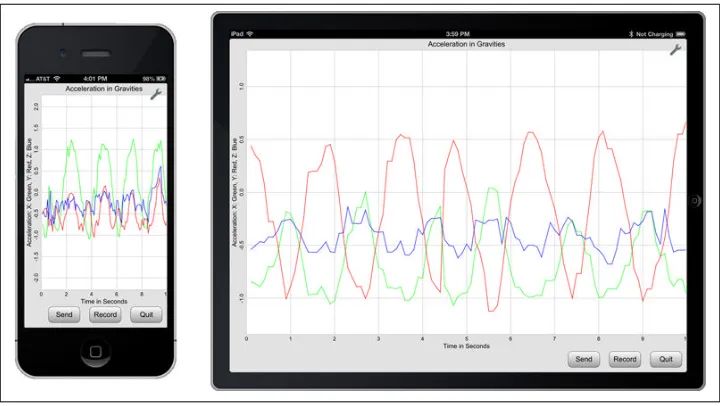
While the simple program to read the accelerometer certainly does the job, we want something a bit more sophisticated. Our next program, seen in Figure 1-7, will read the accelerometer continuously, plotting the acceleration along each of the three axes on an oscilloscope-like display. Pressing the Record button records the data, writing it to a datafile that we can then read in other programs for subsequent processing. Of course, we may want to share the data or analyze it from another computer, so the Send button will send the most recent datafile to another device as an email attachment.
Figure 1-7. The Accelerometer app
Like all plots in techBASIC, this one can be resized and panned. Swipe up or down to see higher or lower values along the y-axis, or pinch vertically to see a wider range or to zoom in. techBASIC normally supports a few other features, like panning along the x-axis or tapping to see the value of a point on the plot, but these have been disabled, since they aren’t necessary in this program.
Before we look at the source code, give the program a try to get familiar with it. Navigate to the O’Reilly Books folder and run the Accelerometer program. Be sure to record some data and email it to yourself. Try the swipe and pinch gestures to see how they work. Knowing how the program works will help as we dig through the source code.
This program is a sample in techBASIC and techBASIC Sampler, so there is no need to type it in. Look for the program called Accelerom‐ eter in the O’Reilly Books folder.
Now that you have taken a moment to run the program and see what it does, let’s dive in and see how it works. We’ll break the program up into bite-sized pieces and explore how each piece works. Here’s the first chunk, which you will see right at the top of the full program listing:
! Shows a running plot of the acceleration for the last 10 ! seconds in 0.1-second intervals. Supports recording the ! values and emailing the results.
! Create the plots and arrays to hold the plot points.
DIM p as Plot, px as PlotPoint, py as PlotPoint, pz as PlotPoint DIM ax(100, 2), ay(100, 2), az(100, 2)
The lines that start with an exclamation point are comments. They don’t do anything; they exist solely so we can understand the program later.
The program shows the acceleration using three point plots that are shown on a single set of axes. The overall image is called a Plot in techBASIC, and a PlotPoint object handles each of the three point plots. These will be used in several places in the program, so they are defined in a DIM statement at the start of the program. The points that actually show up on the plot are stored in two-dimensional arrays; each array has 100 x, y pairs. These are defined in a second DIM statement.
! Create the controls.
DIM quit AS Button, record AS Button, send AS Button
The three buttons that appear at the bottom of the screen are defined next. Each will be a Button object.
! Create and initialize the global tracking variables. fileName$ = "tempdata.txt"
recording = 0 index = 1
! Get and set an initial time for the accelerometer. DIM t0 AS DOUBLE
a = Sensors.accel t0 = a(4)
There are several variables that will be used in multiple places as the program runs, so these are initialized next:
filename$ holds the name of the file used to store acceleration data when it is recorded. It could be hardcoded in each place it is used, but placing it here makes it easy for you to change the filename if you would like to use some other name.
recording is a flag used to indicate if the accelerometer data is being recorded or just displayed on the plot. The program will set this value to 1 whenever it is recording data.
The program sweeps across the plot, replacing the oldest accelerometer reading with the most recent one. index is used to keep track of the next location where an acceleration value will be recorded. Setting it to 1 tells the program to start at the leftmost point on the plot.
As you will see in a moment, the program will use a timer to tell when new accelerometer data is available, as well as when it was actually recorded by the accelerometer. t0 is used to keep track of the time of the last accelerometer reading. It’s actually initialized by taking an initial accelerometer reading, recording the time, and throwing away the acceleration values.
With all of the variables declared and initialized, the program calls a subroutine to set up the user interface.
! Create the user interface. setUpGUI
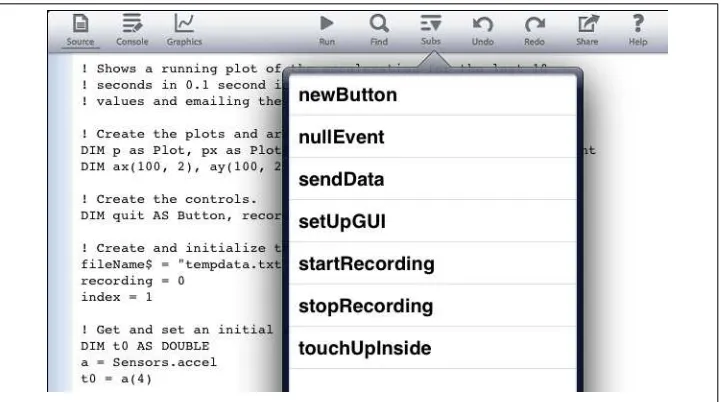
If you glance at the complete source code for the program, you will see that the rest of the program is a collection of subroutines. On the iPad, you can see a list of the sub‐ routines by tapping the Subs button shown in Figure 1-8. Setting up the user interface is the last thing the program does. The reason it doesn’t just stop at this point is that it’s an event-driven program. Two subroutines that handle events appear in the code. The program will continue to run, processing these events indefinitely, until we stop it. Since the program takes over the full screen, the obvious way to stop it is using the Quit button.
Figure 1-8. The subroutine list from the Subs button
There actually is another way to stop the program, though. Did you notice the small tool icon at the top right of the graphics screen? Tap this button and a menu of choices will show up, as shown in Figure 1-9.
Figure 1-9. The tools icon and menu
One of the options is Stop. You can use this to stop a program you are working on, even if it has a bug that prevents the Quit button from working. There are several other options that give you access to the step-and-trace debugger, making it easier to find those pesky digital arthropods. See the techBASIC Quick Start Guides or Reference Manual for a quick but complete introduction to the debugger.
Getting the techBASIC Documentation
The techBASIC Reference Manual and Quick Start Guides are free downloads, available at the Byte Works website. They are PDF documents, so you can read them from iBooks on your iPad or iPhone.
There are lots of subroutines to look at. Let’s start with the one that creates the user interface. From the iPhone, scroll down or use the Find button to search for the sub‐ routine. From the iPad, tap the Subs button to get a list of subroutines, then tap setUp‐ GUI to jump right to that subroutine.
! Set up the user interface.
SUB setUpGUI
! Tell the accelerometer to update once every 0.05 seconds. sensors.setAccelRate(0.05)
In theory, the accelerometer can take readings at a speed of up to about 100 samples per second. It won’t be able to do it that quickly while we continuously update a plot, though. It also rarely records that fast even when a program is doing nothing but gathering accelerometer data. In any case, we’re going to create a 10-second plot with 100 points, so we only need a new value about once every tenth of a second. It turns out that the accelerometer software in the operating system considers the data rate we specify to be a hint, not a commitment, and the data will come back at time intervals that don’t exactly match the time we ask for. We’ll ask for the data about twice as fast as we really need it, one point every 0.05 seconds, to make it more likely that we’ll get a new value at least once every tenth of a second.
Why not just ask for it as fast as we can get it? Sensors use a fair amount of battery power, and they use more power at faster sampling rates. Only asking for the data we need saves the device’s battery.
The three point plots each contain 100 x, y pairs used to locate the point that will be plotted on the screen. The y values will be set by the accelerometer as the program runs. The x values don’t change—the program simply updates the y values as needed. These lines set the x values for each of the points to evenly distribute them across the plot. It uses values from 0.1 to 10.0, corresponding to the time value shown on the x-axis of the plot.
! Initialize the plot and show it. p = Graphics.newPlot
The first step in creating the plot is to create the plot object that defines the axes. The variable p used to hold the Plot object was declared earlier in the program, but the plot doesn’t exist until this line is executed.
p.setTitle("Acceleration in Gravities") p.setXAxisLabel("Time in Seconds")
p.setYAxisLabel("Acceleration: X: Green, Y: Red, Z: Blue") p.showGrid(1)
p.setGridColor(0.8, 0.8, 0.8)
Now that the plot exists, we can make it pretty, adding labels and creating a nice grid for a background.
p.setAllowedGestures($0042)
techBASIC supports a number of gestures to manipulate plots. For two-dimensional plots, swiping moves a plot around, pinching zooms in or out, and tapping shows the coordinates of a point on the plot. Since the horizontal axis is fixed and the points are constantly updating, most of these gestures are inappropriate in this program. This line turns all of them off except pinching and translation along the y-axis.
px = p.newPlot(ax) px.setColor(0, 1, 0) px.setPointColor(0, 1, 0)
These lines create the first of the three point plots. The first line creates the Plot Point object, saving it in the global variable px. The next two set the color of the con‐ necting lines and points to green. This is the plot that will show acceleration along the x-axis, which is the horizontal axis as the iPhone or iPad is held with the home button down.
py = p.newPlot(ay) py.setColor(1, 0, 0) py.setPointColor(1, 0, 0)
pz = p.newPlot(az) pz.setColor(0, 0, 1) pz.setPointColor(0, 0, 1)
Here we do the same thing for the y- and x-axes, coloring the plots red and blue.
! Set the plot range and domain. This must be done ! after adding the first PlotPoint, since that also ! sets the range and domain.
p.setView(0, -2, 10, 2, 0)
Plots default to show the points in the first equation or set of points plotted. This line sets the view to show ±2G for 10 seconds.
! Show the graphics screen. Pass 1 as the parameter ! for full-screen mode.
system.showGraphics(1)
Now that almost everything is set up, the program switches to the graphics screen. Passing a 1 for the last parameter tells techBASIC to hide the development environment, using the full screen for the program.
! Lock the screen in the current orientation. orientation = 1 << (System.orientation - 1) System.setAllowedOrientations(orientation)
This is an accelerometer, and we expect anyone using it to bounce the iPhone about, turn it, and so forth. The iPhone normally responds to this by changing the screen orientation. There are two reasons we don’t want that default behavior. The first is that
it actually takes quite a bit of time for iOS to recreate the screen in a new orientation, and we don’t want to lose any data while it’s working. The second is that it’s ugly.
These lines look to see what orientation the device is in when the app starts, and locks it into that orientation.
! Set the plot size.
p.setRect(0, 0, Graphics.width, Graphics.height - 47)
The default size for a plot is to fill the screen. We need room at the bottom for the buttons, so we manually set the size of the plot to leave 47 pixels at the bottom of the screen.
! Draw the background. Graphics.setPixelGraphics(0)
Graphics.setColor(0.886, 0.886, 0.886)
Graphics.fillRect(0, 0, Graphics.width, Graphics.height)
That area at the bottom of the screen starts off white. This paints it the same light gray used for the background of the plot.
! Set up the user interface. h = Graphics.height - 47
quit = newButton(Graphics.width - 82, h, "Quit") record = newButton(Graphics.width - 174, h, "Record") send = newButton(Graphics.width - 266, h, "Send")
Here we call a subroutine to create the three buttons at the bottom of the screen.
! If there is nothing to send, disable the Send button. IF NOT EXISTS(fileName$) THEN
send.setEnabled(0) END IF
END SUB
We can’t send the datafile in an email if it doesn’t exist. If there isn’t already a datafile from a previous run, setEnabled(0) disables the Send button so the users know it can’t be used and don’t think our program is broken when they tap the button and it does nothing.
Well, some of them will think it’s broken, anyway. That’s users for you. But at least we made an effort.
! Creates a new button with a gradient fill. !
FUNCTION newButton (x, y, title AS STRING) AS Button DIM b AS Button
b = Graphics.newButton(x, y)
The subroutine that set up the user interface called this one to do the grunt work of creating a button. That’s because there are several tasks that would have been repeated three times. It also makes the program easier to change. If you decide you want blue buttons, you just need to change the color once and all of the buttons will be updated.
The first part should look familiar, even though you haven’t seen the program create a button yet. The button is declared with a DIM statement and created with a newButton
call, and the title is set using setTitle.
The next two lines are the ones that give the nice gradient fill on the button, a small but professional touch that adds a lot to the overall impression people get when looking at a program. The lines vary the button color from white to a medium gray. There are lots of other options in techBASIC, like changing the angle of the gradient, but this simple gradient looks nice and is easy to create.
Finally, the newly created button is returned to the caller, where the setUpGUI subroutine stores it in the appropriate variable.
At this point we have a complete program, but if you were to run it, it would stop without doing anything interesting. It’s time to tell techBASIC that we want some events.
! Handle a tap on one of the buttons. !
! Parameters:
! ctrl - The button that was tapped. ! time - The time when the event occurred.
SUB touchUpInside (ctrl AS Button, time AS DOUBLE) IF ctrl = quit THEN
stopRecording STOP
ELSE IF ctrl = record THEN IF recording THEN stopRecording ELSE
startRecording END IF
ELSE IF ctrl = send THEN stopRecording
sendData END IF END SUB
Simply creating a subroutine with the name touchUpInside and this parameter list turns the program into an event-driven program. It will run until deliberately stopped, waiting for the user to tap on a button. When a button is finally tapped, this subroutine is called. It gets the button object, which we can use to figure out which of the three buttons was pressed, and the time when the button was tapped.
The IF statement checks to see which button was tapped, comparing the parameter to the variables holding the three buttons. There are other ways to detect which button was pressed, but this one is easy to implement and understand.
For the Quit button, the program stops any recording that might be in progress by calling stopRecording, then stops the program.
The Record button actually does two different things. If the program is not recording the acceleration data, it starts; if the program is already recording acceleration data, it stops.
Finally, the Send button stops any recording that might be in progress, then calls yet another subroutine to create an email and send the data.
All of the interesting stuff is happening in subroutines. Here’s the first:
! Called when the program should start recording ! data, this subroutine changes the name of the ! recording button to Stop, opens the output file, ! and sets a flag indicating data should be ! recorded.
SUB startRecording record.setTitle("Stop") recording = 1
OPEN fileName$ FOR OUTPUT AS #1 END SUB
The record button does double duty, functioning both as a Record and a Stop button. This saves space, which is really at a premium on the iPhone, and also makes the program a little easier to write and perhaps a little easier to use by not showing and handling a lot of disabled buttons. The startRecording subroutine is called to start a recording. The user needs a way to stop it, too, so when the button is pressed one of the things the code does is change the name of the button to Stop.
We still haven’t gotten to the code that actually reads the accelerometer, but when we do, it will need to know if it is supposed to record to the data file, or just draw what it reads on the plot. Setting recording to 1 is our signal to do both.
Finally, if we’re going to write stuff to a file, we need to open the file. The OPEN command opens a file for output.
Files in BASIC
Files are one of those things that seem to be different in just about every programming language. If you’re already good at a programming language other than BASIC, most of what you have seen up to this point should be pretty easy to read, even if the syntax is not quite what you are used to. The OPEN command may look odd, though.
BASIC files are referenced by a file number. There can be lots of them, but each unique file that is opened needs a unique number associated with that file. All file commands that manipulate the data in the file use this number. The number appears after a # character in all of the file-related commands. The open command in our subroutine is opening file number 1. Later, the program will write to the file with print statements that use the same number, like:
PRINT #1, a(1); ","; a(2); ","; a(3); ","; a(4)
and close the file with:
CLOSE #1
While you usually see the file number coded as a constant, it’s okay to use a variable.
Files can be opened for OUTPUT, as is done here, or for INPUT. They can also be opened several other ways. While most programs in this book will read and write text data using standard BASIC PRINT and INPUT statements, it’s also possible to get absolute control over a file, reading and writing binary data. See the techBASIC Reference Manual or any good book on BASIC for details.
! Called to stop recording data, this subroutine ! changes the name of the recording button to ! Recording, clears the recording flag and closes ! the output file.
!
! It is safe to call this subroutine even if ! nothing is being recorded.
SUB stopRecording IF recording THEN
record.setTitle("Record") CLOSE #1
recording = 0 send.setEnabled(1) END IF
END SUB
The stopRecording subroutine undoes all of the actions taken by the startRecord ing subroutine. The only finesse is that it checks to make sure a recording is in progress before stopping it. That makes the program logic easier back in touchUpInside, as it
means the code to handle the Quit and Send buttons doesn’t have to check to see if a recording is in progress. Instead, it can just call the subroutine, knowing that if a re‐ cording is in progress it will be stopped, but that it’s safe to call the subroutine even if the program isn’t recording the acceleration data.
! Send the last recorded data file to an email.
SUB sendData
button = Graphics.showAlert("Can't Send", _ "Email cannot be sent from this device.") END IF
END SUB
The code in touchUpInside that handles the Send button calls this subroutine to do the work. It defines and initializes the email object.
Not all iOS devices can actually send an email. Some may have the capability turned off, for example. The program starts by checking to see if it’s possible to send an email, showing an alert if not.
If email is supported, it’s a simple matter to attach the datafile, create a short subject and message, and send it. As you saw when you tried the program, pressing Send doesn’t actually send the email, it just gets it ready and presents the mail message to the user. This gives the user a chance to address the email and send it manually.
It might seem nice if you could skip that step, addressing the email and sending it without user interaction. Apple blocks that action, though, and I think appropriately so; this ensures that rogue programs cannot collect and send information without the user’s knowledge.
! Called when nothing else is happening, this ! subroutine checks to see if 0.1 seconds have ! elapsed since the last sensor reading. If so, a ! new one is recorded and displayed.
!
! Parameters:
! time - The time when the event occurred.
SUB nullEvent (time AS DOUBLE) a = Sensors.accel
The final subroutine is the one that actually collects and handles the acceleration data. This subroutine is called nullEvent. techBASIC calls it any time it is not busy doing
something else, which in this program means any time except when a tap on a button is being handled. The subroutine starts by grabbing the most recent accelerometer value.
IF recording AND (t0 <> a(4)) THEN
PRINT #1, a(1); ","; a(2); ","; a(3); ","; a(4) END IF
Because this subroutine can be called pretty rapidly—more often than we’ve asked the accelerometer to collect acceleration information—we need to check to see if the time‐ stamp has changed since the last reading. If not, we’ve already handled this value and don’t need to do so again. We also check to see if the program is supposed to save the acceleration data in the output file. If both conditions are met, the value from the ac‐ celerometer is written to the file.
The four numbers are separated by commas, and each reading is placed on a separate line. This is the so-called comma-separated values, or CSV, file format. It’s extremely common, and a very easy format to write and read in BASIC. It’s also a format that most spreadsheets and databases can read and write, so using it makes it easy to process the accelerometer data offline.
The last section of the subroutine checks to see if at least one-tenth of a second has elapsed since the last value was placed in the plot. If so, it places the reading in the array holding the points to plot. Critically, it then loops to see if it needs to place the same point in again. This could happen if iOS was busy doing something else and didn’t record a value for, say, a quarter of a second.
Finally, the arrays are passed to the various point plots using the setPoints method. This is where the plot actually gets updated.
As you’ve seen, almost all of the work is in creating and handling the user interface. There is a lot to creating a pleasant, usable user interface, so the program is a bit involved, but the effect is worth it.
We’re also going to reuse most of the code for our next two programs!
CHAPTER 2
Accessing the Other Built-in Sensors
About This Chapter
Prerequisites
The programs in this chapter are adaptations of the accelerometer from Chap‐ ter 1; read it first if this chapter seems confusing.
Equipment
You will need an iPhone, iPod, or iPad running iOS 5 or later.
Software
You will need a copy of techBASIC or techBASIC Sampler.
What You Will Learn
This chapter shows how to access the magnetometer and gyroscope built into most iOS devices. You can use them for anything from direction finding to augmented reality.
Toward the end of the chapter you’ll also learn a bit more about techBASIC, including another way to access the sensors that gives faster response times and how to use the techBASIC help system to find out more about these and other commands.
The chapter closes with a quick look at two other services. While not sensors in the traditional sense, they are accessed that way. One is GPS, and the other is heading, which uses the magnetometer and compass to find direction.
Writing our first GUI-based program to display sensor data from the iPhone and iPad in Chapter 1 was a bit involved. After all, you were learning a new programming envi‐ ronment as well as learning about the sensors. With that basic knowledge (pardon the pun), it’s time to quickly expand what we can do. Among other things, we need to finish our tricorder!
The Gyroscope
Starting with the iPhone 4, all iPhones include a three-axis gyroscope. You might think a gyroscope is unnecessary, since the accelerometer can tell you the orientation of a device (as shown in Figure 2-1) and tracking it over time will tell you about changes in orientation, but it turns out the accelerometer really won’t work well as a gyroscope substitute. One reason has to do with basic physics. The acceleration of gravity is not the only acceleration the accelerometer is exposed to; movement also causes accelera‐ tion. The other reason is practical. The accelerometer just can’t detect rapid changes in orientation as well as a sensor like a gyroscope that is specifically designed for the task.
Figure 2-1. The orientation for the axes is the same for the accelerometer, gyroscope, and magnetometer
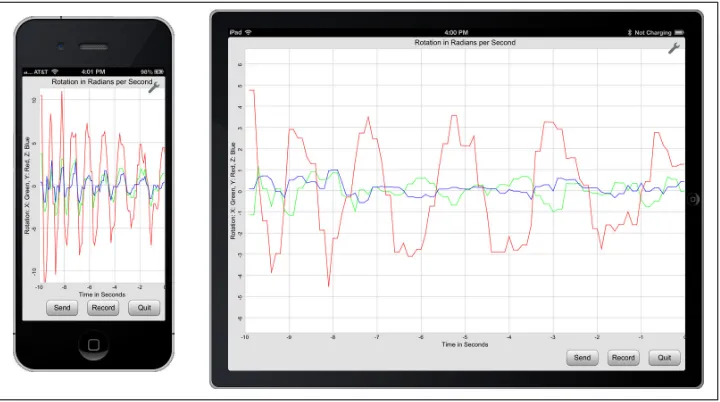
The gyroscope app we’re going to build in this chapter (shown in Figure 2-2) looks a lot like the accelerometer app.
Figure 2-2. The Gyroscope app
The code is very similar, too. In fact, there are so few differences that we’re not going to go through the program line by line. Let’s look at the changes.
The first and most obvious change is that we’re reading a different sensor. Instead of reading the accelerometer with a command like:
PRINT Sensors.accel
we read the gyroscope with the very similar command:
PRINT Sensors.gyro
There is another subtlety, though. Did you know that the gyroscope is only available in some models of the iPhone? That means it is very important to check to make sure it’s there before we use it. This changes the program in two places. The first is right in the setup code, when we grab our initial value for the time:
! Get and set an initial time for the gyroscope. DIM t0 AS DOUBLE
IF Sensors.gyroAvailable THEN WHILE t0 = 0
r = Sensors.gyro t0 = r(4) WEND END IF
The IF statement checks to see if the gyroscope is available before trying to read it. There is also a WHILE loop to make sure we get a nonzero time. That’s because the gyroscope might return a zero time as it warms up.
The second change is at the end of setUpGUI:
! Make sure a gyroscope is available. If not, say ! so and stop the program.
IF NOT Sensors.gyroAvailable THEN
msg$ = "This device does not have a gyroscope. " msg$ = msg$ & "The program will exit."
button = Graphics.showAlert("No Gyro", msg$) STOP
END IF
This code checks to see if there is a gyroscope. If not, it puts up an alert to that effect and stops the program.
There is another minor update at the start of setUpGUI. The command to set the sensor rate must be changed to set the gyroscope sampling rate rather than the accelerometer sampling rate. Here’s the new code:
SUB setUpGUI
! Tell the gyroscope to update once every 0.05 seconds. Sensors.setGyroRate(0.05)
Running the program, you might notice that the running graph is handled in a slightly different way. The accelerometer app traced to the end, then wrapped around, updating from the beginning of the plot. The gyroscope app updates continuously, shifting the existing points to the left and placing the new one on the right. That requires two changes in the program. First, the index variable goes away, since it is no longer needed. The second change is in the nullEvent subroutine, where the code to update the plots changes from:
But doesn’t it take more time to copy 297 values from one spot in an array to another than it does to simply update a single value and move on? Well, yes, but on a modern processor, it’s really not going to affect things much. Copying the array values is very fast. Most performance issues will come from updating the graphics display. It’s certainly
worth considering issues like this, but the performance drop is not enough to see when the program is running.
Lots of Options
The accelerometer and gyroscope handle the plot update differently. Which do you like better? If you prefer one to the other, it’s an easy matter to change the program so it behaves the way you prefer.
Since the program is now showing the current time at the right and going back 10 seconds into the past as you look farther left, the x-axis range has been changed from 0 to 10 to –10 to 0. The two changes needed to make this happen are in setUpGUI. The first is when the x values are initially assigned to the plot arrays:
! Initialize the plot arrays. FOR t = 1 TO 100
rx(t, 1) = t/10.0 - 10 ry(t, 1) = t/10.0 - 10 rz(t, 1) = t/10.0 - 10 NEXT
The second is where the visible range of the plot is initialized. Instead of showing 0 to 10 along the x-axis, the program shows –10 to 0:
! Set the plot range and domain. This must be done ! after adding the first PlotPoint, since that also ! sets the range and domain.
p.setView(-10, -10, 0, 10, 0)
If you have been comparing the code to the accelerometer app, you have probably al‐ ready noticed the last, purely cosmetic change. Various variable names, comments, and labels were changed so they refer to the gyroscope rather than the accelerometer.
Here’s the complete listing for the gyroscope app. It’s also in techBASIC and techBASIC Sampler in the O’Reilly Books folder; look for the app called Gyroscope:
! Shows a running plot of rotation for the last 10 seconds ! in 0.1-second intervals. Supports recording the values ! and emailing the results.
! Create the plots and arrays to hold the plot points.
DIM p as Plot, px as PlotPoint, py as PlotPoint, pz as PlotPoint DIM rx(100, 2), ry(100, 2), rz(100, 2)
! Create the controls.
DIM quit AS Button, record AS Button, send AS Button
! Create and initialize the global tracking variables. fileName$ = "tempdata.txt"
recording = 0
! Get and set an initial time for the gyroscope. DIM t0 AS DOUBLE
! Creates a new button with a gradient fill. !
FUNCTION newButton (x, y, title AS STRING) AS Button DIM b AS Button
! Called when nothing else is happening, this ! subroutine checks to see if 0.1 seconds have ! elapsed since the last sensor reading. If so, a ! new one is recorded and displayed.
!
! Parameters:
! time - The time when the event occurred.
SUB nullEvent (time AS DOUBLE) r = Sensors.gyro
IF recording AND (t0 <> r(4)) THEN
PRINT #1, r(1); ","; r(2); ","; r(3); ","; r(4) END IF
IF r(4) > t0 + 0.1 THEN WHILE r(4) > t0 + 0.1 t0 = t0 + 0.1
FOR i = 1 TO 99
! Send the last recorded data file to an email.
SUB sendData
button = Graphics.showAlert("Can't Send", _ "Email cannot be sent from this device.") END IF
END SUB
! Set up the user interface.
SUB setUpGUI
! Tell the gyroscope to update once every 0.05 seconds. Sensors.setGyroRate(0.05)
! Initialize the plot and show it. p = Graphics.newPlot
p.setTitle("Rotation in Radians per Second") p.setXAxisLabel("Time in Seconds")
p.setYAxisLabel("Rotation: X: Green, Y: Red, Z: Blue") p.showGrid(1)
p.setGridColor(0.8, 0.8, 0.8)
! Set the plot range and domain. This must be done ! after adding the first PlotPoint, since that also ! sets the range and domain.
p.setView(-10, -10, 0, 10, 0)
! Show the graphics screen. Pass 1 as the parameter ! for full-screen mode.
system.showGraphics(1)
! Lock the screen in the current orientation. orientation = 1 << (System.orientation - 1) System.setAllowedOrientations(orientation)
! Set the plot size.
p.setRect(0, 0, Graphics.width, Graphics.height - 47)
! Draw the background. Graphics.setPixelGraphics(0)
Graphics.setColor(0.886, 0.886, 0.886)
Graphics.fillRect(0, 0, Graphics.width, Graphics.height)
! Set up the user interface. h = Graphics.height - 47
quit = newButton(Graphics.width - 82, h, "Quit") record = newButton(Graphics.width - 174, h, "Record") send = newButton(Graphics.width - 266, h, "Send")
! If there is nothing to send, disable the Send button. IF NOT EXISTS(fileName$) THEN
send.setEnabled(0) END IF
! Make sure a gyroscope is available. If not, say ! so and stop the program.
IF NOT Sensors.gyroAvailable THEN
msg$ = "This device does not have a gyroscope. " msg$ = msg$ & "The program will exit."
button = Graphics.showAlert("No Gyro", msg$) STOP
END IF END SUB
! Called when the program should start recording ! data, this subroutine changes the name of the ! recording button to Stop, opens the output file, ! and sets a flag indicating data should be ! recorded.
SUB startRecording record.setTitle("Stop") recording = 1
OPEN fileName$ FOR OUTPUT AS #1 END SUB
! Called to stop recording data, this subroutine ! changes the name of the recording button to ! Recording, clears the recording flag and closes ! the output file.
!
! It is safe to call this subroutine even if ! nothing is being recorded.
! Handle a tap on one of the buttons. !
! Parameters:
! ctrl - The button that was tapped. ! time - The time when the event occurred.
SUB touchUpInside (ctrl AS Button, time AS DOUBLE) IF ctrl = quit THEN
stopRecording STOP
ELSE IF ctrl = record THEN IF recording THEN stopRecording ELSE
startRecording
END IF
ELSE IF ctrl = send THEN stopRecording
sendData END IF END SUB
Radians or Degrees?
People in the physical sciences, engineers, and mathematicians are often familiar with radians, and are comfortable using the gyroscope’s natural units for rotation of radians per second. But if your reaction to the units was, “radi-what?” it’s easy enough to convert the program to show rotation in degrees per second instead of radians per second. Multiply the sensor readings by 180/π to convert the values reported by the gyroscope from radians per second to degrees per second. techBASIC has a handy function to do just that, called DEG. The easiest place to make the conversion is right after the sensor reading is taken. Add the FOR loop seen here to nullEvent:
SUB nullEvent (time AS DOUBLE) r = Sensors.gyro
FOR i = 1 TO 3 r(i) = DEG(r(i)) NEXT
The range of values will jump too, of course. Change the range of the plot in setUp GUI to ±500, like this:
! Set the plot range and domain. This must be done ! after adding the first PlotPoint, since that also ! sets the range and domain.
p.setView(-10, -500, 0, 500, 0)
Finally, change the plot title to reflect the new units. This line is also in setUpGUI: ! Initialize the plot and show it.
p = Graphics.newPlot
p.setTitle("Rotation in Degrees per Second")
The Magnetometer
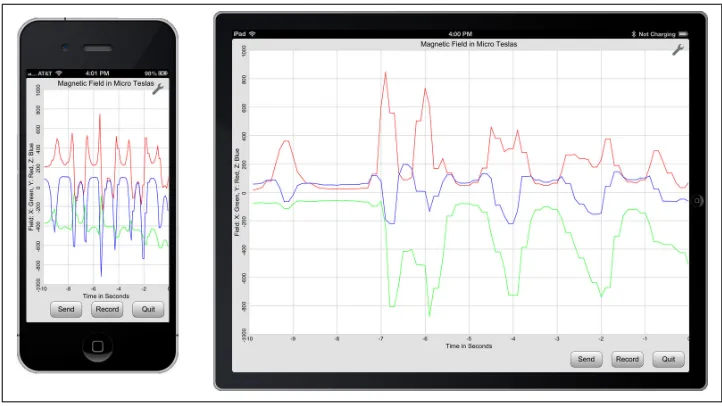
Starting ((()))with the iPhone 3GS, all iPhones include a three-axis magnetometer. It’s used mostly as a digital compass for map-based applications, but it can also measure surrounding magnetic fields. We’ll put that ability to use to create a simple metal detector in Chapter 3, but we’ll start with a very basic app here, shown in Figure 2-3. You can also use a magnetometer to find wires and other sources of current, or just to amuse yourself with refrigerator magnets.
Figure 2-3. The Magnetometer app
The software for the magnetometer is almost identical to the software for the gyroscope. There is the obvious difference of reading a different sensor, but it looks pretty much like reading the accelerometer and gyroscope. Table 2-1 shows the equivalent com‐ mands.
Table 2-1. Sensor command equivalents
Accelerometer Gyroscope Magnetometer
Sensors.accel Sensors.gyro Sensors.mag
Sensors.accelAvailable Sensors.gyroAvailable Sensors.magAvailable
Sensors.setAccelRate Sensors.setGyroRate Sensors.setMagRate
There are also a number of obvious cosmetic changes, like changing variable names, comments, and strings so they make sense for the magnetometer.
The only change of any real substance is due to the huge variation in the strength of magnetic fields. The accelerometer tops out at ±2G for all iOS devices until the iPhone 5, which has a maximum range of ±8G. Setting the vertical scale to ±2G works well. The gyroscope rarely exceeds 10 radians per second, so setting the y-axis to ±10 worked well for our gyroscope app. The magnetometer, though, is sensitive enough to measure the strength of the Earth’s magnetic field. That varies a bit, but is generally around 30–60 microteslas (30–60 µT). The sensor can also detect stronger magnetic fields; it tops out at 1 T, or 1,000,000 µT. Handling such a wide range of values well is a bit of a challenge. Here’s the updated version of nullEvent that handles the range:
! Called when nothing else is happening, this ! subroutine checks to see if 0.1 seconds have ! elapsed since the last sensor reading. If so, a ! new one is recorded and displayed.
!
! If needed, write the value to the output file. IF recording AND (t0 <> m(4)) THEN
PRINT #1, m(1); ","; m(2); ","; m(3); ","; m(4) END IF
! Update the plot. IF m(4) > t0 + 0.1 THEN
! Update the arrays holding the points to plot. WHILE m(4) > t0 + 0.1
! Adjust the function range based on the maximum observed value. max = 0
range = 10^(INT(LOG(max)/LOG(10)) + 1) p.setView(-10, -range, 0, range, 0)
! Update the plots.
The change is near the end, where the range is adjusted dynamically. The program scans the values to find the largest reading. It then uses a little mathematical trick, taking the
integer of the base 10 logarithm of the largest value to find the correct power of 10 for the vertical range. Let’s see how this works.
Let’s start with a value that’s about right for the Earth’s magnetic field, 50 µT. In that case,
LOG(50)/LOG(10) will be a tad under 1.7. Extract the integer part and add 1, and we have 2—the number of zeros we want for the range. Raise 10 to that power, and we get a range of ±100, perfect for displaying values from 10 to 100. Try a few other numbers to convince yourself that the formula will always return 100 for the range when max is 10 or greater and less than 100.
Pass a moderately strong magnet near the iPhone or iPad, and the field strength can jump to a few hundred µT. Try the math again, and you will find the range will be ±1,000 for values of max from 100 to 1,000.
It’s kind of cool to see the program respond to the change in field strength by automat‐ ically adjusting the vertical scale of the plot, but there is a downside; manual adjustment no longer works. Well, it works, but the program resets the range as soon as the next measurement is taken. If this bothers you, remove the code that sets the range.
Here’s the complete source for the magnetometer app. You can also find it in the O’Reilly Books folder in techBASIC and techBASIC Sampler. The program is called Magneto‐ meter:
! Shows a running plot of the local magnetic field for ! the last 10 seconds in 0.1-second intervals. Supports ! recording the values and emailing the results.
! Create the plots and arrays to hold the plot points.
DIM p as Plot, px as PlotPoint, py as PlotPoint, pz as PlotPoint DIM mx(100, 2), my(100, 2), mz(100, 2)
! Create the controls.
DIM quit AS Button, record AS Button, send AS Button
! Create and initialize the global tracking variables. fileName$ = "tempdata.txt"
recording = 0
! Get and set an initial time for the magnetometer. DIM t0 AS DOUBLE
IF Sensors.magAvailable THEN WHILE t0 = 0
m = Sensors.mag t0 = m(4) WEND END IF
! Create the user interface. setUpGUI
! Creates a new button with a gradient fill.
FUNCTION newButton (x, y, title AS STRING) AS Button DIM b AS Button
! Called when nothing else is happening, this ! subroutine checks to see if 0.1 seconds have ! elapsed since the last sensor reading. If so, a ! new one is recorded and displayed.
!
! If needed, write the value to the output file. IF recording AND (t0 <> m(4)) THEN
PRINT #1, m(1); ","; m(2); ","; m(3); ","; m(4) END IF
! Update the plot. IF m(4) > t0 + 0.1 THEN
! Update the arrays holding the points to plot. WHILE m(4) > t0 + 0.1