ScienceDirect
Procedia Engineering 00 (2014) 000–000
www.elsevier.com/locate/procedia
1877-7058 © 2014 The Authors. Published by Elsevier Ltd.
Peer-review under responsibility of organizing committee of the 2nd International Conference on Sustainable Civil Engineering Structures and Construction Materials 2014.
2nd International Conference on Sustainable Civil Engineering Structures and Construction
Materials 2014 (SCESCM 2014)
State-of-the-Art Report on Partially-Prestressed Concrete
Earthquake-Resistant Building Structures for Highly-Seismic
Region
I Gusti Putu Raka
a,* Tavio
a, Made Dharma Astawa
aa
Sepuluh Nopember Institute of Technology (ITS), Sukolilo, Surabaya 60111, Indonesia
Abstract
Prestressed concrete has long been accepted in statically loaded structures. Thus, for many years now we have seen the construction of prestresed concrete bridges, dams, pipelines, reservoirs and various structures including more recently atomic reactor pressure vessels. These stand as irrefutable proof of engineers’ confidence as to the integrity of this new material. In recent years prestressed concrete has been used in seismic resistant structures. Just like any other new material, it will attract criticism and comment, sometimes by people who may not have had the opportunity of full investigation of the material in question. Furthermore, today engineers are more critical of any new material or technique and will seldom accept them unless conclusive evidence of their performance can be produced. This is as it should be. The purpose of this paper is to observe the application of prestressed concrete to seismic resistant multi-storey structures. However, this paper should be read bearing in mind the fact that the widest application of prestressed concrete (to bridge and kindred structures) has been in the countries subject to earthquake and with operative seismic codes. In the paper, the latest seismic design procedure for prestressed concrete buildings in Indonesia is introduced. The current design method is based on the latest Indonesian Building Code for Structural Concrete and Seismic Code, namely SNI 2847:2013 and SNI 1726:2012, respectively. The design method itself is not a novelty to those who are familiar with the capacity design developed for years. This paper is also intended to bring the attention of structural designers and other engineers to the option of using partially-prestressed concrete in buildings. The results of an investigation into the seismic resistance of partially-prestressed concrete frames are described. The experimental part of the project involved the testing of six near full scale beam-interior column assemblies under static cyclic loading to obtain information for seismic design.
© 2014 The Authors. Published by Elsevier Ltd.
Peer-review under responsibility of organizing committee of the 2nd International Conference on Sustainable Civil Engineering Structures and Construction Materials 2014.
* Corresponding author.
Keywords: cyclic loading; earthquake-resistant building structures; highly-seismic region; Indonesian Building Codes; Indonesian National Standards; partially-prestressed concrete.
1.Introduction
Reinforced concrete structures have been used for many years in high-rise buildings all around the world due to their constructability and maintenance easiness [1-20]. Prestressed concrete system is ideally implemented in a building to allow engineers to design longer spans of beams or girders. However, it is mainly restricted to one loading direction, e.g. gravity load. The idea of applying the prestressing force is that the pre-compressed load is used to decompress the potential tensile stress area in the section of a beam or girder.
In many buildings, the need of more spacious area without any columns is becoming increasingly popular. This will certainly require longer spans of beams or girders. The use of reinforced concrete is not efficient in the case since the size of the beams becomes too large particularly in terms of aesthetics and architectural requirements. Furthermore, the self-weight will be dominant in the case and thus, the seismic load will also increase. One of the solutions that can be adopted is that to use the prestressed concrete system. However, the weakness of the system is that it has an issue with the resistance to the reversed cyclic loading (earthquake or wind load). In this case, partial prestressing system is one of the solutions.
The ductility aspects of this system have long been discussed by many researchers. Some of those are Naaman et al. [21] and Park and Thompson [22]. Naaman et al. [21] discussed on the analysis of ductility in partially prestressed concrete flexural members, whereas Park and Thompson [22] illustrated in details on the ductility of prestressed and partially prestressed concrete beam section. The requirements of the Indonesian National Standard on Structural Concrete (SNI 2847-2013) [3] which limits the contribution of prestressing tendon in the design of seismic resistance buildings (primarily adopted from ACI318M-08 [24], Section 21.5.2.4(c): “Prestressing steel shall not contribute to more than one-quarter of the positive or negative flexural strength at the critical section in a plastic hinge region and shall be anchored at or beyond the exterior face of the joint”). This issue is closely related to the ductility factor required for ductile seismic-resistant structures which requires to be examined further.
The ductile behaviors of the partial prestressing beam-column joints subjected to cyclic loading which is part of the extensive research conducted by the authors is discussed herein.
Nomenclature : a = High compressive stress block of concrete = Global Reinforcement Index
p = Comparison of tensile strength of the tendon to the concrete compressive strength
PPR = Partial Prestressing Ratio Vcol = Shear strength of joint
Vjh = Horizontal shear strength of joint
2.Experimental Test
2.1.Test specimens
which the columns were subjected to various axial loadings, i.e. 10, 17.5, and 25 percent of the axial column capacity, namely P1 = 640 kN, P2 = 1120 kN, and P3 = 1600 kN. The schematic of the specimens are shown in
Figures 1 and 2.
The dimensions of the beams are 400 mm 250 mm, while the dimensions of the columns are 400 mm 400 mm. The concrete cover is 35 mm. The concrete compressive strength (fc) obtained from the test specimens is about 41 MPa in average. The yield strength (fy) of the deformed mild steel with diameter of 16 mm (D-16) from the test is 541 MPa. For D-13, the value of fy is about 594 MPa. The plain mild bars used as stirrups in the specimens have the diameter of 10 mm (-10) and 8 mm (-8), and the values of fy obtained from the tests are approximately 314 MPa dan 310 MPa, respectively. The ultimate strength (fpu) of the prestressing tendon with the diameter of 12.7 mm from the test is about 1790 MPa.
The beam design (250 400 mm)
Concrete strength (fc) = 41 MPa Mild steel:
Top rebar 5 D-13 where As = 663.7 mm2 Bottom rebar 3 D-13 where As = 398.2 mm2 Prestressing tendon:
One tendon consists of two strands with the nominal diameter of 12.7 mm The area of the tendon (Aps) = 2 98.71 mm2 = 197.42 mm2, fps = 1030 MPa
Requirement checks:
- Under-reinforced:
- Comparisons of tendon area (Aps) to the area of concrete (Ac)
According to ACI and UBC: ,
- Effective depth of concrete block stress
,
- Spacing of stirrups
For partial prestressing beams according to Thompson and Park [22], the value should be between 1” to 7” (b)
(
(
(b)
Fig. 1. Interior beam-column joint: (a) elevation and
detailing; Fig. 2. Exterior beam-column joint: (a) elevation and detailing ;
(25.4 mm to 178 mm), thus, it is used stirrups of 8-75 mm (OK)
The reinforced concrete column (400 mm 400 mm) with longitudinal reinforcement of 6 D-16 + 4 D-13 (As = 1837.3 mm2, 0.01 < g < 0.06), stirrups of -10 – 50 mm, satisfies the Indonesian Standard (SNI)
In overall, the summary of the specimens are listed in Table 1.
Table 1 – Summary of beam-column joint specimens
Type Structural
continued to a drift ratio greater than 3.5 percent to see the ultimate performance to the specimens. Some of them even reached up to 5 percent.
Test setup
The specimens were tested using the actuator with the maximum capacity of 2000 kN for lateral force and a maximum capacity of 1000 kN in vertical direction. The test setup of the specimen is shown in Figures 4 and 5
3.Studied Parameters
3.1.Load capacity
According to SNI 03-1726-2002 [27], the capacity of a structure should satisfy fi = Py/Pi ≥ 1.2, where Py is the load at yielding condition defined at the story drift of 3.5 percent, and Pi is the ideal load at elastic condition defined at a story drift of 1 percent.
Fig. 3. Typical reversed cyclic loading patterns.
3.2.Structural stability
There are three criteria defined in the Proposed Revision to 1997 NEHRP Recommended Provisions for Seismic Regulation for Precast Concrete Structure [26], namely:
(1) Until end of testing in two loading directions, the load resisted by the structure should be greater than 75 percent of the maximum load;
(2) The ratio of area formed by the hysteretic loop to the area of the parallelogram which is formed by the intersection of the tips of the hysteretic loop and the gradient of the reversed loading patterns should be greater than 0.125;
(3) The ratio of the gradient of the hysteretic loop which is bounded by –x and +x should be at least 0.5 times the initial gradient of the structure at first loading cycle.
If the specimen satisfies the overall above requirements meaning that the structure satisfies the requirements of Special Moment Resisting Frame as per SNI 03-1726-2002 [27] and ACI 318M-08 [24].
3.3.Structural ductility
The structural ductility analysis is obtained from the maximum lateral displacement divided by the initial displacement of the structure. The displacement ductility (μΔ) is one the parameter considered to evaluate the performance of the structure.
3.4.Contribution of tendon capacity
The analysis of the tendon contribution on the flexural capacity of the beam according to the provisions of SNI 2847-2013 [23] in which limits the contribution of the prestressing tendon (adopted from ACI 318M-08 [24], Section 21.5.2.4(c): “Prestressing steel shall not contribute to more than one-quarter of the positive or negative flexural strength at the critical section in a plastic hinge region and shall be anchored at or beyond the exterior face of the joint”).
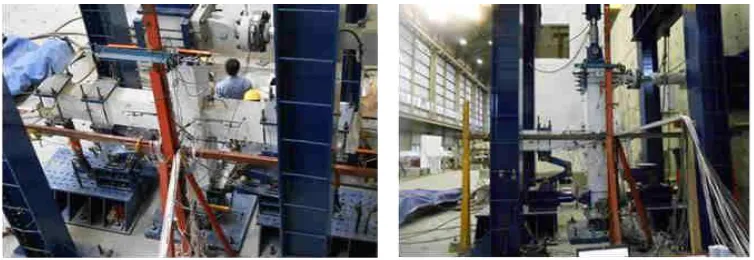
4.Test Results
The followings are the results of the experimental test carried out by the authors and given in the forms of graphical representations.
5.Experimental Result Discussion
From the tests, four parameters discussed above (load capacity, stability, and structural ductility as well as the contribution of tendon capacity is analyzed. The summary of the analytical results can be seen in Tables 2 to 10.
5.1.Interior beam-column joint specimens
The structural ductility analysis is obtained from the maximum lateral displacement divided by the initial displacement of the structure. The displacement ductility (μΔ) is one the parameter considered to evaluate the performance of the structure.
5.1.1.Load capacity
Table 2 – Comparisons of yield load vs. initial load capacities at 3.50 percent story drift. No. Specimen
Column Axial
Load Lateral Cyclic Yield Load Py (kN)
Ideal Load
Pi (kN) Result Note
% kN Compression Tension Compression Tension Compression Tension Compression-Tension
1 Specimen 1 Interior 10 640 138.30 137.60 108.50 106.20 1.27>12 1.29 >1.2 OK
2 Specimen 2 Interior 17,50 1120 138.30 137.60 108.50 106.2 1.27>1.2 1.29 >1.2 OK
3 Specimen 3 Interior 25 1600 134.70 126.90 107.90 104.90 1.25>1.2 1.21 > 1.2 OK
Table 3 – Comparisons of yield load vs. initial load capacities at 4.50 percent story drift.
No. Specimen
Column Axial
Load Lateral Cyclic Yield Load Py (kN)
Ideal Load
Pi (kN) Result Note
% kN Compression Tension Compression Tension Compression Tension Compressio-Tension
1 Specimen 1 Interior 10 640 142.30 137.60 108.50 106.20 1.31>1.2 1.28 >1.2 OK
2 Specimen 2 Interior 17,50 1120 142.30 137.60 108.50 106.2 1.31>1.2 1.29 >1.2 OK
3 Specimen 3 Interior 25 1600 114.10 89.00 107.90 104.90 1.06<1.2 0.85<1.2 NOK
5.1.2.Structural stability
Table 4 – Ultimate capacities of specimens to resist lateral load at 3.50 percent story drift.
No. Specimen
Maximum load
(kN) Load at 3rd cycle (kN) Result (%) Note
Compress
ion Tension Compression Tension Compression Tension Compression-Tension
1 Interior
Specimen 1 138,30 137,60 130,70 131,00 94,50 >75,0 95,20 > 75,0 OK
2 Interior
Specimen 2 142,30 137,60 130,7 131,00 91,85>75,0 95,20 > 75,0 OK
3 Interior
Specimen 3 134,70 126,90 134,70 126,90 100,0> 75,0 100,0>75,0 OK
Table 5 – Ultimate capacities of specimens to resist lateral load at 4.50 percent story drift. No. Specimen
Maximum load
(kN) Load at 3rd cycle (kN) Result (%) Note
Compress
ion Tension Compression Tension Compression Tension Compression-Tension 1 Specimen 1 Interior 142,30 135,70 114,80 99,30 80,60>75,0 72,17< 75,0 Compression OK, Tension NOK
2 Specimen 2 Interior 142,30 135,70 114,80 99,30 80,60>75,0 72,17 < 75,0 Compression OK, Tension NOK
3 Specimen 3 Interior 134,70 126,90 114,10 89,00 85,0> 75,0 70,0<75,0 Compression OK, Tension NOK
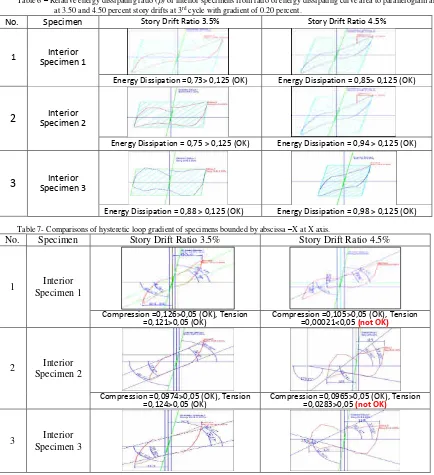
Table 6 – Relative energy dissipating ratio () of interior specimens from ratio of energy dissipating curve area to parallelogram area at 3.50 and 4.50 percent story drifts at 3rd cycle with gradient of 0.20 percent.
No. Specimen Story Drift Ratio 3.5% Story Drift Ratio 4.5%
1 Specimen 1 Interior
Energy Dissipation =0,73> 0,125 (OK) Energy Dissipation = 0,85> 0,125 (OK)
2
Specimen 2 InteriorEnergy Dissipation = 0,75 > 0,125 (OK) Energy Dissipation = 0,94 > 0,125 (OK)
3
Specimen 3 InteriorEnergy Dissipation = 0,88 > 0,125 (OK) Energy Dissipation = 0,98 > 0,125 (OK)
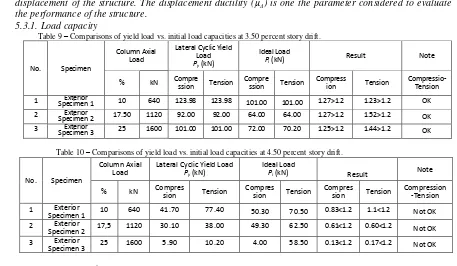
Table 7- Comparisons of hysteretic loop gradient of specimens bounded by abscissa –X at X axis.
No. Specimen Story Drift Ratio 3.5% Story Drift Ratio 4.5%
1 Interior
Specimen 1
Compression =0,126>0,05 (OK), Tension
=0,121>0,05 (OK) Compression =0,105>0,05 (OK), Tension =0,00021<0,05 (not OK)
2 Interior
Specimen 2
Compression =0,0974>0,05 (OK), Tension
=0,124>0,05 (OK) Compression =0,0965>0,05 (OK), Tension =0,0283>0,05 (not OK)
3 Interior
Compression=0,0735>0,05 (OK),
Tension=0,068>0,05 (OK) Compression=0,0849>0,05 (OK), Tension=0,0525>0,05 (OK)
Gradient Value
5.1.3.Structural ductility
Table 8 – Summary of ductility of interior specimens.
No. Specimen Ductility at Story Drift 3.50 % Ductility at Story Drift 4.50 % Note
5.3.The structural ductility analysis is obtained from the maximum lateral displacement divided by the initial displacement of the structure. The displacement ductility (μΔ) is one the parameter considered to evaluate the performance of the structure.
5.3.1.Load capacity
Table 9 – Comparisons of yield load vs. initial load capacities at 3.50 percent story drift.
No. Specimen
Table 10 – Comparisons of yield load vs. initial load capacities at 4.50 percent story drift.
No. Specimen
% kN Compression Tension Compression Tension Compression Tension Compression-Tension
1 Exterior
Table 11 – Ultimate capacities of specimens to resist lateral load at 3.50 percent story drift. No. Specimen
Table 12 – Ultimate capacities of specimens to resist lateral load at 4.50 percent story drift.
No. Specimen
Maximum load
(kN) Load at 3rd cycle (kN) Result (%) Note
Compress
1 Specimen 1 Exterior 51.60 86.00 24.80 42.60 48.06<75.0 72.17< 75.0 Compression-Tension NOK
2 Specimen 2 Exterior 49.30 66.20 19.80 7.60 40.16<75.0 72.17 < 75.0 Compression-Tension NOK
3 Specimen 3 Exterior 45.60 60.20 -38.00 11.50 -83.33<75. 70.00<75.0 Compression-Tension NOK
Table 13 – Relative energy dissipating ratio () of exterior specimens from ratio of energy dissipating curve area to parallelogram area at 3.50 and 4.50 percent story drifts at 3rd cycle with gradient of 0.20 percent.
No. Specimen Story Drift Ratio 3.5% Story Drift Ratio 4.5%
1 Exterior
Specimen 1
Energy Dissipation =0,91> 0,125 (OK) Energy Dissipation = 0,95> 0,125 (OK)
2 Exterior
Specimen 2
Energy Dissipation = 0,97> 0,125 (OK) Energy Dissipation = 0,99> 0,125 (OK)
3 Exterior
Specimen 3
Energy Dissipation = 0,99> 0,125 (OK) Energy Dissipation = 1.00> 0,125 (OK)
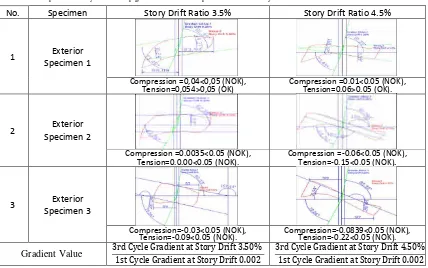
Table 14 – Comparisons of hysteretic loop gradient of exterior specimens bounded by abscissa –X and +X at X axis.
No. Specimen Story Drift Ratio 3.5% Story Drift Ratio 4.5%
1 Exterior
Specimen 1
Compression =0,04<0,05 (NOK),
Tension=0,054>0,05 (OK) Compression =0.01<0.05 (NOK), Tension=0.06>0.05 (OK).
2 Exterior
Specimen 2
Compression =0.0035<0.05 (NOK),
Tension=0.0.00<0.05 (NOK). Compression =-0.06<0.05 (NOK), Tension=-0.15<0.05 (NOK).
3 Exterior
Specimen 3
Compression=-0.03<0.05 (NOK),
Tension=-0.09<0.05 (NOK). Compression=-0.0839<0.05 (NOK), Tension=-0.22<0.05 (NOK).
Gradient Value
5.3.3.Structural ductility
Table 15 – Summary of ductility of exterior specimens.
Compression Tension Compression Tension requirements due to the lateral cyclic loading, it is recommended to increase the compression reinforcement area (As) at the support of the beam or near the beam-column joint.
Acknowledgements
The first phase of the multiyear research project, that involved an experimental work, has been conducted in the Structural Laboratory at Center of Research and Settlement Development, Ministry of Public Works, Bandung. The authors express their sincere gratitude for all the support received.
References
[1] Naaman Antoine. E, “Prestressed Concrete Analysis and Design”, McGrow-Hill Book Company, New York, San Francisco,Auckland, Bogota, Hamburg, Johannesburg, London, Madrid, atc. 1982
[2] Park R and Thompson Kevin J, “Ductility of Prestressed and Partially Prestressed Concrete Beam Section”, PCI Journal VOl. 25, No. 2, March-April 1974, pp 46-70.
[3] SNI-2847 Committee, Structural Concrete Requirements for Buildings (SNI 2847:2013), National Standardization Board (BSN), Jakarta, Indonesia, 264.
[4] American Concrete Institute (ACI 318M-08),'Building Code Requirements for Structural Concrete and Commentary',First Printing,June 2008.
[5] Astawa, Raka, Tavio, “Ductile of Structure Framework of Earthquake Resistant of High Rise Building on Exterior Beam-Column Joint with the Partial Prestressed Concrete Bam-column Reinforced Concrete”, The 2nd International Conference on Rehabilitation and Maintenancein Civil Engineering Solo, March 8th-10th , 2012
[6] SNI-1726 Committee, Seismic-Resistant Design Code for Buildings (SNI 1726:2012), National Standardization Board (BSN), Jakarta, Indonesia, 2012, 138.
[7] NEHRP, 'Proposed Revision to Recommended Provisions for Seismic Regulation for Precast Concrete Structure', 1997.
[8]Raka, Tavio & Astawa, “Elements of Structure Joint of Partial Prestressed concrete Beam- Concrete Reinforcement Column, Earthquake Resistant and ductile on bearers Special Moment Frame System”, 1st Indonesian Structural Engineering and Material Symposium, 2011 [9]Raka, Tavio & Astawa, “Element Structure Model, Partial Prestressed Concrete Beam-Column Reinforced Concrete Connecting in the Story Building Framework of Earthquake Rsistant”,2ndInternational Conference on Applied Technology, Science&Arts (APTECS) ITS Surabaya, 2011.
[10] Astawa, Raka, Tavio, “Shear Behavior of Joint Partial Prestressed Concrete Beam-Column Reinforced Concrete of Ductile Frame Structure Building in a Scure Residents and for Settlement Environment, 4thInternational Conference on Applied Technology, Science & Arts (APTECS) ITS Surabaya, 2013
[11]Raka IGP,“Contribution a L’Etude du Comportement des Poutres Armees Precontraintes Par Fils Adherents Soumises a Des Chargements Cycliques” Desertasi Doktor, A L’Institut National Des Sciences Appliquees de Toulouse – France, 1982.
[12] Raka IGP, "Sectional ductility Circle Hollow Prestressed Piles Compaction Centrifugal results", Research Report, Department of Civil Engineering FTSP-ITS Surabaya, 1993
[13] Raka IGP, "Ductility of Rectangle Beam Section of Partially Pretention Prestressed Beam under limited Cilyc Loading”, 5th International Conference on Applied Technology, Science & Arts (APTECS) ITS Surabaya, 2014.
[14] Tavio, Budiantara I. N. & Kusuma B., 'Spline Nonparametric Regression Analysis of Stress-Strain Curve of Confined Concrete', Civil Engineering Dimension, 10(1), 2008, 14-27.
[15] Tavio, Suprobo P. & Kusuma B., 'Strength and Ductility Enhancement of Reinforced HSC Columns Confined with High-Strength Transverse Steel', Proceedings of the Eleventh East Asia-Pacific Conference on Structural Engineering & Construction (EASEC-11), Taipei, Taiwan, 2008.
[16] Tavio, Suprobo P. & Kusuma B., 'Ductility of Confined Reinforced Concrete Columns with Welded Reinforcement Grids', Proceedings of the International Conference Excellence in Concrete Construction through Innovation, London, UK, 2008.
[17] Pudjisuryadi P., Tavio & Suprobo P., 'Transverse Stress Distribution in Concrete Columns Externally Confined by Steel Angle Collars', Proceedings of the 2nd International Conference on Earthquake Engineering and Disaster Mitigation (ICEEDM-II), Surabaya, Indonesia, 2011.
[18] Pudjisuryadi P., Tavio & Suprobo P., 'Analytical Confining Model of Square Reinforced Concrete Columns using External Steel Collars', International Journal of ICT-aided Architecture and Civil Engineering, 1(1), 2014, 1-18.
[19] Achmad K., Suhardjono A. & Tavio, 'Experimental Behavior of Seismic-Resistant Structural RC Columns Retrofitted with CFRP as External Confinement', Journal of Integrated Technology, 1(1), 2013, 30-36.
[20] Tavio, Achmad K., Parmo & Sulistiawan A., 'Strength and Ductility of RC Columns Retrofitted by FRP under Cyclic Loading', Proceedings of the 4th International Conference on Applied Technology, Science, and Arts (APTECS-IV), Surabaya, Indonesia, 2013.
[22] Tavio, 'Building Code Requirements for Structural Concrete (ACI 318-08) and Commentary (ACI 318R-08) ', Discussion and Closure, Concrete International, American Concrete Institute (ACI), 30(4), 2008, 1-171.
[23] Naaman Antoine E, Siriaksorn A, “Analysis and Design of Partially Prestressed to Statisfy Serviceability Criteria”, A Study Report by a Research Fellowship Award from tht Prestressed Concrete Institute and by the University of Illionis, Chicago, 1978