Visual Modeling with Rational Rose 2000 and UML TERRY QUATRANI
Publisher: Addison Wesley
Second Edition October 19, 1999 ISBN: 0-201-69961-3, 288 pages
The Unified Modeling Language (UML) offers standard semantics and notation for describing object structure and behavior and has emerged as the design medium of choice for developing large-scale distributed object applications. Augmented by the Rational Unified Process, an extensive set of software development guidelines, and the Rational Rose visual modeling tool, the UML greatly facilitates the development of quality object-oriented applications that meet both deadlines and requirements.
Visual Modeling with Rational Rose 2000 and UML is a comprehensive introduction and tutorial providing guidance on how to use a tool (Rational Rose 2000), a process (the Rational Unified Process), and a language (the UML) to successfully visualize, specify, document, and construct a software system. Written by the Rose Evangelist at Rational Software Corporation, a leader in UML and object technology, this book breaks the technology down to its essentials and provides clear explanations of each element. It follows a simplified version of the Rational Unified Process from project inception through system analysis and design. A sample case study running throughout the book illustrates this iterative development process, the UML in practice, and the application of Rational Rose. New appendices demonstrate code generation and reverse engineering using Rational Rose 2000 with the Visual C++, C++, and Visual Basic languages.
Topics covered include: • Creating use cases • Finding objects and classes • UML stereotypes and packages
• Scenarios, sequence diagrams, and collaboration diagrams • Discovering object interaction
• Specifying relationships, association, and aggregation • Adding behavior and structure
• Superclass/subclass relationships and inheritance • Object behavior and Harel state transition diagrams • Checking for model consistency
• Specifying, visualizing, and documenting system architecture • The iteration planning process
Many of the designations used by manufacturers and sellers to distinguish their products are claimed as trademarks. Where those designations appear in this book, and Addison-Wesley was aware of a trademark claim, the designations have been printed in initial caps or all caps.
The author and publishers have taken care in the preparation of this book, but make no expressed or implied warranty of any kind and assume no responsibility for errors or omissions. No liability is assumed for incidental or consequential damages in connection with or arising out of the use of the information or programs contained herein.
The publisher offers discounts on this book when ordered in quantity for special sales. For more information, please contact: Corporate, Government, and Special SalesAddison Wesley Longman, Inc.,One Jacob WayReading, Massachusetts 01867(781) 944-3700
Pearson Education Corporation Sales Division One Lake Street
Upper Saddle River, NJ 07458
(800) 382-3419
Visit AW on the Web: http://www.awl.com/cseng/ Library of Congress Cataloging-in-Publication Data
Quatrani, Terry.
Visual modeling with Rational Rose 2000 and UML / Terry Quatrani.—Rose 2000 ed.
p.cm.
Rev. ed. of: Visual modeling with Rational Rose and UML. 1998. ISBN 0-201-69961-3
1. Visual programming (Computer science) 2. Object-orientedmethods (Computer science) 3. UML (Computer science) I. Quatrani, Terry.Visual modeling with Rational Rose and UML. II. Title.QA76.65.Q38 1999
005.1'17—dc21 99-44733
CIP
Copyright © 2000 by Addison Wesley Longman, Inc.
All rights reserved. No part of this publication may be reproduced, or stored in a retrieval system, or transmitted, in any form, or by any other means, electronic, mechanical, photocopying, recording, or otherwise, without the prior consent of the publisher.
Printed in the United States of America. Printed simultaneously in Canada. Executive Editor: J. Carter Shanklin
Editorial Assistant: Kristin Erickson
Production Coordinator: Jacquelyn Doucette
Cover Design: Simone R. Payment
Compositor: Pre-Press Co., Inc.
Text printed on recycled and acid-free paper.
6 7 8 9 1011 CRS 04 03 02 01
Foreword Preface Approach Chapter Summaries Acknowledgments 1. Introduction
What is Visual Modeling
The Triangle For Success
The Role of Notation
History of the UML
The Role of Process
What is Iterative and Incremental Development
The Rational Unified Process
The Rational Rose Tool
Summary
2. Beginning a Project
Defining the Right Project
Eastern State University (ESU) Background
Risks for the Course Registration Problem
ESU Course Registration Problem Statement
Summary
3. Creating Use Cases
System Behavior
Actors
Use Cases
Use Case Relationships
Use Case Diagrams
Activity Diagrams
Summary 4. Finding Classes
What is an Object?
State, Behavior, and Identity
What is a Class?
Stereotypes and Classes
Discovering Classes
Documenting Classes
Packages
Objects and Classes in the ESU Course Registration Problem
Class Diagrams
Summary
5. Discovering Object Interaction
Use Case Realization
Documenting Scenarios
Sequence Diagrams
Sequence Diagrams And Boundary Classes
Complexity And Sequence Diagrams
Collaboration Diagrams
Why Are There Two Different Diagrams?
Summary
6. Specifying Relationships
The Need for Relationships
Association Relationships
Aggregation Relationships
Association or Aggregation?
Naming Relationships Role Names Multiplicity Indicators Reflexive Relationships Finding Relationships Package Relationships Summary
7. Adding Behavior and Structure
Representing Behavior and Structure
Creating Operations
Documenting Operations
Relationships and Operation Signatures
Creating Attributes
Documenting Attributes
Displaying Attributes and Operations
Association Classes
Summary
8. Discovering Inheritance
Inheritance
Generalization
Specialization
Inheritance Trees
Single Inheritance Versus Multiple Inheritance
Inheritance Versus Aggregation
Summary
9. Analyzing Object Behavior
Modeling Dynamic Behavior
States
State Transitions
Special States
State Transition Details
State Details
Summary
10. Checking the Model
The Need For Architecture
The Architecture Team
The 4 + 1 View Of Architecture
The Logical View
The Implementation View
The Process View
The Deployment View
The Use Case View
Summary
12. Building the Iterations
The Iteration Planning Process
Designing The User Interface
Adding Design Classes
The Emergence Of Patterns
Designing Relationships
Designing Attributes And Operations
Designing For Inheritance
Coding, Testing, And Documenting The Iteration
Using Reverse Engineering To Set The Stage For The Next Iteration
Summary
A. Code Generation and Reverse Engineering with C++
Code Generation Steps
Reverse Engineering Steps
Code Generation
Step 2: Create Body Components in the Component Diagram
Step 3: Assign the C++ Language to the Components
Step 4: Assign Classes to Components
Step 5: Attach Property Sets to Modeling Elements
Step 6: Select the Components and Generate the Code
Step 7: Evaluate the Code Generation Errors
Reverse Engineering using the C++ Analyzer
Step 2: Add Project Caption
Step 3: Add Referenced Libraries and Base Projects
Step 4: Set the File Type and Analyze the Files
Step 5: Evaluate the Errors
Step 6: Select Export Options and Export to Rose
Step 7: Update Rose Model
B. Code Generation and Reverse Engineering with Visual C++ and Visual Basic
Code Generation Steps
Reverse Engineering Steps
code generation
Step 5: Evaluate the Code Generation Errors
Reverse Engineering
Step 2: Evaluate the Errors C. A Visual Basic Example
Make an activex dll
Foreword
Edward Tufte in his seminal work, The Visual Display of Quantitative Information, notes that "graphics reveal data." What he means by this statement is that certain complex sets of data, when visualized graphically, convey far more information to the reader than the raw data itself. So it is with software; as our industry continues to develop systems of greater and greater complexity our ability to manage that complexity follows our ability to visualize our systems above the level of their raw lines of code. Indeed, the market success of languages such as Visual Basic (for which there are more developers than any other programming language, even COBOL) and visual front ends to C++ and Java point out that visualization is essential to the development of complex systems. With the advent of distributed and concurrent systems of all kinds, and especially of web-based systems, the need for visualization of software has never been greater.
As Terry Quatrani writes, her book is "an introduction to the concepts needed to visualize a software system—a process, a notation, and a modeling tool." As I said in the foreword to Terry's first edition, it's clear that these three key components of software development continue to mature and multiply. Today, developers have an even wider range of tools to assist in every aspect of the software development process than they had just two years ago. Furthermore, standards in methods, languages, and tools have begun to emerge and gain widespread adoption, allowing the industry to focus cycle time on actually developing and deploying complex software systems, rather than being distracted by the method wars of the past. Though much debate still continues over languages, I have been privileged to participate in this ongoing process of standardization, not only in the development of the Unified Modeling Language (UML) but recently in the move towards a standard development process initiated, as was UML, within Rational Software. It's been gratifying to see the widespread industry support and acceptance of the UML and the growing popularity of Rational Rose, the Rational Suites, and now the Rational Unified Process. As our industry faces the challenges of building large-scale distributed object applications, the use of common tools and methods and industry-wide standards offers the promise of achieving the true interoperability and reuse of software long sought.
Terry has been working with Rational Rose and the UML almost from its inception. Her knowledge and experience of methods is extensive, and she has been a driving force in the training and mentoring of Rational's customers on the use of the UML. This book is an extension of her everyday work and clearly reflects her pragmatic knowledge of these subjects and the insights that she has gained from working on a multitude of complex software systems. Developers seeking guidance in visualizing a software system will learn from Terry how to specify, visualize, document, and create a software solution using the industry's leading tools and methods, all expressed in standard notation. I've enjoyed the benefits of Terry's experience and insight for years; I know you will too.
Preface
Goals
TWO YEARS AGO, when I set out to write the first version of this book, I thought, "This should be pretty easy … I do this for a living." Boy, was I wrong! Putting into words what I do on a daily basis was one of the hardest things I have ever done (all right, childbirth was more painful, but not by much). But I persevered, spent many, many nights and weekends in front of my computer, and gave birth to Visual Modeling with Rational Rose and UML. I must admit that the first time I saw my book on the bookshelf at a local bookstore, I was thrilled. I also found out that you need to have very thick skin to read book reviews. My book is unique since people seem to love it (5 stars) or they are less than impressed with it (1 star). For some reason, I rarely get a rating in between.
As I write the second version of my book, I would like to address the two camps of reviewers. First of all, to the people who love it, I thank you. It is really nice to have someone say "Good job, I really learned from your book." When I was giving a seminar in New York a gentleman came up to me, holding my book, and said, "Thank you, this book has been a lifesaver." That made my day; in fact, I think it made my week. These people have truly understood the goal of my book: to be a simple introduction to the world of visual modeling.
Now for the people who have been less than impressed: You will probably not like this version either. I say this since the goal of the book has not changed. It is not a complete guide to the UML (these books have been written by Grady and Jim and I am not even going to attempt to compete with the definitive experts). It is not a complete guide to the Rational Unified Process (these books have been written, quite nicely, by Philippe and Ivar). It is not even a good book on C++ (in fact, I usually tell people that I no longer write code for a living, and there is a very good reason that I don't). As I stated, this book is meant to take a simple, first look at how a process, a language, and a tool may be used to create a blueprint of your system.
Approach
THIS BOOK TAKES a practical approach to teaching visual modeling techniques and the UML. It uses a case study to show the analysis and design of an application. The application is a course registration system for a university. This problem domain was chosen because it is understood easily and is not specific to any field of computer science. You can concentrate on the specifics of modeling the domain rather than investing time in understanding an unfamiliar problem domain.
For additional details on visual modeling and the UML or on applying the techniques to your application, you should consider the training and mentoring services offered by Rational Software Corporation. Rational Software Corporation may be contacted at 2800 San Tomas Expressway, Santa Clara, CA 95051, 1-800-767-3237. You may send e-mail to Rational at [email protected]. You can also visit the Rational website at http://www.ration-al.com.
Chapter Summaries
THE ORDERING AND number of chapters in this version of the book have not been changed, but the content of most of the chapters has been updated. The screen shots and Rational Rose instructions have been changed so they reflect what you will see with Rational Rose 2000. The biggest wording changes may be found in Chapters 5 and 11. InChapter 5, "Discovering Object Interaction," sequence diagrams and collaboration diagrams are now stored in the Logical View of the tool. I have done this so my scaled-down process is more in line with the Rational Unified Process.Chapter 11, "Architecture," has been updated to show the current icon for a component along with the use of lollypop notation for interface classes. I also have included additional appendixes that show how to use Rational Rose with both Visual Basic and Visual C++.
Chapter 1: Introduction
Introduces the techniques, language, and process that are used throughout the book. This chapter discusses the benefits of visual modeling, the history of the UML, and the software development process used.
Chapter 2: Beginning a Project
Contains information that is related to the Course Registration System case study that is used throughout the book.
Chapter 3: Creating Use Cases
Discusses the techniques used to examine system behavior from a use-case approach.
Chapter 4: Finding Classes
Discusses the concepts and notations used for finding objects and classes. This chapter also discusses the UML concepts of stereotypes and packages.
Chapter 5: Discovering Object Interaction
Chapter 6: Specifying Relationships
Illustrates the definition of relationships between classes in the system. Specifically, the concepts of association and aggregation are explored.
Chapter 7: Adding Behavior and Structure
Shows how the needed structure and behavior of classes are added to the model under development.
Chapter 8: Discovering Inheritance
Illustrates the application of generalization and specialization principles to discover superclass/subclass relationships.
Chapter 9: Analyzing Object Behavior
Uses Harel state transition diagrams to provide additional analysis techniques for classes with significant dynamic behavior.
Chapter 10: Checking the Model
Discusses techniques used to blend and check models for consistency. These techniques are needed when different teams are working on a single project in parallel.
Chapter 11: Designing the System Architecture
Contains an introduction to the concepts and notation needed to specify and document the system architecture. This chapter is not meant to be a tell-all process guide to the development of the architecture—it is meant to be a guide to the notation and process used to specify, visualize, and document the system architecture. It is placed at this point in the structure of the book since the architectural decisions specified in this chapter must be made prior to the information contained in later chapters.
Chapter 12: Building the Iterations
Discusses the iteration planning process. It also looks at the UML notation used to specify and document the design decisions that occur during the implementation of an iteration. The chapter does not focus on good (or bad) design decisions—it looks at the process and notations used to capture the design of an iteration.
Appendix A: Code Generation and Reverse Engineering with C++
Appendix B: Code Generation and Reverse Engineering with Visual C++ and Visual Basic
Provides step-by-step guides to code generation and reverse engineering using Rational Rose 2000 and the Visual C++ and Visual Basic languages.
Appendix C: A Visual Basic Example
Provides a step-by-step demonstration showing how to create and reuse a Visual Basic DLL.
Glossary
Acknowledgments
I WOULD LIKE to thank a number of individuals for their contributions to the content, style, presentation, and writing of this book.
Special thanks to the following people:
Chapter 1. Introduction
• What Is Visual Modeling?
• The Triangle for Success
• The Role of Notation
• History of the UML
• The Role of Process
• What Is Iterative and Incremental Development?
• The Rational Unified Process
• The Rational Rose Tool
• Summary
What is Visual Modeling
Visual Modeling is a way of thinking about problems using models organized around real-world ideas. Models are useful for understanding problems, communicating with everyone involved with the project (customers, domain experts, analysts, designers, etc.), modeling enterprises, preparing documentation, and designing programs and databases. Modeling promotes better understanding of requirements, cleaner designs, and more maintainable systems.
Models are abstractions that portray the essentials of a complex problem or structure by filtering out nonessential details, thus making the problem easier to understand. Abstraction is a fundamental human capability that permits us to deal with complexity. Engineers, artists, and craftsmen have built models for thousands of years to try out designs before executing them. Development of software systems should be no exception. To build complex systems, the developer must abstract different views of the system, build models using precise notations, verify that the models satisfy the requirements of the system, and gradually add detail to transform the models into an implementation. We build models of complex systems because we cannot comprehend such systems in their entirety. There are limits to the human capacity to understand complexity. This concept may be seen in the world of architecture. If you want to build a shed in your backyard, you can just start building; if you want to build a new house, you probably need a blueprint; if you are building a skyscraper, you definitely need a blueprint. The same is true in the world of software. Staring at lines of source code or even analyzing forms in Visual Basic does little to provide the programmer with a global view of a development project. Constructing a model allows the designer to focus on the big picture of how a project's components interact, without having to get bogged down in the specific details of each component.
visualize, understand, and create complex things. They are used to help us meet the challenges of developing software today and in the future.
The Triangle For Success
I have often used the triangle for success as shown in Figure 1-1 to explain the components needed for a successful project. You need all three facets—a notation, a process, and a tool. You can learn a notation, but if you don't know how to use it (process), you will probably fail. You may have a great process, but if you can't communicate the process (notation), you will probably fail. And lastly, if you cannot document the artifacts of your work (tool), you will probably fail.
Figure 1-1. Triangle for Success
The Role of Notation
Notation plays an important part in any model—it is the glue that holds the process together. ?Notation has three roles:
• It serves as the language for communicating decisions that are not obvious or cannot be inferred from the code itself.
• It provides semantics that are rich enough to capture all important strategic and tactical decisions.
• It offers a form concrete enough for humans to reason and for tools to manipulate.?[1]
[1]
The Unified Modeling Language (UML) provides a very robust notation, which grows from analysis into design. Certain elements of the notation (for example, classes, associations, aggregations, inheritance) are introduced during analysis. Other elements of the notation (for example, containment implementation indicators and properties) are introduced during design.
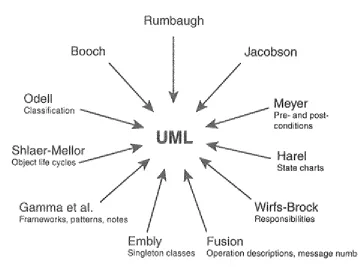
History of the UML
During the 1990s many different methodologies, along with their own set of notations, were introduced to the market. Three of the most popular methods were OMT (Rumbaugh), Booch, and OOSE (Jacobson). Each method had its own value and emphasis. OMT was strong in analysis and weaker in the design area. Booch 1991 was strong in design and weaker in analysis. Jacobson was strong in behavior analysis and weaker in the other areas.
As time moved on, Booch wrote his second book, which adopted a lot of the good analysis techniques advocated by Rumbaugh and Jacobson, among others. Rumbaugh published a series of articles that have become known as OMT-2 that adopted a lot of the good design techniques of Booch. The methods were beginning to converge but they still had their own unique notations. The use of different notations brought confusion to the market since one symbol meant different things to different people. For example, a filled circle was a multiplicity indicator in OMT and an aggregation symbol in Booch. You will hear the term "method wars" being used to describe this period of time—is a class a cloud or a rectangle? Which one is better?
Figure 1-2. UML Inputs
[2] [2]
The Unified Method, Draft Edition (0.8). Rational Software Corporation, October, 1995.
The UML is an attempt to standardize the artifacts of analysis and design: semantic models, syntactic notation, and diagrams. The first public draft (version 0.8) was introduced in October 1995. Feedback from the public and Ivar Jacobson's input were included in the next two versions (0.9 in July 1996 and 0.91 in October 1996). Version 1.0 was presented to the Object Management Group (OMG) for standardization in July 1997. Additional enhancements were incorporated into the 1.1 version of UML, which was presented to the OMG in September 1997. In November 1997, the UML was adopted as the standard modeling language by the OMG.
The Role of Process
A successful development project satisfies or exceeds the customer's expectations, is developed in a timely and economical fashion, and is resilient to change and adaptation. The development life cycle must promote creativity and innovation. At the same time, the development process must be controlled and measured to ensure that the project is indeed completed. "Creativity is essential to the crafting of all well-structured object-oriented architectures, but developers allowed completely unrestrained creativity tend to never reach closure. Similarly, discipline is required when organizing the efforts of a team of developers, but too much discipline gives birth to an ugly bureaucracy that kills all attempts at innovation.[3] " A well-managed iterative and incremental life cycle provides the necessary control without affecting creativity.
What is Iterative and Incremental Development
In an iterative and incremental life cycle (Figure 1-3), development proceeds as a series of iterations that evolve into the final system. Each iteration consists of one or more of the following process components: business modeling, requirements, analysis, design, implementation, test, and deployment. The developers do not assume that all requirements are known at the beginning of the life cycle; indeed change is anticipated throughout all phases.
Figure 1-3. Iterative and Incremental Development
This type of life cycle is a risk-mitigating process. Technical risks are assessed and prioritized early in the life cycle and are revised during the development of each iteration. Risks are attached to each iteration so that successful completion of the iteration alleviates the risks attached to it. The releases are scheduled to ensure that the highest risks are tackled first. Building the system in this fashion exposes and mitigates the risks of the system early in the life cycle. The result of this life cycle approach is less risk coupled with minimal investment.? [3]
[3] More information on the application of an iterative and incremental approach to software development may be found
in the article "A Rational Development Process" by Philippe Kruchten, CrossTalk, 9(7), July 1996, pp. 11-16. This paper is also available on the Rational web site: http://www.rational.com
The Rational Unified Process
Control for an iterative and incremental life cycle is supported by employing the Rational Unified Process—an extensive set of guidelines that address the technical and organizational aspects of software development focusing on requirements analysis and design.
The Rational Unified Process is structured along two dimensions:
• Time—division of the life cycle into phases and iterations
Both dimensions must be taken into account for a project to succeed.
Structuring a project along the time dimension involves the adoption of the following time-based phases:
• Inception—specifying the project vision
• Elaboration—planning the necessary activities and required resources; specifying the features and designing the architecture
• Construction—building the product as a series of incremental iterations
• Transition—supplying the product to the user community (manufacturing, delivering, and training)
Structuring the project along the process component dimension includes the following activities:
• Business Modeling—the identification of desired system capabilities and user needs
• Requirements—a narration of the system vision along with a set of functional and nonfunctional requirements
• Analysis and Design—a description of how the system will be realized in the implementation phase
• Implementation—the production of the code that will result in an executable system
• Test—the verification of the entire system
• Deployment—the delivery of the system and user training to the customer
Figure 1-4 shows how the process components are applied to each time-based phase.
Each activity of the process component dimension typically is applied to each phase of the time-based dimension. However, the degree to which a particular process component is applied is dependent upon the phase of development. For example, you may decide to do a proof of concept prototype during the Inception Phase, and thus, you will be doing more than just capturing requirements (you will be doing the analysis, design, implementation, and test needed to complete the prototype). The majority of the analysis process component occurs during the Elaboration Phase. However, it is also advisable to complete the first few iterations of the system during this phase. These first few iterations typically are used to validate the analysis decisions made for the architecture of the system. Hence, you are doing more than just analyzing the problem. During the Construction Phase of development, the system is completed as a series of iterations. As with any type of development structure, things always crop up as the system is built; thus, you are still doing some analysis.
The diagram is meant to be a guideline for the life cycle of your project. The main point is if you are still trying to figure out what you are supposed to be building as you are writing the code, you are probably in trouble. You should also note that testing is applied throughout the iteration process—you do not wait until all the code is done to see if it all works together!
This book uses a simplified version of the Rational Unified Pro-cess, which concentrates on the use of the UML to capture and document the decisions made during the Inception and Elaboration phases of development. The last few chapters lightly cover construction of the system. Although testing is a very integral part of system development, it is beyond the scope of this book.
Any software development method is best supported by a tool. When I first started OO modeling, my tool was paper and a pencil, which left a lot to be desired. There are many tools on the market today— everything from simple drawing tools to sophisticated object modeling tools. This book makes use of the tool Rational Rose. At every step, there is a description of how to use Rational Rose to complete the step. The Rational Rose product family is designed to provide the software developer with a complete set of visual modeling tools for development of robust, efficient solutions to real business needs in the client/server, distributed enterprise, and real-time systems environments. Rational Rose products share a common universal standard, making modeling accessible to nonprogrammers wanting to model business processes as well as to programmers modeling applications logic. An evaluation version of the Rational Rose tool may be obtained at the Rational Software Corporation website at www.rational.com.
Although this book uses the Rational Rose tool, a subset of the diagrams are available in the Microsoft Visual Modeler tool. Microsoft Visual Modeler is the entry-level product, designed specifically for the first-time modeler. The tool provides the capability to
• Identify and design business objects, and then map them to software components
• Partition services across a three-tiered service model
• Design how components will be distributed across a network
• Generate Visual Basic code frameworks directly from your model
• Use reverse engineering to create models from existing components and applications
• Use round-trip engineering facilities to keep your designs synchronized with your code
Rational Rose extends Visual Modeler for dynamic behaviors, such as business requirements analysis, business scenario analysis with sequence and collaboration diagrams, state modeling, additional code generation capabilities for DDL and IDL, along with the inclusion of a scripting language to provide access to the Rose domain.
Summary
Visual modeling is a way of thinking about problems using models organized around real-world ideas. Models are useful for understanding problems, communication, modeling enterprises, preparing documentation, and designing programs and databases. Modeling promotes better understanding of requirements, cleaner designs, and more maintainable systems. Notation plays an important part in any model—it is the glue that holds the process together. The Unified Modeling Language (UML) provides a very robust notation, which grows from analysis into design.
A successful development project satisfies or exceeds the customer's expectations, is developed in a timely and economical fashion, and is resilient to change and adaptation. The development life cycle must promote creativity and innovation. A well-managed iterative and incremental life cycle provides the necessary control without affecting creativity. In an iterative and incremental development life cycle, development proceeds as a series of iterations that evolve into the final system. Each iteration consists of one or more of the following process components: business modeling, requirements, analysis, design, implementation, test, and deployment.
Control for an iterative and incremental life cycle is provided in the Rational Unified Process—an extensive set of guidelines that address the technical and organizational aspects of software development, focusing on requirements analysis and design. This book uses a simplified version of the Rational Unified Process.
Chapter 2. Beginning a Project
• Defining the Right Project
• Eastern State University (ESU) Background
• Risks for the Course Registration Problem
• ESU Course Registration Problem Statement
• Summary
Defining the Right Project
The most important question to ask when developing a system is not a methodological question. It is not a technical question. It is a seemingly simple, yet remarkably difficult question: "Is this the right system to make?" Unfortunately, this question is often never asked nor answered. Although misguided methodology or technically tough problems can cause projects to fail, sufficient resources and heroic effort by talented people often can save them. But nothing can save a system that is not needed or that automates the wrong thing.
Before starting a project, there must be an idea for it. The process of coming up with an idea for a system along with a general idea of its requirements and form occurs during the Inception Phase. It finishes the statement: "The system we want does …" During this phase of development, a vision for the idea is established, and many assumptions are either validated or rejected. Activities that occur involve the solicitation of ideas, the preliminary identification of risks, the identification of external interfaces, the identification of the major functionality that must be provided by the system, and possibly some "proof of concept" prototypes. Ideas come from many sources: customers, domain experts, other developers, industry experts, feasibility studies, and review of existing systems. It is important to note that any prototyping done during this phase should be considered throw-away code since the code generated is merely to support a list of assumptions and has not been fully analyzed or designed.
The process used during this phase of development can be done formally or informally, but it always involves considering the business needs, the available resources, the possible technology, and the user-community desires along with several ideas for new systems. Brainstorming, research, trade studies, cost-benefit analysis, use case analysis, and prototyping can then be performed to produce the target system's concept along with defined purposes, priorities, and context. Usually, a first-pass cut at resource and schedule planning is also done during this phase. For some projects, the product vision can be sketched on the back of a napkin. For others, the product vision may be a formal phase that is iteratively performed until enough level of detail of the target system has been specified.
An adequate Inception Phase establishes the high-level requirements for a desirable and feasible system, both technologically and sociologically. An inadequate Inception Phase leads to systems so unwanted, expensive, impossible, and ill-defined that they are typically never finished or used.
Eastern State University (ESU) Background
The ESU course registration problem will be used as an example throughout this book.
The process of assigning professors to courses and the registration of students is a frustrating and time-consuming experience.
professors indicating which courses they will teach. A course catalog is printed and distributed to the students.
The students currently fill out (mulitpart, multicolor) registration forms that indicate their choice in courses, and return the completed forms to the Registrar's office. The typical student load is four courses. The staff of the Registrar's office then enters the students' forms into the mainframe computer system. Once the students' curriculum for the semester has been entered, a batch job is run overnight to assign students to courses. Most of the time the students get their first choice; however, in those cases where there is a conflict, the Registrar's office talks with each student to get additional choices. Once all the students have been successfully assigned to courses, a hard copy of the students' schedule is sent to the students for their verification. Most student registrations are processed within a week, but some exceptional cases take up to two weeks to solve.
Once the initial registration period is completed, professors receive a student roster for each course they are scheduled to teach.
Risks for the Course Registration Problem
The Development Team identified that the major risk to the system involved the ability to store and access the curriculum information efficiently. They developed several prototypes that evaluated data storage and access mechanisms for each database management system under consideration. The results of the prototypes led to the decision that the database risk could be mitigated. Additional prototypes were also developed to study the hardware needs for the university as a result of moving to an online registration system.
ESU Course Registration Problem Statement
At the beginning of each semester, students may request a course catalog containing a list of course offerings for the semester. Information about each course, such as professor, department, and prerequisites will be included to help students make informed decisions.
The new system will allow students to select four course offerings for the coming semester. In addition, each student will indicate two alternative choices in case a course offering becomes filled or canceled. No course offering will have more than ten students or fewer than three students. A course offering with fewer than three students will be canceled. Once the registration process is completed for a student, the registration system sends information to the billing system so the student can be billed for the semester. Professors must be able to access the online system to indicate which courses they will be teaching, and to see which students signed up for their course offerings.
For each semester, there is a period of time that students can change their schedule. Students must be able to access the system during this time to add or drop courses.
Summary
Chapter 3. Creating Use Cases
• System Behavior
• Actors
• Use Cases
• Use Case Relationships
• Use Case Diagrams
• Activity Diagrams
• Summary
System Behavior
The behavior of the system under development (i.e., what functionality must be provided by the system) is documented in a use case model that illustrates the system's intended functions (use cases), its surroundings (actors), and relationships between the use cases and actors (use case diagrams). The most important role of a use case model is one of communication. It provides a vehicle used by the customers or end users and the developers to discuss the system's functionality and behavior.
The use case model starts in the Inception Phase with the identification of actors and principal use cases for the system. The model is then matured in the Elaboration Phase— more detailed information is added to the identified use cases, and additional use cases are added on an as-needed basis.
Actors
Actors are not part of the system—they represent anyone or anything that must interact with the system. An actor may
• Only input information to the system
• Only receive information from the system
• Input and receive information to and from the system
Typically, these actors are found in the problem statement and by conversations with customers and domain experts. The following questions may be used to help identify the actors for a system:
• Who is interested in a certain requirement?
• Where in the organization is the system used?
• Who will benefit from the use of the system?
• Who will support and maintain the system?
• Does the system use an external resource?
• Does one person play several different roles?
• Do several people play the same role?
• Does the system interact with a legacy system?
In the UML, an actor is represented as a stickman, as shown in Figure 3-1.
Figure 3-1. UML Notation for an Actor
What Constitute a "Good" Actor?
Care must be taken when identifying the actors for a system. This identification is done in an iterative fashion—the first cut at the list of actors for a system is rarely the final list. For example, is a new student a different actor than a returning student? Suppose you initially say the answer to this question is yes. The next step is to identify how the actor interacts with the system. If the new student uses the system differently than the returning student, they are different actors. If they use the system in the same way, they are the same actor.
Another example is the creation of an actor for every role a person may play. This may also be overkill. A good example is a teaching assistant in the ESU Course Registration System. The teaching assistant takes classes and teaches classes. The capabilities needed to select courses to take and to teach are already captured by the identification of functionality needed by the Student and the Professor actors. Therefore, there is no need for a Teaching Assistant actor.
By looking at the identified actors and documenting how they use the system, you will iteratively arrive at a good set of actors for the system.
Actors in the ESU Course Registration System
The previous questions were answered as follows:
• Students want to register for courses
• The Registrar must create the curriculum and generate a catalog for the semester
• The Registrar must maintain all the information about courses, professors, and students
• The Billing System must receive billing information from the system
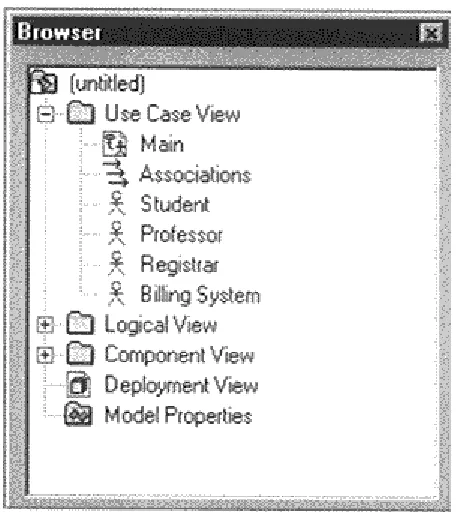
Based on the answers to the questions posed, the following actors have been identified: Student, Professor, Registrar, and the Billing System.
NOTE
1. Right-click on the Use Case View package in the browser to make the shortcut menu visible.
2. Select the New:Actor menu option. A new actor called New Class is placed in the browser.
3. With the actor called New Class selected, enter the desired name of the actor.
The Browser view of the actors for the ESU Course Registration System is shown in
Figure 3-2.
Figure 3-2. Actors
A brief description for each actor should be added to the model. The description should identify the role the actor plays while interacting with the system.
The actor descriptions for the ESU Course Registration System are:
• Student—a person who is registered to take classes at the University
• Professor—a person who is certified to teach classes at the University
• Registrar—the person who is responsible for the maintenance of the ESU Course Registration System
• Billing System—the external system responsible for student billing
NOTE
1. If the documentation window is not visible, open the documentation window by selecting the Documentation menu choice from the View menu.
2. Click to select the actor in the browser.
3. Position the cursor in the documentation window and enter the documentation.
The documentation for the Student actor is shown in Figure 3-3.
Figure 3-3. Student Actor Documentation
Use Cases
Use cases model a dialogue between an actor and the system. They represent the functionality provided by the system; that is, what capabilities will be provided to an actor by the system. The collection of use cases for a system constitute all the defined ways the system may be used. The formal definition for a use case is: A use case is a sequence of transactions performed by a system that yields a measurable result of values for a particular actor.
The following questions may be used to help identify the use cases for a system:
• What are the tasks of each actor?
• Will any actor create, store, change, remove, or read information in the system?
• Will any actor need to inform the system about sudden, external changes?
• Does any actor need to be informed about certain occurrences in the system?
• What use cases will support and maintain the system?
• Can all functional requirements be performed by the use cases? In the UML, a use case is represented as an oval, as shown in Figure 3-4.
Figure 3-4. UML Notation for a Use Case
What Constitutes a "Good" Use Case?
Over the years there has been a lot of discussion dealing with the "goodness" of a use case. One problem that I have encountered is the level of detail found in use cases. That is, how big (or how little) should they be? There is no one, right answer. The rule of thumb that I apply is the following:
A use case typically represents a major piece of functionality that is complete from beginning to end. A use case must deliver something of value to an actor.
For example, in the ESU Course Registration System, the student must select the courses for a semester, the student must be added to the course offerings, and the student must be billed. Is this three use cases, or just one? I would make it one because the functionality represents what happens from beginning to end. What good would the system be if a student was not added to the courses selected (or at least notified if the addition does not occur)? Or if the student was not billed (the University would not stay in business if all courses were free!)?
Another problem is how to bundle functionality that is different but seems to belong together. For example, the Registrar must add courses, delete courses, and modify courses. Three use cases or one use case? Here again, I would make one use case—the maintenance of the curriculum, since the functionality is started by the same actor (the Registrar) and deals with the same entities in the system (the curriculum).
Use Cases in the ESU Course Registration System
The following needs must be addressed by the system:
• The Student actor needs to use the system to register for courses.
• The Professor actor needs to use the system to select the courses to teach for a semester, and must be able to receive a course roster from the system.
• The Registrar is responsible for the generation of the course catalog for a semester, and for the maintenance of all information about the curriculum, the students, and the professors needed by the system.
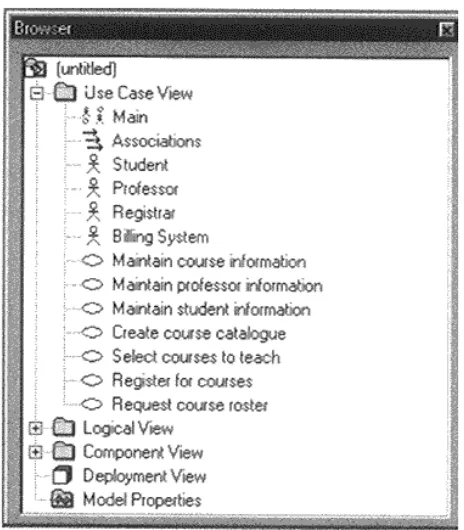
Based on these needs, the following use cases have been identified:
• Register for courses
• Select courses to teach
• Request course roster
• Maintain course information
• Maintain professor information
• Maintain student information
• Create course catalog
NOTE
1. Right-click on the Use Case View in the browser to make the shortcut menu visible.
2. Select the New:Use Case menu option. A new unnamed use case is placed in the browser.
3. With the use case selected, enter the desired name of the use case.
The browser view of the use cases for the ESU Course Registration System is shown in Figure 3-5.
Brief Description of a Use Case
The brief description of a use case states the purpose of the use case in a few sentences, providing a high-level definition of the functionality provided by the use case. This description typically is created during the Inception Phase as the use case is identified. The brief description of the Register for Courses use case is as follows:
• This use case is started by the Student. It provides the capability to create, modify, and/or review a student schedule for a specified semester.
NOTE
1. Click to select the use case in the browser.
2. Position the cursor in the documentation window and enter the brief description for the use case. If the documentation window is not visible, select the View:Documentation menu choice to make the window visible.
The brief description of the Register for Courses use case is shown in Figure 3-6.
The Flow of Events for a Use Case
Each use case also is documented with a flow of events. The flow of events for a use case is a description of the events needed to accomplish the required behavior of the use case. The flow of events is written in terms of what the system should do, not how the system does it. That is, it is written in the language of the domain, not in terms of implementation. The flow of events should include:
• When and how the use case starts and ends
• What interaction the use case has with the actors
• What data is needed by the use case
• The normal sequence of events for the use case
• The description of any alternate or exceptional flows
The flow of events documentation typically is created in the Elaboration Phase in an iterative manner. At first, only a brief description of the steps needed to carry out the normal flow of the use case (i.e., what functionality is provided by the use case) is written. As analysis progresses, the steps are fleshed out to add more detail. Finally, the exceptional flows are added to the use case (the what happens if... part of the flow of events).
Each project should use a standard template for the creation of the flow of events document. I have found the following template to be useful.
X Flow of Events for the <name> Use Case X.1 Preconditions
X.2 Main Flow
X.3 Subflows (if applicable) X.4 Alternative Flows
where X is a number from 1 to the number of use cases.
A sample completed Flow of Events document for the Select Courses to Teach use case follows.
1.1 Preconditions
The Create Course Offerings subflow of the Maintain Course Information use case must execute before this use case begins.
1.2 Main Flow
This use case begins when the Professor logs onto the Registration System and enters his/her password. The system verifies that the password is valid (E-1) and prompts the Professor to select the current semester or a future semester (E-2). The Professor enters the desired semester. The system prompts the Professor to select the desired activity: ADD, DELETE, REVIEW, PRINT, or QUIT.
If the activity selected is ADD, the S-1: Add a Course Offering subflow is performed. If the activity selected is DELETE, the S-2: Delete a Course Offering subflow is performed.
If the activity selected is REVIEW, the S-3: Review Schedule subflow is performed. If the activity selected is PRINT, the S-4: Print a Schedule subflow is performed. If the activity selected is QUIT, the use case ends.
1.3 Subflows
S-1: Add a Course Offering
The system displays the course screen containing a field for a course name and number. The Professor enters the name and number of a course (E-3). The system displays the course offerings for the entered course (E-4). The Professor selects a course offering. The system links the Professor to the selected course offering (E-5). The use case then begins again.
S-2: Delete a Course Offering
The system displays the course offering screen containing a field for a course offering name and number. The Professor enters the name and number of a course offering (E-6). The system removes the link to the Professor (E-7). The use case then begins again. S-3: Review a Schedule
The system retrieves (E-8) and displays the following information for all course offerings for which the Professor is assigned: course name, course number, course offering number, days of the week, time, and location. When the Professor indicates that he or she is through reviewing, the use case begins again.
S-4: Print a Schedule
The system prints the Professor schedule (E-9). The use case begins again.
1.4 Alternative Flows
E-1: An invalid professor ID number is entered. The user can re-enter a professor ID number or terminate the use case.
E-2: An invalid semester is entered. The user can re-enter the semester or terminate the use case.
E-4: Course offerings cannot be displayed. The user is informed that this option is not available at the current time. The use case begins again.
E-5: A link between the professor and the course offering cannot be created. The information is saved and the system will create the link at a later time. The use case continues.
E-6: An invalid course offering name/number is entered. The user can re-enter a valid course offering name/number combination or terminate the use case.
E-7: A link between the professor and the course offering cannot be removed. The information is saved and the system will remove the link at a later time. The use case continues.
E-8: The system cannot retrieve schedule information. The use case then begins again. E-9: The schedule cannot be printed. The user is informed that this option is not available at the current time. The use case begins again.
Use case flow of events documents are entered and maintained in documents external to Rational Rose. The documents are linked to the use case.
NOTE
1. Right-click on the use case in the browser to make the shortcut menu visible.
2. Select the Open Specification menu option. 3. Select the Files tab.
4. Right-click to make the shortcut menu visible. 5. Select the Insert File menu option.
6. Browse to the appropriate directory and select the desired file. 7. Click the Open button.
8. Click the OK button to close the specification.
Linked documents are also added to the Browser.
A linked use case flow of events document is shown in Figure 3-7.
Use Case Relationships
An association relationship may exist between an actor and a use case. This type of association is often referred to as a communicate association since it represents communication between an actor and a use case. An association may be navigable in both directions (actor to use case and use case to actor) or it may be navigable in only one direction (actor to use case or use case to actor). The navigation direction of an association represents who is initiating the communication (i.e., the actor is initiating the communication with the use case, the use case is initiating the communication with the actor). An association is represented as a line connecting the related elements. Navigation in only one direction is depicted by adding an arrowhead to the association line that denotes the direction.
An extend relationship is used to show
• Optional behavior
• Behavior that is run only under certain conditions such as triggering an alarm
• Several different flows that may be run based on actor selection
For example, a use case that monitors the flow of packages on a conveyer belt can be extended by a Trigger Alarm use case if the packages jam. At this time, no extensions have been identified for the ESU Course Registration System. An extend relationship is drawn as a dependency relationship that points from the extension to the base use case. (Note: In Rational Rose 2000, you must use a unidirectional association instead of a dependency relationship.)
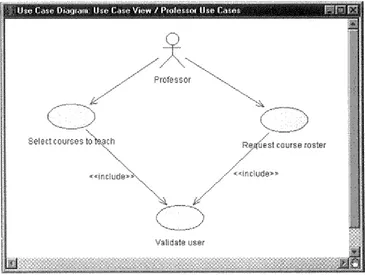
The UML has a concept called a stereotype, which provides the capability of extending the basic modeling elements to create new elements. Thus, the concept of a stereotype allows the UML to have a minimal set of symbols that may be extended where needed to provide the communication artifacts that have meaning for the system under development. Stereotype names are included within guillemets (< < > >) and placed along the relationship line. Stereotypes are used to create the needed use case relationships. The stereotype < < communicate> > may be added to an association to show that the association is a communicate association. This is optional since an association is the only type of relationship allowed between an actor and a use case. Include and extend relationships must use stereotypes since they are both represented by a dependency relationship.
Use case relationships are shown in Figure 3-8.
Figure 3-8. Use Case Relationships
Use Case Diagrams
system boundary (actors) and the major functionality provided by the system (use cases). Other use case diagrams may be created as needed. Some examples follow:
• A diagram showing all the use cases for a selected actor
• A diagram showing all the use cases being implemented in an iteration
• A diagram showing a use case and all its relationships
NOTE
1. Double-click on the Main diagram in the Use Case View in the browser to open the diagram.
2. Click to select an actor in the browser and drag the actor onto the diagram. 3. Repeat step 2 for each additional actor needed in the diagram.
4. Click to select a use case in the browser and drag the use case onto the diagram. 5. Repeat step 4 for each additional use case needed in the diagram.
Note: Actors and use cases may also be created directly on a use case diagram by using the toolbar.
NOTE
1. Click to select the Association icon or the Unidirectional Association icon from the diagram toolbar. Note: If the Association icon is not present on the toolbar, it may be added by right-clicking on the toolbar, selecting the Customize menu choice from the shortcut menu, and adding the icon to the toolbar.
2. Click on an actor initiating a communication and drag the association line to the desired use case.
To add the communicate stereotype (optional):
1. Double-click on the association line to make the Specification visible.
2. Click the arrow in the Stereotype field to make the drop-down menu visible, and select communicate.
3. Click the OK button to close the Specification.
4. Repeat the preceding steps for each additional communicate relationship.
NOTE
1. Click to select the Unidirectional Association icon from the toolbar.
2. Click on the using use case and drag the Unidirectional Association icon to the used use case.
3. Double-click on the unidirectional association arrow to make the Specification visible. 4. Click the arrow in the Stereotype field to make the drop-down menu visible, and select
NOTE
1. Click to select the Unidirectional Association icon from the toolbar.
2. Click on the use case containing the extended functionality and drag the Unidirectional Association icon to the base use case.
3. Double-click on the unidirectional association arrow to make the Specification visible. 4. Click the arrow in the Stereotype field to make the drop-down menu visible and select
extend.
5. Click the OK button to close the Specification.
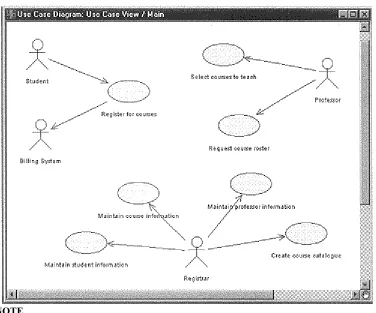
The Main use case diagram for the ESU Course Registration System is shown in Figure 3-9.
Figure 3-9. Main Use Case Diagram
NOTE
1. Right-click on the Use Case View in the browser to make the shortcut menu visible. 2. Select the New:Use Case Diagram menu option.
3. While the use case diagram is selected, enter the name of the actor.
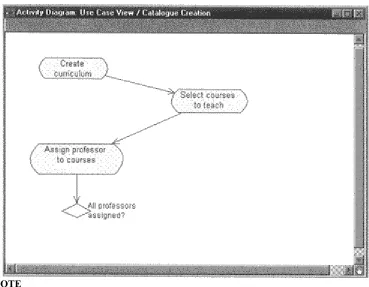
An additional use case diagram is shown in Figure 3-10.
Figure 3-10. An Additional Use Case Diagram
Activity Diagrams
Activity Diagrams also may be created at this stage in the life cycle. These diagrams represent the dynamics of the system. They are flow charts that are used to show the workflow of a system; that is, they show the flow of control from activity to activity in the system, what activities can be done in parallel, and any alternate paths through the flow. At this point in the life cycle, activity diagrams may be created to represent the flow across use cases or they may be created to represent the flow within a particular use case. Later in the life cycle, activity diagrams may be created to show the workflow for an operation.
Activity diagrams contain activities, transitions between the activities, decision points, and synchronization bars. In the UML, activities are represented as rectangles with rounded edges, transitions are drawn as directed arrows, decision points are shown as diamonds, and synchronization bars are drawn as thick horizontal or vertical bars as shown in Figure 3-11.
NOTE
1. Right-click on the Use Case View in the browser to make the shortcut menu visible. 2. Select the New:Activity Diagram menu choice. This will add an activity diagram
called NewDiagram to the browser.
3. While the new diagram is still selected, enter the name of the diagram. 4. Double-click on the activity diagram in the browser to open the diagram.
A browser view of an activity diagram is shown in Figure 3-12.
Activities
An activity represents the performance of some behavior in the workflow.
NOTE
1. Click to select the Activity icon from the toolbar.
2. Click on the activity diagram window to place the activity. 3. While the activity is still selected, enter the name of the activity.
Activities are shown in Figure 3-13.
Figure 3-13. Activities
Transitions
Transitions are used to show the passing of the flow of control from activity to activity. They are typically triggered by the completion of the behavior in the originating activity.
NOTE
1. Click to select the state transition icon from the toolbar.
Transitions are shown in Figure 3-14.
Figure 3-14. Transitions
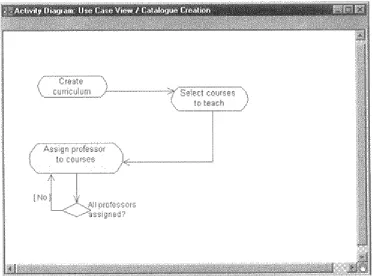
Decision Points
When modeling the workflow of a system it is often necessary to show where the flow of control branches based on a decision point. The transitions from a decision point contain a guard condition, which is used to determine which path from the decision point is taken. Decisions along with their guard conditions allow you to show alternate paths through a work flow.
NOTE
1. Click to select the Decision icon from the toolbar.
2. Click on the activity diagram window to place the decision. 3. While the decision is still selected, enter the name of the decision. 4. Click to select the Transition icon on the toolbar.
5. Click on the originating activity and drag the transition to the decision icon.
A decision point is shown in Figure 3-15.
NOTE
1. Click to select the State Transition icon from the toolbar.
2. Click on the decision and drag the transition to the successor activity. (Note: Rational Rose may place the transition on top of an existing transition. To separate the transition, select the transition and drag it onto the activity diagram window.)
3. Double-click on the transition arrow to make the Specification visible. 4. Select the Detail tab.
5. Enter the guard condition in the Guard Condition field. 6. Click the OK button to close the Specification.
A transition with a guard is shown in Figure 3-16.
NOTE
1. Click to select the line that should be rectilinear (multi-select may be accomplished by first selecting the Shift button).
2. Select the Format: Line Style: Rectilinear menu choice.
3. Relocate the lines as needed by selecting the line and dragging it to the desired location on the activity diagram window.
Rectilinear lines are shown in Figure 3-17.
Synchronization Bars
In a workflow there are typically some activities that may be done in parallel. A synchronization bar allows you to specify what activities may be done concurrently. Synchronization bars are also used to show joins in the workflow; that is, what activities must complete before processing may continue. That said, a synchronization bar may have many incoming transitions and one outgoing transition, or one incoming transition and many outgoing transitions.
NOTE
1. Click to select the Horizontal Synchronization or the Vertical Synchronization icon from the toolbar.
2. Click on the activity diagram window to place the synchronization bar.
3. Click to select the State Transition icon on the toolbar and add any needed incoming and outgoing transitions to the synchronization bar.
Synchronization bars are shown in Figure 3-18.
Swimlanes
Swimlanes may be used to partition an activity diagram. This typically is done to show what person or organization is responsible for the activities contained in the swimlane.
NOTE
1. Click to select the Swimlane icon from the toolbar.
2. Click on the activity diagram window to place the swimlane. This will add a swimlane called NewSwimlane to the diagram.
3. Double-click on the NewSwimlane (the words) to open the Specification. 4. Enter the name of the swimlane in the Name field.
5. Click the OK button to close the Specification.
6. To resize the swimlane, click on the swimlane border and drag the swimlane to the desired location.
7. Drag all needed activities and transitions into the swimlane. (Note: You may also create new activities and transitions in the swimlane.)
Initial and Final Activities
There are special symbols that are used to show the starting and final activities in a workflow. The starting activity is shown using a solid filled circle and the final activities are shown using a bull's eye. Typically, there is one starting activity for the workflow and there may be more than one ending activity (one for each alternate flow in the workflow).
NOTE
1. Click to select the Start State or the End State icon from the toolbar. 2. Click on the activity diagram window to place the start or end state.
3. If you added a start state, click on the State Transition icon, click on the start state, and drag the transition to the first activity in the workflow.
4. 4. If you added an end state, click on the State Transition icon, click on the successor activity, and drag the transition to the end state.
An activity diagram with start and end states is shown in Figure 3-20.
Summary
System Behavior IS documented in a use case model that illustrates the system's intended functions (use cases), its surroundings (actors), and the relationships between the use cases and actors (use case diagrams). The most important role of a use case model is to communicate the system's functionality and behavior to the customer or end user.
The use case model starts in the Inception Phase with the identification of the actors and the principal use cases for the system. The model is then matured in the Elaboration Phase.
Actors are not part of the system—they represent anyone or anything that must interact with the system under development. Use cases represent the functionality provided by the system. They model a dialogue between an actor and the system.
Each use case contains a flow of events, which is a description of the events needed to accomplish the use case functionality. The flow of events is written in terms of what the system should do, not how the system does it. A use case diagram is a graphical representation of some or all of the actors, use cases, and their interactions for a system.
Two popular types of use case relationships are include and extend. An include relationship is drawn to show functionality that is shared by several use cases; an extend relationship depicts optional behavior of a use case.
Chapter 4. Finding Classes
• What Is an Object?
• State, Behavior, and Identity
• What Is a Class?
• Stereotypes and Classes
• Discovering Classes
• Documenting Classes
• Packages
• Objects and Classes in the ESU Course Registration Problem
• Class Diagrams
• Summary
What is an Object?
An object is a representation of an entity, either real-world or conceptual. An object can represent something concrete, such as Joe's truck or my computer, or a concept such as a chemical process, a bank transaction, a purchase order, Mary's credit history, or an interest rate.
An object is a concept, abstraction, or thing with well-defined boundaries and meaning for an application. Each object in a system has three characteristics: state, behavior, and identity.
State, Behavior, and Identity
The state of an object is one of the possible conditions in which it may exist. The state of an object typically changes over time, and is defined by a set of properties (called attributes), with the values of the properties, plus the relationships the object may have with other objects. For example, a course offering object in the registration system may be in one of two states: open and closed. If the number of students registered for a course offering is less than 10, the state of the course offering is open. When the tenth student registers for the course offering, the state becomes closed.
Behavior determines how an object responds to requests from other objects and typifies everything the object can do. Behavior is implemented by the set of operations for the object. In the registration system, a course offering could have the behaviors add a student and delete a stu