"Thinking with Data gets to the essence of the process, and guides data scientists in answering that most important question—what’s the problem we’re really trying to solve?”
— Hilary Mason
Data Scientist in Residence at Accel Partners; co-founder of the DataGotham Conference
“Thinking with Data does a wonderful job of reminding data scientists to look past technical issues and to focus on making an impact on the broad business objectives of their employers and clients. It’s a useful supplement to a data science curriculum that is largely focused on the technical machinery of statistics and computer science.”
— John Myles White
Scientist at Facebook; author of Machine Learning for Hackers and Bandit Algorithms for Website Optimization
“This is a great piece of work. It will be required reading for my team.”
— Nick Kolegraff
Director of Data Science at Rackspace
“Shron’s Thinking with Data is a nice mix of academic traditions, from design to philosophy, that rescues data from mathematics and the regime of pure calculation. … These are lessons that should be included in any data science course!”
— Mark Hansen
Thinking with Data
Copyright © 2014 Max Shron. All rights reserved.
Printed in the United States of America.
Published by O’Reilly Media, Inc., 1005 Gravenstein Highway North, Sebastopol, CA 95472.
O’Reilly books may be purchased for educational, business, or sales promotional use. Online editions are also available for most titles (http://my.safaribooksonline.com). For more information, contact our corporate/institutional sales department: 800-998-9938 or [email protected].
Editors: Mike Loukides and Ann Spencer
Production Editor: Kristen Brown
Copyeditor: O’Reilly Production Services
Proofreader: Kim Cofer
Cover Designer: Karen Montgomery
Interior Designer: David Futato
Illustrator: Rebecca Demarest
February 2014: First Edition
Revision History for the First Edition:
2014-01-16: First release
See http://oreilly.com/catalog/errata.csp?isbn=9781449362935 for release details.
Nutshell Handbook, the Nutshell Handbook logo, and the O’Reilly logo are registered trademarks of O’Reilly Media, Inc. Thinking with Data and related trade dress are trademarks of O’Reilly Media, Inc. Many of the designations used by manufacturers and sellers to distinguish their products are claimed as trademarks. Where those designations appear in this book, and O’Reilly Media, Inc. was aware of a trademark claim, the designations have been printed in caps or initial caps.
While every precaution has been taken in the preparation of this book, the publisher and author assume no responsibility for errors or omissions, or for damages resulting from the use of the information contained herein.
Contents
1 | Scoping: Why Before How 1
2 | What Next? 17
3 | Arguments 31
4 | Patterns of Reasoning 43
5 | Causality 57
6 | Putting It All Together 67
A | Further Reading 77
Preface
Working with data is about producing knowledge. Whether that knowledge is con-sumed by a person or acted on by a machine, our goal as professionals working with data is to use observations to learn about how the world works. We want to turn information into insights, and asking the right questions ensures that we’re creating insights about the right things. The purpose of this book is to help us understand that these are our goals and that we are not alone in this pursuit.
I work as a data strategy consultant. I help people figure out what problems they are trying to solve, how to solve them, and what to do with them once the problems are “solved.” This book grew out of the recognition that the problem of asking good questions and knowing how to put the answers together is not a new one. This problem—the problem of turning observations into knowledge—is one that has been worked on again and again and again by experts in a variety of disci-plines. We have much to learn from them.
People use data to make knowledge to accomplish a wide variety of things. There is no one goal of all data work, just as there is no one job description that encapsulates it. Consider this incomplete list of things that can be made better with data:
• Answering a factual question
• Telling a story
• Exploring a relationship
• Discovering a pattern
• Making a case for a decision
• Automating a process
1.See Taxonomy of Data Science by Hilary Mason and Chris Wiggins (http://www.dataists.com/2010/09/ a-taxonomy-of-data-science/) and From Data Mining to Knowledge Discovery in Databases by Usama Fayyad et al. (AI Magazine, Fall 1996).
Doing each of these well in a data-driven way draws on different strengths and skills. The most obvious are what you might call the “hard skills” of working with data: data cleaning, mathematical modeling, visualization, model or graph inter-pretation, and so on.1
What is missing from most conversations is how important the “soft skills” are for making data useful. Determining what problem one is actually trying to solve, organizing results into something useful, translating vague problems or questions into precisely answerable ones, trying to figure out what may have been left out of an analysis, combining multiple lines or arguments into one useful result…the list could go on. These are the skills that separate the data scientist who can take di-rection from the data scientist who can give it, as much as knowledge of the latest tools or newest algorithms.
Some of this is clearly experience—experience working within an organization, experience solving problems, experience presenting the results. But these are also skills that have been taught before, by many other disciplines. We are not alone in needing them. Just as data scientists did not invent statistics or computer science, we do not need to invent techniques for how to ask good questions or organize complex results. We can draw inspiration from other fields and adapt them to the problems we face. The fields of design, argument studies, critical thinking, national intelligence, problem-solving heuristics, education theory, program evaluation, various parts of the humanities—each of them have insights that data science can learn from.
Data science is already a field of bricolage. Swaths of engineering, statistics, machine learning, and graphic communication are already fundamental parts of the data science canon. They are necessary, but they are not sufficient. If we look further afield and incorporate ideas from the “softer” intellectual disciplines, we can make data science successful and help it be more than just this decade’s fad.
This book consists of six chapters. Chapter 1 covers a framework for scoping data projects. Chapter 2 discusses how to pin down the details of an idea, receive feedback, and begin prototyping. Chapter 3 covers the tools of arguments, making it easier to ask good questions, build projects in stages, and communicate results.
Chapter 4 covers data-specific patterns of reasoning, to make it easier to figure out what to focus on and how to build out more useful arguments. Chapter 5 takes a big family of argument patterns (causal reasoning) and gives it a longer treatment.
Chapter 6 provides some more long examples, tying together the material in the previous chapters. Finally, there is a list of further reading in Appendix A, to give you places to go from here.
Conventions Used in This Book
The following typographical convention is used in this book:
Italic
Indicates new terms, URLs, email addresses, filenames, and file extensions.
Safari® Books Online
Safari Books Online is an on-demand digital library that delivers expert content in both book and video form from the world’s leading authors in technology and business.
Technology professionals, software developers, web designers, and business and creative professionals use Safari Books Online as their primary resource for research, problem solving, learning, and certification training.
Safari Books Online offers a range of product mixes and pricing programs for
How to Contact Us
Please address comments and questions concerning this book to the publisher:
O’Reilly Media, Inc.
1005 Gravenstein Highway North Sebastopol, CA 95472
800-998-9938 (in the United States or Canada) 707-829-0515 (international or local)
707-829-0104 (fax)
We have a web page for this book, where we list errata, examples, and any additional information. You can access this page at http://oreil.ly/thinking-with-data. To comment or ask technical questions about this book, send email to book [email protected].
For more information about our books, courses, conferences, and news, see our website at http://www.oreilly.com.
Find us on Facebook: http://facebook.com/oreilly Follow us on Twitter: http://twitter.com/oreillymedia
Watch us on YouTube: http://www.youtube.com/oreillymedia
Acknowledgments
I would be remiss to not mention some of the fantastic people who have helped make this book possible. Juan-Pablo Velez has been invaluable in refining my ideas. Jon Bruner, Matt Wallaert, Mike Dewar, Brian Eoff, Jake Porway, Sam Rayachoti, Willow Brugh, Chris Wiggins, Claudia Perlich, and John Matthews provided me with key insights that hopefully I have incorporated well.
Jay Garlapati, Shauna Gordon-McKeon, Michael Stone, Brian Eoff, Dave Good-smith, and David Flatow provided me with very helpful feedback on drafts. Ann Spencer was a fantastic editor. It was wonderful to know that there was always someone in my corner. Thank you also to Solomon Roberts, Gabe Gaster, emily barger, Miklos Abert, Laci Babai, and Gordon Kindlmann, who were each crucial at setting me on the path that gave me math. Thank you also to Christian Rudder, who taught me so much—not least of which, the value of instinct. As always, all the errors and mistakes are mine alone. Thanks as well to all of you who were helpful whose names I neglected to put down.
Scoping: Why Before
How
Most people start working with data from exactly the wrong end. They begin with a data set, then apply their favorite tools and techniques to it. The result is narrow questions and shallow arguments. Starting with data, without first doing a lot of thinking, without having any structure, is a short road to simple questions and unsurprising results. We don’t want unsurprising—we want knowledge.
As professionals working with data, our domain of expertise has to be the full problem, not merely the columns to combine, transformations to apply, and models to fit. Picking the right techniques has to be secondary to asking the right questions. We have to be proficient in both to make a difference.
To walk the path of creating things of lasting value, we have to understand elements as diverse as the needs of the people we’re working with, the shape that the work will take, the structure of the arguments we make, and the process of what happens after we “finish.” To make that possible, we need to give ourselves space to think. When we have space to think, we can attend to the problem of why and so what before we get tripped up in how. Otherwise, we are likely to spend our time doing the wrong things.
This can be surprisingly challenging. The secret is to have structure that you can think through, rather than working in a vacuum. Structure keeps us from doing the first things to cross our minds. Structure gives us room to think through all the aspects of a problem.
Let us start at the beginning. Our first place to find structure is in creating the scope for a data problem. A scope is the outline of a story about why we are working on a problem (and about how we expect that story to end).
In professional settings, the work we do is part of a larger goal, and so there are other people who will be affected by the project or are working on it directly as part of a team. A good scope both gives us a firm grasp on the outlines of the problem we are facing and a way to communicate with the other people involved.
A task worth scoping could be slated to take anywhere from a few hours with one person to months or years with a large team. Even the briefest of projects benefit from some time spent thinking up front.
There are four parts to a project scope. The four parts are the context of the project; the needs that the project is trying to meet; the vision of what success might look like; and finally what the outcome will be, in terms of how the organization will adopt the results and how its effects will be measured down the line. When a prob-lem is well-scoped, we will be able to easily converse about or write out our thoughts on each. Those thoughts will mature as we progress in a project, but they have to start somewhere. Any scope will evolve over time; no battle plan survives contact with opposing forces.
A mnemonic for these four areas is CoNVO: context, need, vision, outcome. We should be able to hold a conversation with an intelligent stranger about the project, and afterward he should understand (at a high level), why and how we accomplished what we accomplished. Hence, CoNVO.
All stories have a structure, and a project scope is no different. Like any story, our scope will have exposition (the context), some conflict (the need), a resolution (the vision), and hopefully a happily-ever-after (the outcome). Practicing telling stories is excellent practice for scoping data problems.
We will examine each part of the scoping process in detail before looking at a fully worked-out example. In subsequent chapters, we will explore other aspects of getting a good data project going, and then we will look carefully at the structures for thinking that make asking good questions much easier.
something smart and useful, and…clarify our understanding. Data science is an iterative process.
Context (Co)
Every project has a context, the defining frame that is apart from the particular problems we are interested in solving. Who are the people with an interest in the results of this project? What are they generally trying to achieve? What work, gen-erally, is the project going to be furthering?
Here are some examples of contexts, very loosely based on real organizations, distilled down into a few sentences:
• This nonprofit organization reunites families that have been separated by con-flict. It collects information from refugees in host countries. It visits refugee camps and works with informal networks in host countries further from con-flicts. It has built a tool for helping refugees find each other. The decision mak-ers on the project are the CEO and CTO.
• This department in a large company handles marketing for a shoe manufac-turer with a large online presence. The department’s goal is to convince new customers to try its shoes and to convince existing customers to return again. The final decision maker is the VP of Marketing.
• This news organization produces stories and editorials for a wide audience. It makes money through advertising and through premium subscriptions to its content. The main decision maker for this project is the head of online business.
• This advocacy organization specializes in ferreting out and publicizing corrup-tion in politics. It is a small operacorrup-tion, with several staff members who serve multiple roles. They are working with a software development team to improve their technology for tracking evidence of corrupt politicians.
New contexts emerge with new partners, employers, or supervisors, or as an organization’s mission shifts over time. A freelancer often has to understand a new context with every project. It is important to be able to clearly articulate the long-term goals of the people we are looking to aid, even when embedded within an organization.
Sometimes the context for a project is simply our own curiosity and hunger for understanding. In moderation (or as art), there’s no problem with that. Yet if we treat every situation only as a chance to satisfy our own interests, we will soon find that we have passed up opportunities to provide value to others.
The context provides a project with larger goals and helps to keep us on track. Contexts include larger relevant details, like deadlines, that will help us to prioritize our work.
Needs (N)
Everyone faces challenges. Things that, were they to be fixed or understood, would advance the goals they want to reach. What are the specific needs that could be fixed by intelligently using data? These needs should be presented in terms that are meaningful to the organization. If our method will be to build a model, the need is not to build a model. The need is to solve the problem that having the model will solve.
Correctly identifying needs is tough. The opening stages of a data project are a design process; we can draw on techniques developed by designers to make it easier. Like a graphic designer or architect, a data professional is often presented with a vague brief to generate a certain spreadsheet or build a tool to accomplish some task. Something has been discussed, perhaps a definite problem has even been articulated—but even if we are handed a definite problem, we are remiss to believe that our work in defining it ends there. Like all design processes, we need to keep an open mind. The needs we identify at the outset and the needs we ulti-mately try to meet are often not the same.
When we correctly explain a need, we are clearly laying out what it is that could be improved by better knowledge.
Data science is the application of math and computers to solve problems that stem from a lack of knowledge, constrained by the small number of people with any interest in the answers. In the sciences writ large, questions of what matters within the field are set in conferences, by long social processes, and through slow maturation. In a professional setting, we have no such help. We have to determine for ourselves which questions are the important ones to answer.
It is instructive to compare data science needs to needs from other related disciplines. When success is judged not by knowledge but by uptime or perfor-mance, the task is software engineering. When the task is judged by minimizing classification error or regret, without regard to how the results inform a larger dis-cussion, the task is applied machine learning. When results are judged by the risk of legal action or issues of compliance, the task is one of risk management. These are each valuable and worthwhile tasks, and they require similar steps of scoping to get right, but they are not problems of data science.
Consider some descriptions of some fairly common needs, all ones that I have seen in practice. Each of these is much condensed from how they began their life:
• The managers want to expand operations to a new location. Which one is likely to be most profitable?
• Our customers leave our website too quickly, often after only reading one article. We don’t understand who they are, where they are from, or when they leave, and we have no framework for experimenting with new ideas to retain them.
• We want to decide between two competing vendors. Which is better for us?
• Is this email campaign effective at raising revenue?
• We want to place our ads in a smart way. What should we be optimizing? What is the best choice, given those criteria?
And here are some famous ones from within the data world:
• We want to reduce the amount of illegal grease dumping in the sewers. Where might we look to find the perpetrators?
Needs will rarely start out as clear as these. It is incumbent upon us to ask questions, listen, and brainstorm until we can articulate them clearly and they can be articulated clearly back to us. Again, writing is a big help here. By writing down what we think the need is, we will usually see flaws in our own reasoning. We are generally better at criticizing than we are at making things, but when we criticize our own work, it helps us create things that make more sense.
Like designers, the process of discovering needs largely proceeds by listening to people, trying to condense what we understand, and bringing our ideas back to people again. Some partners and decision makers will be able to articulate what their needs are. More likely they will be able to tell us stories about what they care about, what they are working on, and where they are getting stuck. They will give us places to start. Sometimes those we talk with are too close to their task to see what is possible. We need to listen to what they are saying, and it is our job to go beyond listening and actively ask questions until we can clearly articulate what needs to be understood, why, and by whom.
Often the information we need to understand in order to refine a need is a detailed understanding of how some process happens. It could be anything from how a widget gets manufactured to how a student decides to drop out of school to how a CEO decides when to end a contract. Walking through that process one step at a time is a great tactic for figuring out how to refine a need. Drawing diagrams and making lists make this investigation clearer. When we can break things down into smaller parts, it becomes easier to figure out where the most pressing problems are. It can turn out that the thing we were originally worried about was actually a red herring or impossible to measure, or that three problems we were concerned about actually boiled down to one.
If it is not helpful to phrase something in terms of an action, it should at least be related to some larger strategic question. For example, understanding how users of a product are migrating from desktop to mobile versions of a website is useful for informing the product strategy, even if there is no obvious action to take after-ward. Needs should always be specified in words that are important to the organi-zation, even if they’re only questions.
Until we can clearly articulate the needs we are trying to meet, and until we understand how meeting those specific needs will help the organization achieve its larger goals, we don’t know why we’re doing what we’re hoping to do. Without that part of a scope, our data work is mostly going to be fluff and only occasionally worthwhile.
Continuing from the longer examples, here are some needs that those organ-izations might have:
• The nonprofit that reunited families does not have a good way to measure its success. It is prohibitively expensive to follow up with every individual to see if they have contacted their families. By knowing when individuals are doing well or poorly, the nonprofit will be able to judge the effectiveness of changes to its strategy.
• The marketing department at the shoe company does not have a smart way of selecting cities to advertise to. Right now it is selecting its targets based on intuition, but it thinks there is a better way. With a better way of selecting cities, the department expects sales will go up.
• The media organization does not know the right way to define an engaged reader. The standard web metric of unique daily users doesn’t really capture what it means to be a reader of an online newspaper. When it comes to opti-mizing revenue, growth, and promoting subscriptions, 30 different people vis-iting on 30 different days means something very different from 1 person visvis-iting for 30 days in a row. What is the right way to measure engagement that respects these goals?
Note that the need is never something like, “the decision makers are lacking in a dashboard,” or predictive model, or ranking, or what have you. These are potential solutions, not needs. Nobody except a car driver needs a dashboard. The need is not for the dashboard or model, but for something that actually matters in words that decision makers can usefully think about.
This is a point that bears repeating. A data science need is a problem that can be solved with knowledge, not a lack of a particular tool. Tools are used to accom-plish things; by themselves, they have no value except as academic exercises. So if someone comes to you and says that her company needs a dashboard, you need to dig deeper. Usually what the company needs is to understand how they are per-forming so they can make tactical adjustments. A dashboard may be one way of accomplishing that, but so is a weekly email or an alert system, both of which are more likely to be incorporated into someone’s workflow.
Similarly, if someone comes to you and tells you that his business needs a predictive model, you need to dig deeper. What is this for? Is it to change something that he doesn’t like? To make accurate predictions to get ahead of a trend? To au-tomate a process? Or does the business need to generalize to a new case that’s unlike any seen in order to inform a decision? These are all different needs, requiring different approaches. A predictive model is only a small part of that.
Vision (V)
Before we can start to acquire data, perform transformations, test ideas, and so on, we need some vision of where we are going and what it might look like to achieve our goal.
The vision is a glimpse of what it will look like to meet the need with data. It could consist of a mockup describing the intended results, or a sketch of the argu-ment that we’re going to make, or some particular questions that narrowly focus our aims.
Someone who is handed a data set and has not first thought about the context and needs of the organization will usually start and end with a narrow vision. It is rarely a good idea to start with data and go looking for things to do. That leads to stumbling on good ideas, mostly by accident.
on data science or reading classics (like Edward Tufte and Richard Feynman), fol-lowing blogs, attending conferences and meetups, and experimenting with new ideas all the time.
There is no shortcut to gaining experience, but there is a fast way to learn from your mistakes, and that is to try to make as many of them as you can. Especially if you are just getting started, creating things in quantity is more important than creating things of quality. There is a saying in the world of Go (the east Asian board game): lose your first fifty games of Go as quickly as possible.
The two main tactics we have available to us for refining our vision are mockups and argument sketches.
A mockup is a low-detail idealization of what the final result of all the work might look like. Mockups can take the form of a few sentences reporting the out-come of an analysis, a simplified graph that illustrates a relationship between vari-ables, or a user interface sketch that captures how people might use a tool. A mock-up primes our imagination and starts the wheels turning about what we need to assemble to meet the need. Mockups, in one form or another, are the single most useful tool for creating focused, useful data work (see Figure 1-1).
Figure 1-1. A visual mockup
Mockups can also come in the form of sentences:
Sentence Mockups
The probability that a female employee asks for a flexible schedule is roughly the same as the probability that a male employee asks for a flexible schedule.
Keep in mind that a mockup is not the actual answer we expect to arrive at. Instead, a mockup is an example of the kind of result we would expect, an illustra-tion of the form that results might take. Whether we are designing a tool or pulling data together, concrete knowledge of what we are aiming at is incredibly valuable. Without a mockup, it’s easy to get lost in abstraction, or to be unsure what we are actually aiming toward. We risk missing our goals completely while the ground slowly shifts beneath our feet. Mockups also make it much easier to focus in on what is important, because mockups are shareable. We can pass our few sentences, idealized graphs, or user interface sketches off to other people to solicit their opin-ion in a way that diving straight into source code and spreadsheets can never do.
A mockup shows what we should expect to take away from a project. In contrast, an argument sketch tells us roughly what we need to do to be convincing at all. It is a loose outline of the statements that will make our work relevant and correct. While they are both collections of sentences, mockups and argument sketches serve very different purposes. Mockups give a flavor of the finished product, while argu-ment sketches give us a sense of the logic behind the solution.
For example, if we want to know whether women and men are equally inter-ested in flexible time arrangements, there are a few parts to making a convincing case. First, we need to have a good definition of who the women and men are that we are talking about. Second, we need to decide if we are interested in subjective measurement (like a survey), if we are interested in objective measurement (like the number of applications for a given job), or if we want to run an experiment. We could post the same job description but only show postings with flexible time to half of the people who visit a job site. There are certain reasons to find each of these compelling, ranging from the theory of survey design to mathematical rules for the design of experiments.
Example 1
• Vision: The nonprofit that is trying to measure its successes will get an email of key performance indicators on a regular basis. The email will con-sist of graphs and automatically generated text.
• Mockup: After making a change to our marketing, we hit an enrollment goal this week that we’ve never hit before, but it isn’t being reflected in the success measures.
• Argument sketch: The nonprofit is doing well (or poorly) because it has high (or low) values for key performance indicators. After seeing the key performance indicators, the reader will have a good sense of the state of the nonprofit’s activities and will be able to adjust accordingly.
Example 2
Here are several ideas for the marketing department looking to target new cities, depending on the details of the context:
Idea 1
• Vision: The marketing department that wants to improve its targeting will get a report that ranks cities by their predicted value to the company.
• Mockup: Austin, Texas, would provide a 20% return on investment per month. New York City would provide an 11% return on investment per month.
• Argument sketch: The department should focus on city X, because it is most likely to bring in high value. The definition of high value that we’re planning to use is substantiated for the following reasons….
Idea 2
• Vision: The marketing department will get some software that imple-ments a targeting model, which chooses a city to place advertiseimple-ments in. Advertisements will be targeted automatically based on the model, through existing advertising interfaces.
• Argument sketch: Advertisements should be placed proportional to their future value. The department should feel confident that this au-tomatic selector will be accurate without being watched.
Idea 3
• Vision: The marketing department will get a spreadsheet that can be dropped into the existing workflow. It will fill in some characteristics of a city and the spreadsheet will indicate what the estimated value would be.
• Mockup: By inputting gender and age skew and performance results for 20 cities, an estimated return on investment is placed next to each potential new market. Austin, Texas, is a good place to target based on age and gender skew, performance in similar cities, and its total market size.
• Argument sketch: The department should focus on city X, because it is most likely to bring in high value. The definition of high value that we’re planning to use is substantiated for the following reasons….
Example 3
• Vision: The media organization trying to define user engagement will get a report outlining why a particular user engagement metric is the ideal one, with supporting examples; models that connect that metric to revenue, growth, and subscriptions; and a comparison against other metrics.
• Mockup: Users who score highly on engagement metric A are more likely to be readers at one, three, and six months than users who score highly on engagement metrics B or C. Engagement metric A is also more correlated with lifetime value than the other metrics.
• Argument sketch: The media organization should use this particular en-gagement metric going forward because it is predictive of other valuable outcomes.
Example 4
and affiliations to watch for. The results will be fed into a database, which will feed a dashboard and email alert system.
• Mockup: A typical alert is that politician X, who was identified based on campaign contributions as a target to watch, has suddenly showed up on 10 news talk shows.
• Argument sketch: We have correctly kept tabs on politicians of interest, and so the people running the anti-corruption project can trust this service to do the work of following names for them.
In mocking up the outcome and laying out the argument, we are able to un-derstand what success could look like. The final result may differ radically from what we set out to do. Regardless, having a rough understanding at the outset of a project is important. It is also okay to have several potential threads at this point and be open to trying each, such as with the marketing department example. They may end up complementing each other.
The most useful part of making mockups or fragments of arguments is that they let us work backward to fill in what we actually need to do. If we’re looking to send an email of key performance indicators, we’d better come up with some to put into the email. If we’re writing a report outlining why one engagement metric is the best and tying it to a user valuation model, we need to come up with an en-gagement metric and find or develop a user valuation model. The pieces start to fall into place.
At the end of everything, the finished work will often be fairly simple. Because of all of the work done in thinking about context and need, generating questions, and thinking about outcomes, our work will be the right kind of simple. Simple results are the most likely to get used.
Because of all of the work done in thinking about context and need, gen-erating questions, and thinking about outcomes, our work will be the right kind of simple.
When we’re having trouble articulating a vision, it is helpful to start getting something down on paper or out loud to prime our brains. Drawing pretend graphs, talking through examples, making flow diagrams on whiteboards, and so on, are all good ways to get the juices flowing.
Outcome (O)
We need to understand how the work will actually make it back to the rest of the organization and what will happen once it is there. How will it be used? How will it be integrated into the organization? Who will own its integration? Who will use it? In the end, how will its success be measured?
If we don’t understand the intended use of what we produce, it is easy to get lost in the weeds and end up making something that nobody will want or use. What’s the purpose of all this work if it does nobody any good?
The outcome is distinct from the vision; the vision is focused on what form the work will take at the end, while the outcome is focused on what will happen when we are “done.” Here are the outcomes for each of the examples we’ve been looking at so far:
• The metrics email for the nonprofit needs to be set up, verified, and tweaked. Sysadmins at the nonprofit need to be briefed on how to keep the email system running. The CTO and CEO need to be trained on how to read the metrics emails, which will consist of a document written to explain it.
• The marketing team needs to be trained in using the model (or software) in order to have it guide their decisions, and the success of the model needs to be gauged in its effect on sales. If the result ends up being a report instead, it will be delivered to the VP of Marketing, who will decide based on the recommen-dations of the report which cities will be targeted and relay the instructions to his staff. To make sure everything is clear, there will be a follow-up meeting two weeks and then two months after the delivery.
• The media mention finder needs to be integrated with the existing mention database. The staff needs to be trained to use the dashboard. The IT person needs to be informed of the existence of the tool and taught how to maintain it. Periodic updates to the system will be needed in order to keep it correctly parsing new sources, as bugs are uncovered. The developers who are doing the integration will be in charge of that. Three months after the delivery, we will follow up to check on how well the system is working.
Figuring out what the right outcomes are boils down to three things. First, who will have to handle this next? Someone else is likely to have to interpret or imple-ment or act on our work. Who are they, what are their requireimple-ments, and what do we need to do differently from our initial ideas to address their concerns?
Second, who or what will handle keeping this work relevant, if anyone? Do we need to turn our work into a piece of software that runs repeatedly? Will we have to return in a few months? More often than not, analyses get re-run, even if they are architected to be run once.
Third, what do we hope will change after we have finished the work? Note again that “having a model” is not a suitable change; what in terms that matter to the partners will have changed? How will we verify that this has happened?
Thinking through the outcome before embarking on a project, along with knowing the context, identifying the right needs, and honing our vision, improves the chance that we will do something that actually gets used.
Seeing the Big Picture
Tying everything together, we can see that each of these parts forms a coherent narrative about what we might accomplish by working with data to solve this problem.
First, let’s see what it would look like to sketch out a problem without much structured thinking:
We will create a logistic regression of web log data using SAS to find patterns in reader behavior. We will predict the probability that someone comes back after visiting the site once.
This media organization produces news for a wide audience. It makes money through advertising and premium subscriptions to its content. The person who asked for some advice is the head of online business.
This organization does not know the right way to define an engaged reader. The standard web metric of unique daily users doesn’t really capture what it means to be a reader of an online newspaper. When it comes to optimizing revenue, growth, and promoting subscrip-tions, 30 different people visiting on 30 different days means some-thing very different from 1 person visiting for 30 days in a row. What is the right way to measure engagement that respects these goals?
When this project is finished, the head of online business will get a report outlining why a particular user engagement metric is the ideal one, with supporting examples; models that connect that metric to revenue, growth, and subscriptions; and a comparison against other metrics.
If she signs off on its findings, the selected user engagement metric will be incorporated into the performance measures across the en-tire organization. Institutional support and funding for existing and future initiatives will be based in part on how they affect the new engagement metric. A follow-up study will be conducted in six months to verify that the new metric is successfully predicting rev-enue, growth, and subscription rates.
What Next?
With a basic understanding of the four areas of a project scope (context, needs, vision, and outcome), we turn our attention to filling in the details of the project. By thinking deeply before digging into the data, we maximize our chances of doing something useful as opposed to simply the first things that come to mind.
Working with data is a process that you lose yourself in. There is a natural tension between going into exploration as quickly as possible and spending more time thinking and planning up front. When balanced properly, they are mutually beneficial. However, diving in quickly and getting lost in the data exerts a natural siren song on those of us who work with data professionally. It takes effort and patience to put time into thinking up front, but it is effort that is duly rewarded.
Before we start down rabbit holes that may or may not take us somewhere useful, and after we have a rough project scope, we need to take some more steps to clarify the details of the problem we are working on. That process is the focus of this chapter. This includes important discussions with decision makers and im-plementers, figuring out how to define key terms, considering what arguments we might make, posing open questions to ourselves, and deciding in what order to pursue different ideas.
There is no particular order to these steps. A project might be so simple that every area is obvious and we don’t need to engage with anybody else or do any more thinking before we dive into the data work. This is rare. More than likely, there will be things that need clarification in our own heads (and in the minds of others) to avoid wasted effort.
As we move on to the rest of the project, it’s critical to remember to take careful notes along the way. There are minor intellectual and technical decisions made throughout a project that will be crucial in writing the final documentation. Having a final, written version of the work we do means a much greater chance to reproduce our work again months or years down the line. It also means we are more likely to catch our own errors as we put our ideas down into words.
Refining the Vision
The vision we expressed in our first pass at a scope is often sufficient to get started, but not complete enough to guide our actions.
We refine our vision by improving our intuition about the problem. We im-prove our intuition by talking to people, trying out ideas, gathering questions, and running simple experiments. We want to spend time up front maximizing our understanding. It pays to make our early work investigative rather than definitive. Pointed questions explore the limits of our current knowledge, and focusing on question generation is a good use of time. Good questions also offer up new ways to frame a problem. At the end of the day, it is usually how we frame the problem, not the tools and techniques that we use to answer it, that determine how valuable our work is.
Some of these questions will be preliminary and serve to illustrate the breadth of the problem, such as knowing whether there are ten thousand or ten million purchases per month to study. Others will form the core of the work we are looking to undertake, such as how exactly those purchases are related over time for the same customer.
One technique for coming up with questions is to take a description of a need or of a process that generated our data and to ask every question that we can think of—this is called kitchen sink interrogation. In a kitchen sink interrogation, we are generating questions, not looking for answers. We want to get a sense of the lay of the land. A few minutes up front can save days or weeks down the line.
If our customers leave our website too quickly, why do they leave? What does it mean to leave? At what points do they leave? What separates the ones who leave from the ones who stay? Are there things that we have done before that have changed customer behavior? Are there quick things we can try now? How do we know what their behavior is? How reliable is that source? What work has already been done on this problem?
alternative metrics that we haven’t looked at yet? How will we validate what a good metric is? By collecting questions with a kitchen sink interrogation, we start to get a sense for what is known and what is unknown.
Another technique, working backward, starts from the mockups or argument sketches and imagines each step that has to be achieved between the vision and where we are right now. In the process of working backward, we kick up a number of questions that will help to orient us. When we’re lucky, we will figure out that a certain task is not feasible long before we’ve committed resources to it.
The same techniques discussed in Chapter 1 do not go away once we have a basic sense of the vision. Mockups and argument sketches are continuously useful. Having a clear vision of what our goal looks like—whether it’s in the form of a sentence describing what we would learn or a hand-drawn sketch of a graph—is incredibly instructive in its production and a wonderful guiding light when we are deep in the trenches. Having a clear idea of what numbers we expect to come out of a process before we start it also means that we will catch errors right away.
We can also borrow tactics that we used to refine needs. Walking through a scenario or roleplaying from the perspective of the final consumer is a good way to catch early problems in our understanding of what we are aiming at. If we are producing a map or a spreadsheet or an interactive tool, there is always going to be someone on the other side. Thinking about what their experience will be like helps keep us focused.
Once results start to come in, in whatever form makes sense for the work we are doing, it pays to continually refer back to this early process to see if we are still on track. Do these numbers make sense? Is the scenario we envisioned possible?
Techniques for refining the vision
Interviews
Talk to experts in the subject matter, especially people who work on a task all the time and have built up strong intuition. Their intuition may or may not match the data, but having their perspective is invaluable at building your intuition.
Rapid investigation
Kitchen sink interrogation
Ask every question that comes to mind relating to a need or a data collection process. Just the act of asking questions will open up new ideas. Before it was polluted as a concept, this was the original mean-ing of the term brainstormmean-ing.
Working backward
Start from the finished idea and figure out what is needed immediately prior in order to achieve the outcome. Then see what is prior to that, and prior to that, and so on, until you arrive at data or knowledge you already have.
More mockups
Drawing further and more well-defined idealizations of the outcome not only helps to figure out what the actual needs are, but also more about what the final result might look like.
Roleplaying
Pretend you are the final consumer or user of a project, and think out loud about the process of interacting with the finished work.
Deep Dive: Real Estate and Public Transit
An extended example will be instructive. Suppose that a firm in New York that controls many rental properties is interested in improving its profitability on apart-ment buildings it buys. It considers itself a data-driven company, and likes to un-derstand the processes that drive rental prices. It has an idea that public transit access is a key factor in rental prices, but is not sure of the relationship or what to do with it.
We have a context (a data-driven New York residential real estate company) and a vague need (it wants to somehow use public transit data to improve its under-standing of rental prices). After some deep conversation, and walking through sce-narios of what it might do if it understood how transit access affects rental prices, it turns out the company actually has several specific needs.
company set prices more effectively, and improve profitability. And third, the com-pany would love to be able to predict where real estate prices are heading.
Note that the latter two needs did not mention public transit data explicitly. It may turn out in the process of working with this data that public transit data isn’t useful, but all the other data we dig up actually is! Will the real estate company be disappointed? Certainly not. Public transit data will be the focus of our work, but the goal isn’t so much to use public transit data as it is to improve the profitability of the company. If we stick too literally to the original mandate, we may miss op-portunities. We may even come up with other goals or opportunities in the course of our analyses.
Before we go too far, what is our intuition telling us? Knowing the subject matter, or talking to subject matter experts, is key here. Reading apartment adver-tisements would be a good way to build up an understanding of what is plausible. Apartment prices probably are higher close to transit lines; certainly listings on real estate websites list access to trains as an amenity. Putting ourselves in the shoes of someone getting to work, we can realize that the effect likely drops off rapidly, because people don’t like to walk more than 10 or 15 minutes if they can help it. The effects are probably different in different neighborhoods and along different transit lines, because different destinations are more interesting or valuable than others.
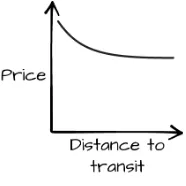
Moving on to the vision, we can try out a few ideas for what a result would look like. If our final product contained a graph, what would it be a graph of? Roughly speaking, it would be a graph of “price” against “nearness to transit,” with price falling as we got farther away from transit. In reality it would be a scatterplot, but drawing a line graph is probably more informative at this stage. Actually sketching a mockup of a basic graph, with labels, is a useful exercise (Figure 2-1).
Figure 2-1. Mockup graph
relationship likely depends on other factors, like neighborhood. We would need a series of graphs, at least. This could be part of a solution to the first two needs, verifying that there is a strong relationship between public transit and the housing market, and trying to predict whether apartments are under- or overpriced.
Digging into our experience, we know that graphs are just one way to express a relationship. Two others are models and maps. How might we capture the relevant relationships with a statistical model?
A statistical model would be a way to relate some notion of transit access to some notion of apartment price, controlling for other factors. We can clarify our idea with a mockup. The mockup here would be a sentence interpreting the hypo-thetical output. Results from a model might have conclusions like, “In New York City, apartment prices fall by 5% for every block away from the A train, compared to similar apartments.” Because we thought about graphs already, we know that one of the things we will need to control for in a model is neighborhood and train line. A good model might let us use much more data. For example, investigating the government data archives on this topic reveals that turnstile data is freely avail-able in some cities.
A model has the potential to meet all three of our needs, albeit with more effort. Model verification would let us know if the relationship is plausible, outlier detec-tion would allow us to find mispriced apartments, and running the model on fake data would allow us to predict the future (to some extent). Each of these may require different models or may not be plausible, given the data that is available. A model might also support other kinds of goals—for example, if we wanted to figure out which train line had the largest effect on prices.
If our vision is a transit map, it would be a heat map of apartment prices, along with clearly marked transit lines and probably neighborhood boundaries. There would need to be enough detail to make the city’s layout recognizable. Depending on the resolution of the map, this could potentially meet the first two needs (making a case for a connection and finding outliers) as well, through visual inspection. A map is easier to inspect, but harder to calibrate or interpret.
What we finally end up with will probably be more complicated than the basic things we outline here. There may actually be a combination of two or all three of these, or some output we haven’t considered yet; maybe a website that the firm can use to access the model predictions with a few knobs to specify apartment details, or a spreadsheet that encodes a simple model for inclusion in other projects. Any graph, model, or map we make for this project will depend on additional bits of analysis to back up their conclusions.
Another way to explain this process is to say that we begin with strong as-sumptions and slowly relax them until we find something we can actually achieve. A graph of price against proximity, or a user interface with two buttons, is almost certainly too simple to be put into practice. To make such a project work requires much stronger assumptions that we can make in practice. That shouldn’t stop us from trying to express our ideas in this kind of clean way. Sometimes the details, even when they take up most of our time, are only epicycles on top of a larger point that we will be worse off if we forget.
Don’t forget the utility of a few concrete examples in spurring the imagination. Before building a map, we should try plugging a few intersections into real estate websites to get a feel for how the aspects of homes might vary with distance and price. The same goes for reading classifieds. There may be entire aspects of apart-ments that were not obvious at first glance, like proximity to highly regarded schools, that will be mentioned in the apartment description and could have a huge effect on price. Always seek to immerse yourself in some particular examples, even if it just means reading the first 10 or 20 lines of a table in depth before building a model.
Always seek to immerse yourself in some particular examples, even if it just means reading the first ten or twenty lines of a table in depth before building a model.
Deep Dive Continued: Working Forward
Having imagined the end of our work, it is helpful to think about what kind of data is appropriate for defining the variables. Having spread our wings, it is time to get a little realistic and start working forward from what we have.
as purchasing a database, or it could be a much more involved process of connecting public and private data together.
And what is transit access? Note that, despite the easy way we were able to draw that initial graph, it is not clear at first blush how to even define the term transit access! A little kitchen sink interrogation is useful here.
First, what is transit? The initial conversation was sparked from subway lines. Do buses count? Bus access will be much harder to show on a map than train access, but buses are a necessity in areas that are less well connected to trains. Knowing where the company actually operates might be useful here. How long do people actually walk? Where do people in each neighborhood actually go? Is that informa-tion available? Are there people we could talk to about getting end-to-end transit data, maybe from existing surveys? Could employment records be useful?
“Transit access” itself could be about walking distance to train or bus lines, or it could be about average travel time from a point to important landmarks, like the Empire State Building or Wall Street in New York City. Which one we pick will make a big difference!
In refining the vision we can also recognize that this is a causal question of sorts (how much does being near a subway station increase prices compared to an identical apartment that was farther away?), and therefore calls for a causal argument pattern. Chapters 4 and 5 cover argument patterns in detail, but for our purposes we can recognize that we will, at a minimum, need to acquire additional informa-tion to help distinguish the effect of proximity to transit from, say, higher prices on more luxurious apartments. More luxurious apartments may have been built closer to the subway to take advantage of the better location, and so on.
Further refining the vision, we know that apartment prices will be a continuous variable, neighborhood will probably be an important confounder, and each transit line will probably contribute a different amount. We will need locations of apart-ments and transit stops, information on subways accessed by each stop, and, if we build a model, a reasonable distance or travel time function to tie things together. If we want to understand how these things change over time, we will need not only a snapshot, but also a historical record. The breadth of making a full model starts to become clear in a way it might not have been at the start.
understand historical relationships between transit connectivity and apartment prices, we have to figure out how far back to go and how to handle the additional complexities inherent in working with time data.
Thinking hard about the outcome can clear this up. What will be different after we are done? Might the easiest need be sufficient for now? A more purely obser-vational study would be fine. Or might there be enough buy-in to get this work widely used within the firm? And is the time component really that valuable? Each of these goals is different, the arguments that are needed are different, and they will call for different levels of investment of time and energy. If we don’t think about how the work will be used after we finish, we may end up working on something pointless.
Who will maintain this work after we finish? Keeping a map up-to-date is probably easier than a model with a dozen separate data sources. Are all the sources we are interested in available programmatically, or would we have to take weeks of time to get them again next year?
How will we know if we have done a good job? How do we cross-check our results? For example, we could look at how quickly or slowly each apartment was rented, as a way of verifying that we predicted over- or underpricing correctly. Nat-urally, this is complicated by the speed with which the rental market moves in a big city, but it is worth a thought nevertheless.
Deep Dive Continued: Scaffolding
Having elaborated our vision and what the pieces are that we plan to work with, the next step is to consider our project’s scaffolding. How can we go about our tasks so that at each step we can evaluate what is taking shape and see if we need to change direction? We want to avoid looking back in horror at having wasted our time on something useless.
Models that can be easily fit and interpreted (like a linear or logistic model), or models that have great predictive performance without much work (like random forests), serve as excellent places to start a predictive task. Using a scatterplot of latitude and longitude points as a first approximation map is a great way to start a geospatial project. And so on.
It is important, though, to not get too deep into these exploratory steps and forget about the larger picture. Setting time limits (in hours or, at most, days) for these exploratory projects is a helpful way to avoid wasting time. To avoid losing the big picture, it also helps to write down the intended steps at the beginning. An explicitly written-down scaffolding plan can be a huge help to avoid getting sucked deeply into work that is ultimately of little value. A scaffolding plan lays out what our next few goals are, and what we expect to shift once we achieve them.
It also helps when we understand the argument or arguments we are looking to make. Understanding the outline of our argument will lead us to discover which pieces of analysis are most central. Chapter 3 discusses the details of arguments, including transformation, evidence, justifications, and arranging claims. These let us solve potentially complicated needs with data. With a sketch of the argument in place, it is easier to figure out the most central thing we need to work on. The easiest way to perform this sketching is to write out our ideas as paragraphs and imagine how we will fill in the details.
In the case of the apartment prices and public transit, finding or plotting a map of apartment prices next to a base layer of transit connections is probably the easiest thing to do first. By looking at the map, we can see whether such a relationship seems plausible, and start to gain intuition for the problem of making scatterplots or building a model.
Building exploratory scatterplots should precede the building of a model, if for no reason other than to check that the intuition gained from making the map makes sense. The relationships may be so obvious, or the confounders so unimportant, that the model is unnecessary. A lack of obvious relationships in pairwise scatter-plots does not mean that a model of greater complexity would not be able to find signal, but if that’s what we’re up against, it is important to know it ahead of time. Similarly, building simple models before tackling more complex ones will save us time and energy.
Verifying Understanding
In any scaffolding plan, it is important to build in explicit checks with the partners or decision makers to ensure that we understand their needs properly. It keeps us focused, and it builds trust. It is better to overcommunicate, especially with new partners, than it is to assume that we are on the same page for a week only to find we have built something pointless.
Find a convenient medium and explain the partners’ needs back to them, ask-ing if you have understood thask-ings properly. Mention generally what your thoughts are around your vision, such as the form that the results would take, without going into too much detail. The goal is conceptual agreement, not a detailed critique of the project, unless they are data-savvy and particularly interested. The details will evolve throughout the project anyway.
Explicitly ask them if they agree that you have understood what they are looking for, and if they have any more questions. You should feel confident that you are doing something that they will use. This doesn’t need to be a formal meeting; it can often be accomplished with a quick conversation.
If one or more people will be needed to implement the final work, talk to them and make sure that their requirements are being represented. If someone else will be installing a script we create into production software, who will be in charge of cleaning it up and keeping it running? Talk to them and make sure that you un-derstand what they need.
We will go through basically the same process on a regular basis for large projects, and at least when all the work is done for a project of any size, so pay attention to how these discussions go.
Partners and decision makers often have intuitive understandings of the pro-cesses they are looking to understand better, or at least have some idea of what concrete examples of what they’re interested in will look like. Intuition like that is invaluable, and should never be overlooked. Spending lots of time talking to people who deal with a process is a smart way to get the intuition needed to build a data-based argument that can create real knowledge.
Getting Our Hands Dirty
Once we have data, we may find that our initial ideas were wrong or that the need can be met even more easily than we thought. Regardless, thinking explicitly before we dive into them will make what we do far more productive.
We need to spend time data gathering: actually acquiring the data we will need. This step might be easy, or it may take a long time. We might have one database or API call, or we may need to strategize about how to store all the data we will require. We may need to contact people in positions of authority in order to acquire data. We may need to make trade-offs of accuracy against price or time to acquire new data.
Once some data is gathered, we can begin the transformations. We usually put raw data into a common format, then transform the data into graphs, models, tables, and summaries that can serve as evidence for a larger argument. These steps can take the longest amount of time. As part of the scaffolding, we should plan to start with easy transformations (like exploratory graphs or summary statistics) and then easy models, before moving on to more sophisticated or complicated models. Often, easy transformations will serve well enough to make a valid argument and additional work is not necessary.
Once the data is transformed and ready to serve as evidence, we can evaluate the strength of our arguments. By updating the few paragraphs we wrote out at the beginning with new information, we will know if what we have done fits into the larger goal or not. Is there another thing we forgot to justify or that we need to explore? Do we need to continue on to make a more complicated model? Are there alternative interpretations of what we have found that require us to find something else to help us decide between them? Does this argument even make any sense, given the data we have collected?
After we have arrived at a useful point, we can arrange the results into a pleasing form, keeping in mind the needs of our audience. Will we only show the most damning graph, or does it make more sense to present a chorus of models and summaries? Should we present a series of claims each chained to another, or present a number of claims in parallel? If we’re building a tool, which things should be optional and which fixed? If we’re writing a narrative, which examples should we use to reinforce our point?
Finally, we need to present what we’ve done. The actual written copy, the final form of the graphs, the neat table, the interactive tool with a carefully designed UI —these are all part of having a good presentation. Presentation matters tremen-dously. At the very least, there are genre conventions in every field that are worth following in order to be taken seriously; tone is important in presentation. Highly polished, beautiful graphics may be considered fussy in an academic setting, but are necessary for an earnings report for a design company. A very abstract problem presentation is inappropriate for a board meeting, but useful for demonstrating a technique to colleagues. And so on.
Arguments
Data consists of observations about the world—records in a database, notes in a logbook, images on a hard drive. There is nothing magical about them. These ob-servations may prove useful or useless, accurate or inaccurate, helpful or unhelpful. At the outset, they are only observations. Observations alone are not enough to act on. When we connect observations to how the world works, we have the opportunity to make knowledge. Arguments are what make knowledge out of observations.
There are many kinds of knowledge. Sometimes we have an accurate, unim-peachable mental model of how something works. Other times we have an under-standing that is just good enough. And other times still, the knowledge is not in a person at all, but in an algorithm quietly puzzling out how the world fits together. What concerns us in working with data is how to get as good a connection as pos-sible between the observations we collect and the processes that shape our world.
Knowing how arguments work gives us special powers. If we understand how to make convincing arguments, we can put tools and techniques into their proper place as parts of a whole. Without a good understanding of arguments, we make them anyway (we cannot help ourselves, working with data), but they are more likely to be small and disconnected.
By being aware of how arguments hang together, we can better:
• Get across complicated ideas
• Build a project in stages
• Get inspiration from well-known patterns of argument
• Substitute techniques for one another
• Make our results more coherent
• Present our findings
Thinking explicitly about arguments is a powerful technique, with a long his-tory in philosophy, law, the humanities, and academic debate. It is a more fleshed-out example of using a structure to help us think with data. Thinking abfleshed-out the argument we are making can come into play at any point in working with a problem —from gathering ideas at the very beginning, to ensuring that we are making sense before releasing something into the wild.
Audience and Prior Beliefs
Only in mathematics is it possible to demonstrate something beyond all doubt. When held to that standard, we find ourselves quickly overwhelmed.
Our ideal in crafting an argument is a skeptical but friendly audience, suitable to the context. A skeptical audience is questioning of our observations, not swayed by emotional appeals, but not so skeptical as to be dismissive. The ideal audience is curious; humble, but not stupid. It is an idealized version of ourselves at our best, intelligent and knowledgeable but not intimately familiar with the problem at hand. With the skeptical ideal in mind, it becomes easier to make a general argument, but it is also easier to make an argument to a specific audience. After making an argument for an ideal audience, it is easy to remove some parts and emphasize others to meet the needs of one or more particular audiences. Simplifying or ex-panding on certain things for an audience is fine, but lying is not. Something that good data work inherits from the scientific method is that it is bad form to cheat by preying on gullibility or ignorance. It is bad form, and in the long run it will cause the ruin of a business (or maybe a civilization).
An argument moves from statements that the audience already believes to statements they do not yet believe. At the beginning, they already agree with some statements about the world. After they hear the argument, there are new statements they will agree to that they would not have agreed to before. This is the key insight as to how an argument works—moving from prior belief to new belief to establish knowledge in a defensible way.