A I A N D G A M E T H E O R Y
Editor: Michael Wooldridge, University of Oxford, [email protected]Defeating Terrorist
Networks with
Game Theory
Tomasz P. Michalak, University of Oxford
Talal Rahwan, Masdar Institute of Science and Technology Oskar Skibski, Kyushu University
Michael Wooldridge, University of Oxford
robust and effi cient techniques to analyze and understand the structure and operation of terror-ist organizations. One key problem is that of iden-tifying the key members of the organization using information about the terrorist network’s topol-ogy: this capability would enable security agencies to focus severely limited resources on just those key members.
To this end, many standard measures of centrality from the fi eld of social network analysis can be used. Centrality measures aim to give a numerical characterization of a node’s signifi cance in a network. For example, IBM’s Analyst Notebook— a software package used worldwide by law enforcement and intelligence agencies—supports the degree, closeness, and betweenness centralities, which are probably the most widely used centrality measures. However, these measures have well-known limitations, and the development of more sophisticated measures is currently a key research area. One important thread of current research is to apply techniques from the fi eld of cooperative game theory to this problem. In this article, we present a survey of this work.
Classic Measures of Centrality
The networks we are interested in are undirected weighted graphs: they consist of a set of nodes (vertices) and undirected edges that connect some nodes; each edge is associated with a numerical weight. The specifi c interpretation of the network
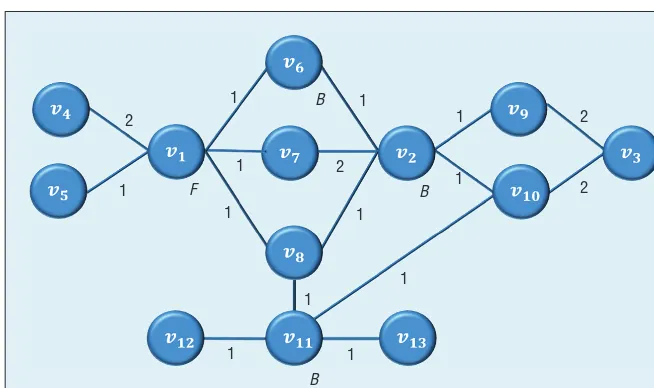
will depend on the application domain, but in the analysis of terrorist networks, nodes are interpreted as members of the network, edges indicate links be-tween them, and weights indicate the strength of the link (for example, the number of meetings between the two individuals). Centrality analysis aims to cre-ate a principled ranking of the importance of nodes within such a network. Since “importance” depends on the problem at hand, researchers have consid-ered many different centrality measures. Among them, degree centrality, closeness centrality, and be-tweenness centrality are the most well-known and widely applied. According to weighted degree cen-trality, a node’s importance is equal to the weight of that node’s adjacent edges (that is, the weighted degree of the node). For instance, in the network in Figure 1, nodes v1 and v2 are the most important
ac-cording to weighted degree centrality, because they have a weighted degree of 6 each, which is greater than that of any other node in the network. In con-trast, according to closeness centrality, a node’s im-portance is based on the average distance between that node and other nodes in the network. In Fig-ure 1, for example, this measFig-ure considers node v8
to be the most important in the network. Finally, betweenness centrality focuses on shortest paths between any two nodes in the network; the more shortest paths a given node belongs to, the higher its ranking. In Figure 1, node v11 is the most
impor-tant from the perspective of betweenness centrality. All of these centralities can be defi ned on weighted, unweighted, directed, and undirected networks. For instance, the unweighted in-degree centrality of a node counts the total number of its incoming edges.
Clearly, all three measures expose a node’s different characteristics. For example, assume that
Figure 1 represents a network of cell-phone connections made by the members of a terrorist network; the weight of any given edge represents the number of calls made between the two ends of that edge. In this context, we can think of degree centrality as a simple tool to identify the terrorist(s) with the highest frequency of direct contacts. The hypothesis here is that such individuals are the most active within the network. Conversely, we can think of closeness centrality as a tool to identify the terrorist(s) whose message would spread fastest throughout the organization. Finally, betweenness centrality reveals the nodes that play a crucial role in passing the information from one individual in the network to another.
Although the standard measures in-deed deliver nontrivial insights, they can-not capture certain important aspects of centrality in a terrorist organization.
First, standard centrality measures are defined for networks in which we can consider at most a single real- valued weight for every node or edge. This assumption restricts the qualita-tive analysis of terrorist organizations. For instance, it might be difficult or even impossible for a single weight to reflect the fact that a terrorist possesses
certain critical resources and/or skills, such as financial endowments or ex-pertise in explosives. To illustrate this point, let us assume that node v1 in Figure 1 represents the terrorist who provides funding to the entire organiza-tion, while nodes v2, v6, and v11
repre-sent the available bomb experts. Now, let us try to express the fact that the funding and bomb expertise are both critical to carry out an attack, and that the former skill is possessed by a sin-gle individual, while the latter skill by three. To this end, we could for instance assign a weight of 10 to v1, a weight of
5 to every bomb expert, and a weight of 1 to every other node. Then, if an at-tack requires the funds, one bomb ex-pert, and at least two other members, we can set a threshold of 17 on the total weight of the terrorists needed to carry out an attack. Unfortunately, such a solution would not work, be-cause a group of three bomb experts and two other members (other than the one providing the funds) would cross this threshold, although they are unable to carry out any attack. This simple ex-ample illustrates how it could be hard for a quantitative analysis to replace a qualitative one.
The second deficiency of standard centrality measures is that they assess
the importance of each node by fo-cusing only on the role that this node plays by itself in the network. How-ever, in many applications, such an approach is inadequate as it fails to capture any positive or negative syn-ergies that might exist among differ-ent groups of nodes. To illustrate this point, let us consider the problem of finding a group of two individu-als that together have the highest in-fluence in the network. As a possible solution to this problem, let us fo-cus on unweighted degree centrality. With this measure, because nodes v1 and v2 have five neighbors each, and
because no other node has that many neighbors, then v1 and v2 each have
the highest centrality. One might then conclude that {v1, v2} is the most
influ-ential pair in the network. However, it is easy to observe that their spheres of influence (that is, their neighbor-hoods) overlap. In particular, both v1 and v2 are linked to v6, v7, and v8.
Thus, nodes v1 and v2 together have
only 7 unique neighbors, not 5 + 5 = 10 neighbors. To put it differently, in this example there is a negative syn-ergy between v1 and v2 due to their
overlapping spheres of influence. Tak-ing such synergies into consideration, we find that the most influential pair is in fact {v1, v11}, not {v1, v2}, because v1 and v11 together have eight unique
neighbors. This is despite the fact that v11 is actually ranked lower than v2.
To account for such synergies, and to quantify the importance of groups of nodes more accurately, Martin Everett and Steve Borgatti introduced the notion of group centrality.1
Intu-itively, group centrality is derived in the same way as standard centrality, but now we consider the functioning of a group of nodes rather than an individual node. For instance, as we have already established in Figure 1, the unweighted degree centrality of group {v1, v2} is 7, whereas the Figure 1. Sample network of 13 nodes with weighted edges. The letter F represents
a terrorist with the necessary funds, and the letter B represents a terrorist with bomb expertise.
2
2
2
2 1
1 1
1
1
1
1 1
1 1
1 1
F
B
unweighted degree centrality of group {v1, v11} is 8.
Unfortunately, the notion of group centrality has the following inherent drawback: given a network of size n, there are 2n groups of nodes to consider. Not only is this computationally prohib-itive, but it is also unclear how to con-struct a coherent ranking of individual nodes using such an exponential num-ber of group-wise results. For instance, we could consider the most impor-tant nodes to be those belonging to the most important group. Alternatively, we could rank individual nodes according to the average importance of the groups they belong to. In fact, one can think of an endless list of such alternatives. Things become even more complicated if, for instance, we are only interested in groups of nodes that are connected (that is, they induce a connected subgraph).
In summary, on top of evaluating the role that each node plays in a net-work’s topology, we have identified the following desirable properties to have in a centrality measure:
1. It should be able to account for the individual properties of each node and/or edge (expressed either quantitatively or qualitatively). 2. It should be able to consider not
only the functioning of individual nodes but also the positive or neg-ative synergies that might exist in different groups of nodes.
3. It should be able to aggregate all the above information in an in-formed and meaningful way to produce a coherent ranking of in-dividual nodes.
By adapting the standard central-ity measures to account for qualitative properties of the nodes and/or edges, and by extending those measures to groups, we can address properties 1 and 2. The third property, however, remains elusive. In the next section, we
argue that the game-theoretic approach to centrality measures has all the above properties, including the third property.
Game Theory for Network Analysis
This direction of research is based on the following observation: by having an exponential number of groups of nodes, each with an assigned value reflecting its centrality, we end up with exactly the same combinatorial structure as a coalitional game (see the “Coalitional Games” sidebar). As such, we can con-sider the network’s nodes to be the play-ers of a coalitional game, with the value of each group, or “coalition,” of nodes being equal to its group centrality. With this analogy, we can capitalize on de-cades of research in cooperative game theory, which focuses on analyzing the values of different coalitions to deter-mine each individual’s worth. In par-ticular, a coalitional game representing the network, along with an adopted so-lution concept, produce what we call a game-theoretic network centrality mea-sure, whereby a node’s centrality is the payoff of that node in the correspond-ing coalitional game; this payoff is com-puted according to the adopted solution concept, such as the Shapley value or the Myerson value. Let us consider a few examples.
Example 1: Detecting the Top-k Most Influential Terrorists
Given an unweighted and undirected network, one might represent such a setting with a coalitional game in which the value of a group of nodes, C, is computed as follows:
value(C) = the number of nodes in C+ the number of neighbors of C
Consider coalition {v1, v9} in
Fig-ure 1, for example. This coalition has a total of 7 neighbors—namely, v2, v3, v4, v5, v6, v7,and v8—and the size
of the coalition itself is 2. Therefore, value({v1, v9}) = 7 + 2 = 9. This
charac-teristic function can be interpreted as a function that counts the nodes that are directly influenced by a given co-alition; those nodes are the members themselves, as well as their neighbors. Having specified how to evaluate dif-ferent coalitions in the game, we now must specify how to compute the pay-off of each player in the game; that is, we need to specify a suitable solution concept. Let that solution concept be the Shapley value, for example. Re-call that the Shapley value of a node vi is a weighted average of its marginal contributions. Now, given the above characteristic function, the marginal contribution of vi to any given coali-tion is the change in the coalicoali-tion’s in-fluence that occurs when vi joins that coalition. In Figure 1, for example, the marginal contribution of v8 to
co-alition {v1, v9} equals 1, because
add-ing v8 to {v1, v9} brings one additional
node—namely, v11—under the
coali-tion’s influence. Formally, value({v1, v8, v9}) – value({v1, v9}) = 1. Thus, by
interpreting the Shapley value of vi as its centrality, we end up with a mea-sure with which the ranking of vi is proportional to the change in group influence that vi causes when joining different groups.
Example 2: The Myerson Value-Based Centrality
In the previous example, whether a coali-tion was connected or not did not have a direct bearing on the coalition’s value. Conversely, in this example, we will con-sider a Myerson’s graph-restricted game with the characteristic function defined as follows:2
value
the number of edges in the weight
For instance, the value of the connected coalition {v1, v5} in Figure
1 is 2, and the value of the connected coalition {v2, v3, v9, v10} is 2/3. In
contrast, the coalition {v1, v2, v3, v5, v9, v10} is disconnected, meaning
that the terrorists involved cannot communicate, and so they will proceed with their activities as two independent groups. Consequently, our graph-restricted game assigns the value of 2
+ 2/3 to {v1, v2, v3, v5, v9, v10}.
The fraction in the above character-istic function was proposed by Linde-lauf and colleagues, who provided the following rationale: “A terrorist orga-nization will try to shield its impor-tant players by keeping the frequency and duration of their interaction with others to a minimum. However, to be able to coordinate and control the at-tack, an important player needs to maintain relationships with other in-dividuals in the network.”3 Although
those authors focused on the Shapley value, Skibski and colleagues showed that the Myerson value has more in-teresting properties as a centrality measure.2
Example 3: Centrality with Skills Let us again consider the situation when the critical skills of nodes v1, v2, v6, and v11 are known to the
in-vestigators. Michalak and colleagues proposed the Myerson value-based
A
cooperative game models scenarios where individuals, or players, benefit from cooperation, and where bind-ing agreements are possible. This means it is possible for players to agree on which groups, or coalitions, to form, and on how the payoff, or value, of the formed coalitions shall be divided among the members. A coalition’s value is often assumed to depend entirely on the identities of the co-alition members. In such games, the function that assigns a value to every coalition is called the characteristic function, and is denoted by v.The vector that specifies each player’s share is called the
payoff vector. The main question here is which payoff vector should we adopt? One common way of addressing this question is to carefully select a number of desirable properties, and then prove that there exists only one possible payoff vector that satisfies all of those properties. The selected properties are then called the axioms of this unique vector. In this context, Shapley focused on scenarios where the players form the grand coalition—that is, one big coalition containing all players in the game.1 He proposed the following axioms:
• Efficiency. The grand coalition value is divided entirely among the players (that is, there are no leftovers).
• Null player. The share is zero for every “null player”—that is, a player whose membership in any coalition does not affect the value of that coalition.
• Symmetry. All “symmetric” players receive equal shares, where any two players are symmetric if replacing one with the other in any coalition makes no impact on that coali-tion’s value.
• Additivity. Given two games, G1 and G2, that involve the same set of players, and given a third game, G3, in which a coalition’s value is the sum of its value in G1 and in G2, the share of a player in G3 should be the sum of its share in G1 and in G2.
Shapley proved that there is a unique payoff vector satis-fying all of the above, whereby the share of a player i, called “the Shapley value of i,” is
Shapley value C n C
n v C i
i v
C N i
_ !
! !
\
= − −
{ }
( )
{ } ( ⊆
∑
1 ( ∪ ))−v C( )).The Shapley value of i is a weighted average of player i’s marginal contributions, where the marginal contribution of i to a coalition C is v(C∪ {i}) −v(C). More precisely, for any permutation of players, let us consider the marginal contribution of vi to the coalition consisting of all players that appear before it in the permutation. Then, the Shapley value is simply the average such marginal contribution taken over all permutations.
Myerson followed a similar approach, but for games defined on a graph G in which nodes represent players and edges represent communication channels.1 Thus, every coalition can be thought of as a subgraph of G. Myerson assumed that if a coalition, or a subgraph, C was not connected in G, then the value of C is simply the sum of the values of the connected components in C. The intuition is that disconnected components cannot communicate with one another, and so there is no value added when considering their union. Formally, the value of C is
w C v S
S C v C
( )= ( )
( )
∑
connected component in
if is connected in
otherwise.
C G
For such scenarios, Myerson proposed the following axioms:
• Component efficiency. The payoff of every connected component is divided entirely among its members (that is, there are no leftovers).
• Fairness. Any two connected players benefit equally from the bilateral connection between them.
Myerson proved that there is a unique payoff vector satisfying the above axioms, whereby the share of a player i, called the Myerson value of i, is
Myerson value_ iv=Shapley value_ iw. Reference
1. M. Maschler, E. Solan, and S. Zamir, Game Theory, Cambridge Univ. Press, 2013.
centrality measure that accounts for such qualitative data.4 Specifically,
they proposed the following charac-teristic function, where F denotes a terrorist capable of funding multiple attacks, B denotes a terrorist capable of handling bombs, and M denotes a terrorist skilled in martial arts:
value
t
the number of , in ( )
min C
B M C
= ×
2 h
he number of in if is connected,
th
F C C
( )
ee sum of values of the
connected componentss ofC otherwise.
Intuitively, this qualitative charac-teristic function represents scenarios in which every attack requires a terrorist with the necessary funding, in addition to one bomb expert and two terrorists skilled in martial arts. This can be gener-alized to more than just a single attack— for example, the terrorist providing the funds, combined with two bomb experts and four martial artists, can carry out two attacks. Naturally, the numbers and skills specified in the above function can be adjusted to better reflect the scenario under investigation. Note that, for each attack, the group must be connected to be able to coordinate its activities.
These examples demonstrate that game-theoretic centrality measures account for individual properties of nodes and edges, expressed both quan-titatively and qualitatively (property 1). They also analyze all groups (that is, subsets) of nodes (property 2). Finally, they use all those pieces of information to construct a coherent ranking of individual nodes (prop-erty 3). On top of this, by drawing parallels between networks and co-alitional games, we can build on a large body of literature on game-the-oretic solution concepts. Importantly, the game-theoretic approach to cen-trality places no assumptions on the coalition-evaluation function, nor the adapted solution concept, nor even the form of the game (see the “Flex-ibility of Game-Theoretic Central-ity” sidebar); these can be adjusted as necessary, thus providing a desirable degree of flexibility to capture a wide range of scenarios.
But alas, every rose has its thorns. All the advantages of game-theoretic centrality measures might never ma-terialize if we cannot compute those measures in the first place. Next, we discuss recent works that address this issue.
The Computational Challenge Unfortunately, due to their inher-ent combinatorial nature, comput-ing solution concepts for coalitional games is often computationally chal-lenging. In fact, already the size of the input (that is, the number of elements of the characteristic function) grows exponentially with the number of players. Luckily, in many cases the coalition values in the coalitional game have some underlying structure, which makes it possible to represent the characteristic function compactly. This has led to an important research direction in algorithmic game theory, aimed at identifying classes of games that admit such a compact represen-tation, and determining whether and how certain solution concepts are computable in polynomial time.
In the context of game-theoretic cen-trality, the underlying coalitional game is defined over the network, and is some-how influenced by the network topol-ogy. This suggests that, in some cases, such coalitional games can be (but do not have to be) represented compactly. For instance, this is the case for the games in Examples 1, 2, and 3 given ear-lier. However, having a compact repre-sentation does not necessarily imply that
A
n interesting property of game-theoretic centrality is its flexibility. Specifically, it can be adapted to a partic-ular application, along three general dimensions.• The form of the game.The game is usually assumed to be in characteristic function form—that is, a coalition’s value de-pends solely on the identities of its members. However, other forms may better model the application at hand. For in-stance, partition function games allow for a coalition’s value to be influenced by the way nonmembers are partitioned. Al-ternatively, generalized characteristic function games assume that the members of a coalition are ordered, and allow for a coalition’s value to be influenced by the order of its members. • The coalition-value function. Usually, an arbitrary coali-tion-value function is assumed. Thus, one can pick the function that best represents the worth of a coalition given the application at hand. For instance, Michalak and colleagues consider alternative such functions when study-ing the problem of information diffusion in networks.1
• The solution concept. This concept specifies the criteria the players use to decide which coalitions to form and which payoff vector to adopt. Different solution concepts are based on different prescriptive and normative considerations. Ex-amples include the Shapley value and Myerson value (see the “Coalitional Games” sidebar), which focus on fairness, and the core and the nucleolus, which focus on stability.2
A recent overview on the literature on game-theoretic centrality can be found in Tarkowski and colleagues.3
References
1. P.T. Michalak et al., “Efficient Computation of the Shapley Value for Game-Theoretic Network Centrality,” J.ArtificialIntelligence Research, vol. 46, 2013, pp. 607–650.
2. M. Maschler, E. Solan, and S. Zamir, Game Theory, Cambridge Univ. Press, 2013.
3. M. Tarkowski et al., “Game-Theoretic Network Centrality Measures: A Critical Survey,” mimeo, Univ. of Oxford, 2014.
the solution concept of interest is com-putable in polynomial time. In this re-spect, we can summarize the available results in the literature as follows:
• On one hand, negative results were obtained for game-theoretic cen-tralities in which, in the spirit of Myerson’s graph-restricted games, the value of a coalition explicitly depends on whether this coalition is connected or not. For instance, both the Myerson value-based centrality measures in Examples 2 and 3 are hard to compute.2
• On the other hand, positive results were obtained for various game-theoretic centralities in which, in the spirit of Everett and Borgatti, the value of a coalition of nodes is simply equal to its group centrality, meaning that whether the coalition is connected or not does not have an explicit bearing on its value.5
Next, we will analyze the Shapley value-based measure from Example 1, which is an instance of the above posi-tive results. After that, we will briefly discuss the state-of-the-art algorithm to compute the Myerson value-based cen-trality, which has exponential worst-case complexity. In practice, however, it solves problems of sparse networks with about 50 nodes in a matter of minutes on a modern workstation. Furthermore, for bigger problems, an efficient albeit inexact Monte Carlo sampling algorithm can be used.5
The Shapley Value-Based Centrality Computable in Polynomial Time Let us now see how the game-theoretic centrality from Example 1 can be com-puted in polynomial time.5 Recall that
the Shapley value can be interpreted as the average marginal contribution taken over all possible permutations of players (nodes) (see the “Coali-tional Games” sidebar). In particular,
to compute the Shapley value of vi,
we first identify all possible permu-tations of nodes in which vi makes a positive marginal contribution to the coalition C consisting of all the nodes that appear before vi in the permuta-tion. To this end, if vj is a neighbor of vi, we must ask what is the necessary and sufficient condition for node vi to “marginally contribute” its neighbor vj to C? This clearly happens if and only if neither vj nor any of its neighbors are present in C (in this case, when vi joins C, its neighbor vj becomes under the influence of C). In Figure 1, for ex-ample, v2 marginally contributes its
neighbor v9 to a coalition C if and only
if neither v9 nor any of its neighbors
(that is, v2 and v3) are members of C.
Now, let us count the number of pos-sible permutations in which v2
margin-ally contributes its neighbor v9 to the
coalition C consisting of all the nodes that appear before v2 in the
permuta-tions. To do so,
• We randomly choose |{v2, v3, v9}|=
3 positions in a permutation consist-ing of all 13 nodes from Figure 1.
maining two positions. This can be done in 2! ways.
• The remaining elements can be ar-ranged in (13 – 3)! = 10! ways.
Thus, there are in total 13 3
2!10! =
2075673600 permutations in which v2 marginally contributes v9. Given that there are in total 13! = 6227020800 permutations, the fraction of the Shap-ley value of v2 that is due to contrib-uting v9 is 1/3. To compute the total value of the Shapley value of v2, we should perform the above procedure
for v2 and every neighbor of v2. The general formula is as follows:
ShapleyValue
The algorithm that implements this expression for all nodes in the network iterates exactly once through all nodes and their neighbors. Thus, its running time is O(|V| +|E|) , where
|V| is the number of nodes and |E| is the number of edges in the network.
Recall that the Shapley value is used as a centrality measure in our ex-ample. Thus, by looking at the above formula, one can see where a node’s centrality comes from. In particular, if a node has a high degree, the num-ber of terms in its Shapley value sum-mation is high. However, the terms themselves will be inversely related to the degree of neighboring nodes. Thus, a node has high centrality not only when its degree is high, but also whenever the degree of its neighbor-ing nodes is low. To put it differently, the power comes from being con-nected to many who are powerless— a phenomenon well-recognized in the centrality literature.
An Algorithm for the Myerson Value-Based Centrality
way it traversed the graph; enumerat-ing all induced connected subgraphs required breadth-first search (BFS), whereas identifying cut vertices re-quired depth-first search (DFS).
To address this issue, Skibski and colleagues proposed the first algo-rithm that performs both opera-tions simultaneously.2 The main
trick is to perform the first operation (enumerating all induced connected subgraphs) using DFS rather than BFS, thus making it compatible with the other operation’s performance (iden-tifying cut vertices). Broadly speak-ing, the DFS enumeration algorithm starts with a subgraph consisting of a single node, and gradually expands the subgraph to (some of) its neigh-boring nodes in a DFS manner. This is done using a divide-and-conquer tech-nique, which works as follows: when-ever a neighbor is found that has not yet been visited by the algorithm, the calculations are split into two parts, the first with the neighbor added to the subgraph, and the second with the neighbor marked as forbidden. This entire process is repeated recursively such that eventually all induced sub-graphs are enumerated without any redundancies (that is, without per-forming an operation twice). For a detailed description of the algorithm, as well as the pseudocode, see Oskar Skibski and colleagues2
Case Study: World Trade Center, 9/11
In the already classic work, Valdis E. Krebs constructed the World Trade Center 9/11 terrorist network from publicly available sources and used standard centrality measures to de-termine the key terrorists.6 Let us
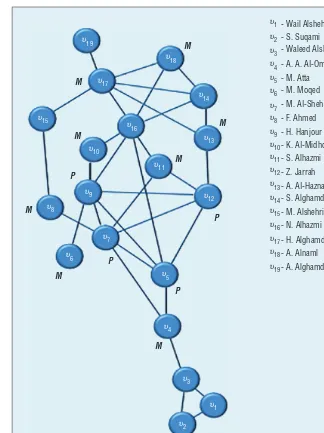
fo-cus on the core of the 9/11 network composed of 19 hijackers with 32 relationships, as illustrated in Fig-ure 2. To hijack the four planes on 11 September 2001, the terrorists needed
to split into four groups. Each group had to contain at least one terrorist with pilot training (P) and some ter-rorists skilled in martial arts (M) in order to take control over the crew and the cabin. To fulfill these require-ments, terrorists S. Suqami and A.A. Al-Omari took part in martial arts training in the weeks before the attack; it is unknown who else was skilled in martial arts. Therefore, we assigned this skill to seven other terrorists chosen uniformly at random, and
assumed that two terrorists with such skills were needed per flight.
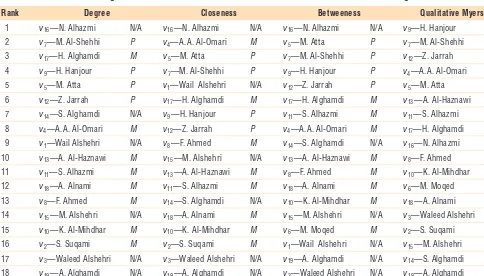
Let us now consider a qualita-tive characteristic function similar to that of Example 3, but now modified such that a P-terrorist (pilot) and two M-terrorists (martial arts) are needed to carry out a single attack. Table 1 compares the (qualitative) Myerson-value-based centrality with the other standard centralities for Figure 2. We observe that, as expected, the new cen-trality measure promotes the terrorist
- Wail Alshehri
Figure 2. World Trade Center 9/11 terrorist network.3,6 The letter P stands for a
with the necessary skills. Interest-ingly, the M-terrorist A.A. Al-Omari is ranked higher than the P-terrorist M. Atta. In other words, when consider-ing the positions (in the network) and the skills of different terrorists, it turns out that the martial arts skill of A.A. Al-Omari is more often indispensable to increasing the attack capabilities of connected coalitions of terrorists than the pilot skills of M. Atta. Con-versely, N. Alhazmi—the terrorist with no skills, who is ranked at the top by all three standard centrality measures (unable to recognize skills)—is now ranked ninth.
T
he problem of identifying key members of a terrorist network is an important topic in the literature; it has attracted significant interest within the social network analysis community and well beyond. In this article, we argued that this problem requires a centrality measure that canaccount for the properties of each ter-rorist, compute the synergies in vari-ous groups (that is, subsets) of those terrorists, and aggregate all this in-formation into a coherent ranking of individual terrorists. This was not possible until recently, when game-theoretic centrality measures were proposed. We showed how these new measures capitalize on decades of re-search in cooperative game theory, thus providing a rich pool of solu-tion concepts to evaluate individuals on the basis of their performance in different groups. Unfortunately, these new measures are inherently com-plex and raise various computational challenges, even for relatively small networks. However, we showed how to overcome some of these computa-tional challenges, following recent re-sults from algorithmic game theory. Hopefully, the further development of these measures will shed more light on the dark nature of covert terrorist organizations.
Acknowledgments
Tomasz Michalak and Michael Wooldridge were supported by the European Research Council under Advanced Grant 291528 (“RACE”). Oskar Skibski and Tomasz Michalak were supported by the Polish National Science grant DEC-2013/09/D/ ST6/03920.
References
1. M.G. Everett and S.P. Borgatti, “The Centrality of Groups and Classes,”
J. Mathematical Sociology, vol. 23, no. 3, 1999, pp. 181–201.
2. O. Skibski et al., “Algorithms for the Shapley and Myerson Values in Graph-Restricted Games,” Proc. 13th Int’l Conf. Autonomous Agents and Multiagent Systems (AAMAS 2014), 2014, pp. 197–204.
3. R. Lindelauf, H. Hamers, and B. Husslage, “Cooperative Game Theoretic Centrality Analysis of Terrorist Networks: The Cases of Jemaah Islamiyah and Al Qaeda,” European J. Operational Research, vol. 229, no. 1, 2013, pp. 230–238.
Table 1. Comparison of rankings for the World Trade Center 9/11 network from Figure 2, given different centrality measures. (The Degree, Closeness, and Betweenness columns are from Lindelauf and colleagues.3)
Rank Degree Closeness Betweeness Qualitative Myerson
1 v16—N. Alhazmi N/A v16—N. Alhazmi N/A v16—N. Alhazmi N/A v9—H. Hanjour P
2 v7—M. Al-Shehhi P v4—A.A. Al-Omari M v5—M. Atta P v7—M. Al-Shehhi P
3 v17—H. Alghamdi M v5—M. Atta P v7—M. Al-Shehhi P v12—Z. Jarrah P
4 v9—H. Hanjour P v7—M. Al-Shehhi P v9—H. Hanjour P v4—A.A. Al-Omari M
5 v5—M. Atta P v1—Wail Alshehri N/A v12—Z. Jarrah P v5—M. Atta P
6 v12—Z. Jarrah P v17—H. Alghamdi M v17—H. Alghamdi M v13—A. Al-Haznawi M
7 v14—S. Alghamdi N/A v9—H. Hanjour P v11—S. Alhazmi M v11—S. Alhazmi M
8 v4—A.A. Al-Omari M v
12—Z. Jarrah P v4—A.A. Al-Omari M v17—H. Alghamdi M
9 v1—Wail Alshehri N/A v8—F. Ahmed M v14—S. Alghamdi N/A v16—N. Alhazmi N/A
10 v13—A. Al-Haznawi M v15—M. Alshehri N/A v13—A. Al-Haznawi M v8—F. Ahmed M
11 v11—S. Alhazmi M v13—A. Al-Haznawi M v8—F. Ahmed M v10—K. Al-Mihdhar M
12 v18—A. Alnami M v11—S. Alhazmi M v18—A. Alnami M v6—M. Moqed M
13 v8—F. Ahmed M v14—S. Alghamdi N/A v10—K. Al-Mihdhar M v18—A. Alnami M
14 v15—M. Alshehri N/A v18—A. Alnami M v15—M. Alshehri N/A v3—Waleed Alshehri N/A
15 v10—K. Al-Mihdhar M v10—K. Al-Mihdhar M v6—M. Moqed M v2—S. Suqami M
16 v2—S. Suqami M v2—S. Suqami M v1—Wail Alshehri N/A v15—M. Alshehri N/A
17 v3—Waleed Alshehri N/A v3—Waleed Alshehri N/A v19—A. Alghamdi N/A v14—S. Alghamdi N/A
18 v19—A. Alghamdi N/A v19—A. Alghamdi N/A v3—Waleed Alshehri N/A v19—A. Alghamdi N/A
4. T.P. Michalak et al., The Qualitative Game-Theoretic Centrality Measure, Univ. of Oxford, 2014.
5. P.T. Michalak et al., “Efficient Computation of the Shapley Value for Game-Theoretic Network Centrality,” J.ArtificialIntelligence Research, vol. 46, 2013, pp. 607–650. 6. V.E. Krebs, “Mapping Networks of
Terrorist Cells,” Connections, vol. 24, 2002, pp. 43–52.
Tomasz P. Michalak is a research assistant in the Department of Computer Science at
the University of Oxford and an assistant professor in the Institute of Informatics at the University of Warsaw. Contact him at [email protected].
Talal Rahwan is an assistant professor in the Computing and Information Science Depart-ment at the Masdar Institute of Science and Tech nology. Contact him at trahwan@gmail. com.
Oskar Skibski is an assistant professor in the Department of Computer Science at
Kyushu University. Contact him at oskibski@ inf.kyushu-u.ac.jp.
Michael Wooldridge is a professor in the De-partment of Computer Science at the University of Oxford. Contact him at michael.wooldridge@ cs.ox.ac.uk.
Selected CS articles and columns are also available for free at http://ComputingNow.computer.org.
PURPOSE: The IEEE Computer Society is the world’s largest association of computing professionals and is the leading provider of technical information in the field.
MEMBERSHIP: Members receive the monthly magazine Computer, discounts, and opportunities to serve (all activities are led by volunteer members). Membership is open to all IEEE members, affiliate society members, and others interested in the computer field.
COMPUTER SOCIETY WEBSITE: www.computer.org
Next Board Meeting: 26–30 January 2015, Long Beach, CA, USA
EXECUTIVE COMMITTEE
President: Dejan S. Milojicic
President-Elect: Thomas M. Conte; Past President: David Alan Grier;
Secretary: David S. Ebert; Treasurer: Charlene (“Chuck”) J. Walrad; VP, Educational Activities: Phillip Laplante; VP, Member & Geographic Activities: Elizabeth L. Burd; VP, Publications: Jean-Luc Gaudiot; VP, Professional Activities: Donald F. Shafer; VP, Standards Activities: James W. Moore; VP, Technical & Conference Activities: Cecilia Metra; 2014 IEEE Director & Delegate Division VIII: RogerU. Fujii; 2014 IEEE Director & Delegate Division V: Susan K. (Kathy) Land; 2014 IEEE Director-Elect & Delegate Division VIII: John W. Walz
BOARD OF GOVERNORS
Term Expiring 2014: Jose Ignacio Castillo Velazquez, David S. Ebert, Hakan Erdogmus, Gargi Keeni, Fabrizio Lombardi, Hironori Kasahara, Arnold N. Pears
Term Expiring 2015: Ann DeMarle, Cecilia Metra, Nita Patel, Diomidis Spinellis, Phillip Laplante, Jean-Luc Gaudiot, Stefano Zanero
Term Expriring 2016: David A. Bader, Pierre Bourque, Dennis Frailey, Jill I. Gostin, Atsuhiro Goto, Rob Reilly, Christina M. Schober
EXECUTIVE STAFF
Executive Director: Angela R. Burgess; Associate Executive Director & Director, Governance: Anne Marie Kelly; Director, Finance & Accounting:
John Miller; Director, Information Technology & Services: Ray Kahn;
Director, Membership Development: Eric Berkowitz; Director, Products & Services: Evan Butterfield; Director, Sales & Marketing: Chris Jensen COMPUTER SOCIETY OFFICES
Washington, D.C.: 2001 L St., Ste. 700, Washington, D.C. 20036-4928
Phone: +1 202 371 0101 • Fax: +1 202 728 9614
Email: [email protected]
Los Alamitos: 10662 Los Vaqueros Circle, Los Alamitos, CA 90720
Phone: +1 714 821 8380 • Email: [email protected]
MEMBERSHIP & PUBLICATION ORDERS
Phone: +1 800 272 6657 • Fax: +1 714 821 4641 • Email: [email protected]
Asia/Pacific: Watanabe Building, 1-4-2 Minami-Aoyama, Minato-ku, Tokyo
107-0062, Japan • Phone: +81 3 3408 3118 • Fax: +81 3 3408 3553 •
Email: [email protected] IEEE BOARD OF DIRECTORS
President: J. Roberto de Marca; President-Elect: Howard E. Michel; Past President: Peter W. Staecker; Secretary: Marko Delimar; Treasurer:
John T. Barr; Director & President, IEEE-USA: Gary L. Blank; Director & President, Standards Association: Karen Bartleson; Director & VP, Educational Activities: Saurabh Sinha; Director & VP, Membership and Geographic Activities: Ralph M. Ford; Director & VP, Publication Services and Products: Gianluca Setti; Director & VP, Technical Activities: Jacek M. Zurada; Director & Delegate Division V: Susan K. (Kathy) Land;
Director & Delegate Division VIII: Roger U. Fujii