Ownership structure is considered to be the most influential component in corporate govern-ance; it is also closely related to firm performance. The current research analyzes the effect of ownership structure (both insider ownership—board and managerial ownership, blockholder ownership—and institutional ownership concentration— pressure-insensitive and pres-sure-sensitive) on firm performance (industry adjusted return on asset/IAROA) based on its life cycle. Life cycle is incorporated into the research to examine whether the effect of own-ership structure on firm performance differs at each stage of the life cycle. The current re-search uses imbalanced panel data consisting of 695 observations of sample firms from the manufacturing, IT, and multimedia firms during the 2005-2010 period. The results show that: (1) insider ownership has a significantly non-linear influence on IAROA, indicated by a U-shaped curve (2) blockholders have a significantly positive effect on IAROA in firms at the mature stage; on the contrary, the effect is significantly negative in firms at the growth stage (3) institutional ownership concentration has a significantly negative effect on IAROA across the samples and a significantly positive effect on firms at the mature stage, and (4) insensitive and pressure-sensitive institutional ownerships have a positive and sig-nificant effect on IAROA in firms at the mature stage; on the contrary, the effect is negative and significant in firms at the growth stage..
© 2012 IRJBS, All rights reserved. Keywords:
ownership structure, firm performance, life cycle stage, imbalanced panel
Corresponding author: * [email protected]
Nur Firdaus
*, Retno Kusumastuti
** *LIPI, Jakarta**Universitas Indonesia, Jakarta
A R T I C L E I N F O A B S T R A C T
C
orporate governance is a much-discussed topic of conversation in the world of global business. The 1997 economic crisis in Asia, global economic pressure in 2008, and the downfall of Enron in 2001 and Worldcom in 2002 in the US,became the starting points where the importance of good corporate governance practices was acknowledged (Solomon, 2007; Liang et al., 2011). According to Parkinson, corporate governance is a supervisory and control process intended to ensure
Vol. 5 | No. 3 ISSN: 2089-6271
How Ownership Structure Influences
that the firm management acts in accordance with the stockholders’ interest (Solomon, 2007). In the preamble to Organization for Economic Cooperation and Development (OECD), corporate governance is deemed as a key element in improving the efficiency of economy and growth (Holm and Schøler, 2008). Agency problems arise from the relationship between stockholders and managers, due to a conflict of interests in the firm (Fazlzadeh et al., 2011). The conflict of interests eventually leads to agency cost. Jensen and Meckling (1976) define agency cost as the overall cost that includes the monitoring expenses paid for by the principals, expenses for firm relations with agents, and residual losses. In theoretical literature, there are six mechanisms to keep agency cost under control in the corporate governance process (Fazlzadeh et al., 2011).
Perrini et al., (2008) confirms that the effect of ownership structure on firm performance has become an important subject and an ongoing topic of debate in the financial literature. It begins with the research conducted by Berle and Means (1932) and Chandler (1962) as quoted by Perrini et al., (2008) on the connection between ownership concentration and firm performance, as well as the actual role of the management. Basically there are two dimensions in ownership structure: insider ownership or managerial ownership and institutional ownership. Morck et al., (1988) studied the connection between managerial ownership and the firm market value, and the connection is non-monotonic in nature.
Insider or managerial ownership is essentially a method to reduce agency cost (Crutchley and Hansen, 1989). Rose (2005) confirms that, in order to synchronize the interest of the man-agement and that of investors from outside the firm, incentive is provided for the managers, in that the management becomes a co-owner of the firm. Incentive for managers in the form of stock ownership is expected to reduce agency cost. The managers will implement policies that conform to
firm objectives, namely maximizing the values of stockholders, including the managers themselves.
Meanwhile, Pound (1988) studied the effect of institutional ownership on firm performance (Liang et al., 2011). Pound offers three hypotheses on the relationship between stock ownership by institutional investors and firm performance: efficient monitoring, conflict of interest, and strategic alignment. Cornet et al., (2007), Huse (2007) and Jara-Bertin et al., (2012) divide institutional ownership into two types: pressure-sensitive and pressure-inpressure-sensitive/resistant. Pressure-sensitive ownership refers to investors who not only invest in the form of ownership, but also have business partners, such as with banks, pension funds, holding firms/group firms, as well as with non-financial firms with business relationships, such as in sales, purchases, and others.
In Indonesia, there have been a number of studies on the effect of ownership structure on firm performance. Research by Suranta and Midiastuty (2003) shows a linear and negative con-nection between the managerial ownership structure and firm value. Research by Sari (2004) shows that the ownership structure (the largest stock ownership, stock ownership by the public, foreign stock ownership, stock ownership by financial institutions, stock ownership by non-financial firms, and managerial ownership) affected firm value during the 1993-2000 period in firms listed in the Indonesian Stock Exchange.
Unlike in previous researches, Liang et al., (2011) examined the role of ownership structure on firm performance by taking into account the firm’s life cycle. The research was conducted on firms listed in the Taiwan Stock Exchange during the period between the two global financial crises in 1999 and 2008.
METHODS
structure ownership on firm performance based on its life cycle during the 2005-2010 period. Samples are the manufacturing, IT, and multimedia firms. The three firm categories are chosen because they, especially manufacturing, contributed significantly during the 2000-2010 period to the Indonesian GDP (Ministry of Industry, 2011). The sample data is acquired from the Indonesian Stock Exchange (BEI), Bapepam-LK (Indonesia Capital Market and Financial Institution Supervisory Agency), and the Indonesian Capital Market Directory (ICMD). The samples consist of 121 firms; the outliers are deleted, resulting in an imbalanced panel data with 121 firms and 695 firm-year observations.
In categorizing the firms based on their life cycles, the current researcher uses variables that refer to Ramaswamy et al., (2008), Liang and Lin (2008), and Liang et al., (2011) (see Table 1). The life cycle stages used in the current research are growth, mature, and stagnant. Each stage is categorized as follows: 0 for growth; 1 for mature; and 2 for stagnant. The variables used to describe the characteristics of each cycle are shown in Table 1. The scores from the six variables are then combined, where the minimum value is 0 and the maximum value is 10. The total score is divided into three score ranges: growth stage (0 – 3), mature stage (4 – 6), and stagnant stage (7 – 10). From the categorization of firm life cycle, we see that the growth stage consists of 199 firm-year observations, the mature stage 385 firm-firm-year observations, and the stagnant stage 111 firm-year observations.
The variable of ownership structure in this research is insider ownership (INSID) and institutional ownership (INS). INSID is the fraction of shares held by insider—board and managerial. INSID is divided into two categories which is board and manager ownership (BMO) and blockholder ownership (BLOCK). BMO is the fraction of shares less than 5% and BLOCK is over 5% (Abor and Biekpe, 2006). Furthermore, INS is the fraction of shares held by the institutional investors. Herfindahl Index was used to
measure the institutional ownership concentration. INS is categorized into two types which is pressure-insensitive (INSPRI) and pressure-sensitive (INSPRS). The firm performance is measured by using industry-adjusted return on asset (IAROA). IAROA equals firm ROA minus ¬industry-average ROA. The previous studies, Tobins’ Q and ROA were commonly used to measure firm performance. According to Liang et al., (2011), the use of Tobins’ Q and ROA have weaknesses. In the developing countries, accounting standard is not applied well and the profit rate may not be absolutely accurate to measure firm performance (Wiwattanakantang, 2001). However, ROA can be used as the measurement of firm performance because ROA focuses on the current performance. Meanwhile, Tobins’ Q reflects growth opportunities or expectations of the firms’ prospects in the future years and Tobins’ Q regression would be more susceptible to endogeneity problems (Cornett et al., 2007). In addition, the control variables are firm size (NLA—natural logarithm of asset), leverage (LER— liabilities to equity ratio), research expenditures rate (RD— R&D expenditures to sales), marketing expenditure rate (ME— marketing expenditures to sales), and asset growth rate (AG— asset growth divided the current net assets).
The current research uses two research models:
Model 1
Model 2 RESULTS AND DISCUSSION
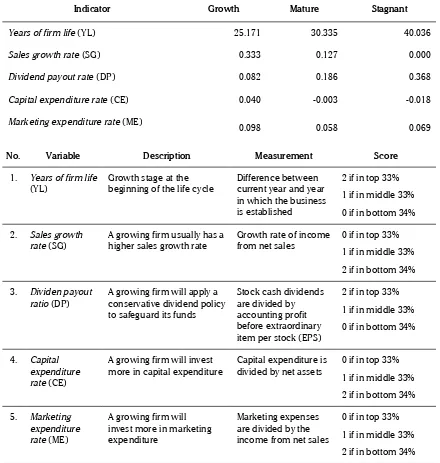
Table 1 shows the descriptive statistics for the variables used to measure the firms’ life cycle in each life cycle category. The variables include years of firm life (YL), sales growth rate (SG), dividend payout rate (DP), capital expenditure rate (CE), and marketing expenditure rate (ME).
Indicator Growth Mature Stagnant
Years of firm life (YL) 25.171 30.335 40.036
Sales growth rate (SG) 0.333 0.127 0.000
Dividend payout rate (DP) 0.082 0.186 0.368
Capital expenditure rate (CE) 0.040 -0.003 -0.018
Marketing expenditure rate (ME) 0.098 0.058 0.069
No. Variable Description Measurement Score
1. Years of firm life
(YL) Growth stage at the beginning of the life cycle Difference between current year and year in which the business is established
2 if in top 33% 1 if in middle 33% 0 if in bottom 34% 2. Sales growth
rate (SG) A growing firm usually has a higher sales growth rate Growth rate of income from net sales 0 if in top 33%1 if in middle 33% 2 if in bottom 34% 3. Dividen payout
ratio (DP) A growing firm will apply a conservative dividend policy to safeguard its funds
Stock cash dividends are divided by accounting profit before extraordinary item per stock (EPS)
2 if in top 33% 1 if in middle 33% 0 if in bottom 34%
4. Capital expenditure rate (CE)
A growing firm will invest
more in capital expenditure Capital expenditure is divided by net assets 0 if in top 33%1 if in middle 33% 2 if in bottom 34% 5. Marketing
expenditure rate (ME)
A growing firm will invest more in marketing expenditure
Marketing expenses are divided by the income from net sales
0 if in top 33% 1 if in middle 33% 2 if in bottom 34%
Table 1. Variable Descriptions and Measurement of Life Cycle Stages
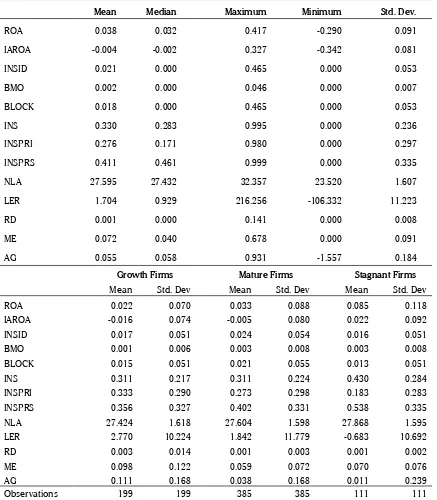
Table 2, the mean of ROA and IAROA are relatively low. The mean of insider and institutional ownerships represent 2.10% and 33.00%. In Indonesia, some firms do not have insider ownership so the mean of insider ownership is relatively low. Using the natural logarithm of
asset, the mean of firm size is 27.59. The average of debt to equity ratio is over 100%. The value of R&D expenditure is low at 0.10% while marketing expenditure is at 7.20%. The mean value of asset growth is at 5,5% of total assets..
Mean Median Maximum Minimum Std. Dev.
ROA 0.038 0.032 0.417 -0.290 0.091 IAROA -0.004 -0.002 0.327 -0.342 0.081 INSID 0.021 0.000 0.465 0.000 0.053 BMO 0.002 0.000 0.046 0.000 0.007 BLOCK 0.018 0.000 0.465 0.000 0.053 INS 0.330 0.283 0.995 0.000 0.236 INSPRI 0.276 0.171 0.980 0.000 0.297 INSPRS 0.411 0.461 0.999 0.000 0.335 NLA 27.595 27.432 32.357 23.520 1.607 LER 1.704 0.929 216.256 -106.332 11.223 RD 0.001 0.000 0.141 0.000 0.008 ME 0.072 0.040 0.678 0.000 0.091 AG 0.055 0.058 0.931 -1.557 0.184
Growth Firms Mature Firms Stagnant Firms
Mean Std. Dev Mean Std. Dev Mean Std. Dev ROA 0.022 0.070 0.033 0.088 0.085 0.118 IAROA -0.016 0.074 -0.005 0.080 0.022 0.092 INSID 0.017 0.051 0.024 0.054 0.016 0.051 BMO 0.001 0.006 0.003 0.008 0.003 0.008 BLOCK 0.015 0.051 0.021 0.055 0.013 0.051 INS 0.311 0.217 0.311 0.224 0.430 0.284 INSPRI 0.333 0.290 0.273 0.298 0.183 0.283 INSPRS 0.356 0.327 0.402 0.331 0.538 0.335 NLA 27.424 1.618 27.604 1.598 27.868 1.595 LER 2.770 10.224 1.842 11.779 -0.683 10.692 RD 0.003 0.014 0.001 0.003 0.001 0.002 ME 0.098 0.122 0.059 0.072 0.070 0.076 AG 0.111 0.168 0.038 0.168 0.011 0.239 Observations 199 199 385 385 111 111
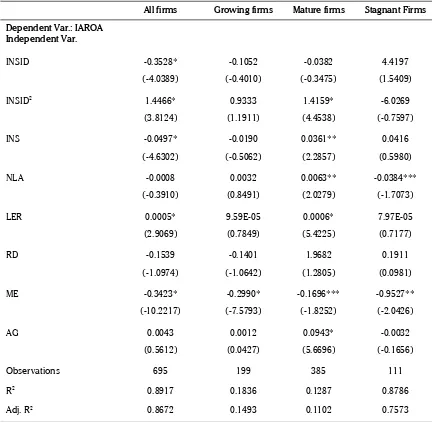
Table 3, which is the result of the regression of Model 1, shows that the INSID coefficient value is -0.3528; it is significant on the 1% level and is negatively related to firm performance (t-stat = -4.0389). The INSID2 coefficient is 1.4466 which is
significant on the 1% level and is positively related to firm performance (t-stat = 3.8124). This result differs from the research by Liang et al., (2011) where the INSID coefficient is positive and the INSID2 coefficient is negative. This result by Liang
et al., (2011) is consistent with the convergence of interest and entrenchment effect hypotheses.
According to the convergence of interest hypothesis, the connection between managerial ownership and firm performance is positive. This is based on the idea that the managers’ remuneration depends on the total of firm value creation in the form of residual claim. When the level of managerial ownership increases, managers share a larger part in paying the expenses for activities that decrease firm value. On the contrary, according to the entrenchment effect hypothesis, the connection between managerial ownership and firm performance is negative. This is based on the fact that managers
All firms Growing firms Mature firms Stagnant Firms Dependent Var.: IAROA Observations 695 199 385 111 R2 0.8917 0.1836 0.1287 0.8786
Adj. R2 0.8672 0.1493 0.1102 0.7573
Table 3. Result of Regression for Model 1
control a large part of the firm’s substantial asset and therefore have sufficient effect to secure the desired work relationship, including an attractive salary. The advantages gained through their reputation (superior qualifications and appealing personality) can determine their voting power, which constitutes the managers’ control over their ownership of the firm.
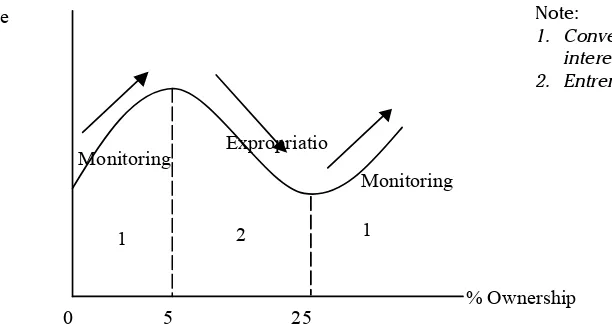
From the connection between the two hypotheses, shown with a non-linear curve, we see that insider ownership positively influences firm performance up to a certain point. This means increasing insider ownership has positive effects on firm performance; however, increasing insider ownership on purpose reduces firm performance. The connection is shown on the inverted U-shaped curve in Figure 1.
In the current research, a more thorough examination is conducted on the non-linear connection where INSID is divided into three categories based on the range of ownership: 0-5% of ownership, 5%-25% of ownership, and more than 25% of ownership. The categorization is based on the research by Morck et al., (1988). For example, if insider ownership is 27%, on the 0-5% range it is noted at 5%; on the 5%-25% range noted at 20%; and on the more than 25% range noted at 2%. The examination shows that a 0-5% ownership
has a positive effect, 5%-25% ownership a negative effect, and more than 25% ownership a positive effect. This indicates that 0-5% and more than 25% ownerships tend toward the convergence of interest hypothesis, while the 5%-25% ownership tends toward the entrenchment effect hypothesis.
Institutional ownership (INS) in the current research refers to the concentration of institutional ownership calculated using the Herfindahl Index. In all the samples in Model 1, the INS coefficient is -0.0497 which is significant on the 1% level; this means it is negatively connected to firm performance (t-stat = -4.6302). This is consistent with findings by Fazlzadeh et al., (2011), where the concentration of institutional ownership has a negative and significant effect on firm performance. Negative effect occurs when investors have a large number of stocks, and the management, impressed with their dominance, does not provide benefits or advantages for all stockholders. The management only serves stockholders from certain institutions who hold a majority of the firm’s stocks, which will lead to failure in financial performance. According to Sari (2004), ownership concentration in a firm leads to a situation where agency cost exceeds firm profit. One of the reasons is that stockholders, who also control the firm, are allowed to instruct managers in their management of the firm (in operational
Note:
1. Convergence of interest
2. Entrenchment
Firm Value
% Ownership
1 2 1
Monitoring Expropriation
Monitoring
0 5 25
activities, investment, and funding). Thus, managers tend to follow orders from stockholders who also control the firm. In addition, the negative effect from concentrated institutional ownership on firm performance is also visible in firms at the growth stage, where the coefficient is -0.0190 (t-stat = -0.5062), but the effect is insignificant.
Unlike in the overall sample results, INS has a positive and significant effect on firm performance in mature firms; this is shown by a coefficient of 0.0361 on the 5% level (t-stat = 2.2857). This is consistent with the research by Kapopoulos and Lazaretou (2007) and Perrini et al., (2008); they discovered that a more concentrated ownership
structure positively influences firm profitability. A concentrated ownership will encourage a more intensive monitoring and better financial performance. There is an advantage in concentrated stock ownership and having stockholders who control the firm: the stockholders’ ability to monitor and discipline the management will both obligate the management to submit regular reports and directly influence the organization (Surya and Yustiavananda, 2008). Similar results are shown in stagnant firms, although the effect is insignificant and the coefficient is 0.0416 (t-stat = 0.5980).
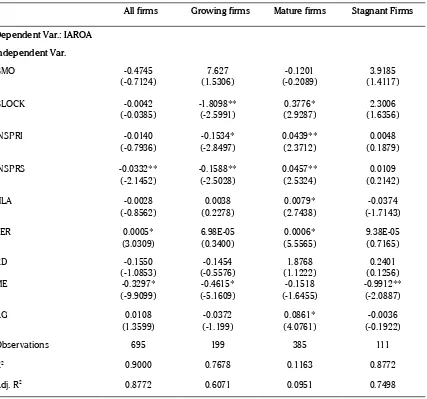
Table 4 shows the result of regression for Model 2, namely through the breaking down of the
All firms Growing firms Mature firms Stagnant Firms
Dependent Var.: IAROA Independent Var.
BMO -0.4745
(-0.7124) (1.5306)7.627 (-0.2089)-0.1201 (1.4117)3.9185 BLOCK -0.0042
(-0.0385) -1.8098**(-2.5991) (2.9287)0.3776* (1.6356)2.3006 INSPRI -0.0140
(-0.7936) (-2.8497)-0.1534* 0.0439**(2.3712) (0.1879)0.0048 INSPRS -0.0332**
(-2.1452) -0.1588**(-2.5028) 0.0457**(2.5324) (0.2142)0.0109 NLA -0.0028
(-0.8562) (0.2278)0.0038 (2.7438)0.0079* (-1.7143)-0.0374 LER 0.0005*
(3.0309) 6.98E-05(0.3400) (5.5565)0.0006* 9.38E-05(0.7165) RD -0.1550
(-1.0853) (-0.5576)-0.1454 (1.1222)1.8768 (0.1256)0.2401 ME -0.3297*
(-9.9099) (-5.1609)-0.4615* (-1.6455)-0.1518 -0.9912**(-2.0887)
AG 0.0108
(1.3599) (-1.199)-0.0372 (4.0761)0.0861* (-0.1922)-0.0036 Observations 695 199 385 111 R2 0.9000 0.7678 0.1163 0.8772
Adj. R2 0.8772 0.6071 0.0951 0.7498
Table 4. Result of Regression for Model 2
INSID (BMO and BLOCK) and INS (INSPRI and INSPRS) ownership structures. In all the samples and firms at the stagnant stage, both BMO and BLOCK do not have a significant effect. In firms at the growth and mature stages, blockholder ownership (BLOCK) has a significant effect, but it is insignificant to the board and managers (BMO) proxy. Blockholder ownership in firms at the growth stage has a negative and significant effect on firm performance with a coefficient of -1.89098 on the 5% level (t-stat = -2.5991). Meanwhile, in mature firms, blockholder ownership has a positive and significant effect on firm performance with a coefficient of 0.3776 on the 1% level (t-stat = 2.9287). Blockholder ownership positively influences firm performance, because when managerial ownership increases, managers share a larger part in paying the expenses for activities that decrease firm value (Rose, 2005). Thus, managers will prevent the decrease of firm value, as they have paid a large amount in proportion to their level of ownership in the firm. The positive effect of blockholder ownership is found in mature firms; in such firms, when moderate sales and profit margin begin to decrease, the strategy taken to prevent this is to distribute a larger share of managerial ownership. Therefore, managers will strive to improve firm performance in order to obtain greater returns. On the contrary, in firms at the growth stage where the sales and profit margin are high, a larger managerial ownership will reduce firm performance. Blockholder ownership will result in entrenchment, in which managers or agents are able to expropriate the wealth of minority stockholders (Thomsen et al., 2006; Morck et al., 1988).
On the split of institutional ownership for all the samples, INSPRI has a negative and insignificant effect with a coefficient of -0.0140 (t-stat = 0.7936). Otherwise, INSPRS has a negative and significant effect at 5% level. This result is consistent with Bhattacharaya and Graham (2007). Pressure-sensitive investors are less willing to against management decisions and to follow them because
they want to protect their business relations. When the investors just follow the management, they can not monitor well. This result is consistent with strategic-alignment hypothesis (Pound, 1988, in McConnell and Servaes, 1990).
In firms at the growth stage, INSPRI and INSPRS have a negative and significant effect at the 1% and 5% levels respectively. The coefficient for INSPRI is -0.1534 (t-stat = -2.8497) and for INSPRS -0.1588 (t-stat = -2.5028). The negative effect of INSPRI and INSPRS on firm performance matches the results from the research by Ersoy-Bozcuk and Lasfer (2000) and Faccio and Lasfer (2000). According to these researches, INSPRI and INSPRS have a dubious monitoring role; in other words, in firms at the growth stage, both types of institutional investors do not play a significant role in monitoring. Ramaswamy et al., (2008) confirms that a growing firm usually has not had a good corporate governance system just yet. The reason is that the firm is usually focused on product innovation, organizational and managerial practices, profitability monitoring, and customers; neither is their managerial hierarchy effective as yet. Therefore, the firm tends to be occupied in finding an organizational structure that fits and can operate smoothly, and they have little time or opportunity in applying the corporate governance system.
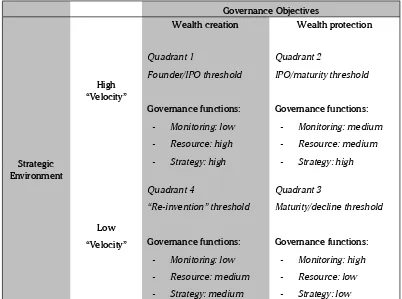
Difference results between growth and mature firms show INSPRI and INSPRS affect clearly on the mature firms. This result describes corporate governance system, especially monitoring activity, is seen highly on the mature firms. Therefore, the existing of INSPRI and INSPRS will affect positively on firm performance. Institutional investors play important role as stated by Filatochev et al., (2006).
Filatochev et al., (2006) stated on the second quadrant, when the firm matures and its management becomes more professionalized and the firm moves towards the maturity stage, changes in its ownership structure and the growing importance of external stakeholders may shift the balance towards the monitoring and control functions of governance systems. Therefore, at this stage, the value-protecting role of corporate governance becomes particularly important. While
the firm enters the stages of maturity and decline (Quadrant 3), the monitoring role of corporate governance necessarily remains high. It relates to free cash flow (FCF) hypothesis which is the agency conflicts are severe when the organization matures and generates substantial rents. The FCF hypothesis predicts that managers with unused borrowing power of large cash reserves are more likely to undertake low-benefit or even value-destroying mergers or unrelated diversification. Besides, FCF hypothesis also increases managerial entrenchment and encourages self-serving managerial behaviours. The explanation of Filatochev et al., (2006) is similar to Roche (2008) who found the monitorng function is higher on the mature firms.
Meanwhile, Liang et al., (2011) stated corporate governance role is seen clearly on the mature
Governance Objectives
Wealth creation Wealth protection
Strategic Environment
High “Velocity”
Quadrant 1
Founder/IPO threshold
Governance functions:
- Monitoring: low - Resource: high - Strategy: high
Quadrant 2
IPO/maturity threshold
Governance functions:
- Monitoring: medium - Resource: medium - Strategy: high
Low “Velocity”
Quadrant 4
“Re-invention” threshold
Governance functions:
- Monitoring: low - Resource: medium - Strategy: medium
Quadrant 3
Maturity/decline threshold
Governance functions:
- Monitoring: high - Resource: low - Strategy: low
firms because it is a competitive tool. The mature firms are in the stage of moderate sales growth and declining profit margins. However, corporate governance is also needed by the growth firms and its role is a regulatory requirement, not a competitive tool. The growth firms still focus on theirs operations, such as expansion and sales. The similar results was found on the stagnant firms with the coefficient of INSPRI is 0.0048 (t-stat = 0.1879) and the coefficent of INSPRS is 0.0109 (t-stat = 0.2142), but they are not significant.
MANAGERIAL IMPLICATIONS
Insider ownership has a significant effect on firm performance. Therefore, the stock compensation becomes an option to reduce the agency costs or to increase firm performance. However, there are things to consider, namely there is a point where insider ownership can reduce firm performance. Furthermore, when investors invest their money, they should consider ownerhsip structure and firms’ life cycle. They relate to firm performance and return on investment. Besides, the institutional ownership concentration can affect negatively on firm performance. Types of institutional ownership have different results to firm performance at the diffent stage of life cycle..
CONCLUSION
Previous researches have examined the connection between ownership structure and firm performance in relation to corporate governance. The current research examines the same subject, but in relation to the firm’s life cycle. The purpose
is to verify whether ownership structure influences firm performance differently at each life cycle. The results are (1) insider ownership has a significantly non-linear effect on firm performance, indicated by the U-shaped curve, and (2) the concentration of institutional ownership has a significantly negative effect on firm performance, which is proven by the findings at all samples. However, in firms at the mature stage, the concentration of institutional ownership has a significantly positive effect on firm performance. Blockholders have a significantly positive effect on firm performance in firms at the mature stage, but the effect is significantly negative in firms at the growth stage. Meanwhile, insensitive and pressure-sensitive institutional ownerships have a positive and significant effect on firm performance in firms at the mature stage; in firms at the growth stage, the effect in negative and significant.
The current research shows that ownership structure influences firm performance differently, depending on each firm’s life cycle. Therefore, it is our hope that this research contributes toward underlining the importance of a firm’s life cycle in relation to the effect of ownership structure on firm performance. However, the current research has several limitations: it only covers firms from the manufacturing, IT, and multimedia businesses during a six-year (2005-2010) period. In addition, only three life cycles are studied in this research: growth, mature, and stagnant. The other life cycles, start-up and renewal, are not included.
R E F E R E N C E S
Abor, J., and Biekpe, N. (2006). An Emperical Test of the Agency Problems and Capital Structure of South African Quoted SMEs.
SAJAR, Vol. 20, No. 1, pp. 51-65.
Bhattacharya, P.S., and Graham, M.. (2007). Institutional Ownership and Firm Performance: Evidence from Finland. Working Paper SSRN.
Crutchley, C.E. and Hansen, R.S., (1989). A Test of the Agency Theory of Managerial Ownership, Corporate Leverage, and Corporate Dividends. Financial Management, Vol. 18 No. 4 (Winter), pp. 36-46.
Ersoy-Bozcuk, A., and Lasfer, M.A. (2000). Change in UK Share Ownership and Corporate Monitoring. Working Paper from City University Business School, London.
Faccio, M., and Lasfer, M.A. (2000). Do Occupational Pension Funds Monitor Companies in which They Hold Large Stakes?.
Journal of Corporate Finance, 6, pp. 71-110.
Fazlzadeh, A., Hendi, A.T., and Mahboubi, K. (2011). The Examination of the Effect of Ownership Structure on Firm Performance in Listed Firms of Tehran Stock Exchange Based on the Type of the Industry. Imternational Journal of Business and Management, Vol. 6 No. 3 pg. 249-266.
Filatotchev, I., Toms, S. and Wright, M. (2006). The Firm’s Strategic Dynamics and Corporate Governance Life Cycle.
International Journal of Managerial Finance, Vol. 2 No. 4, pp. 256-279.
Holm, C., and Schøler, F. (2010). Reduction of Asymetric Information Through Corporate Governance Mechanisms-The Importance of Ownership Dispersion and exposure toward the International Cappital Market. An International Review, 18(1): 32-47.
Huse, M. (2007). Boards, Governance, and Value Creation. USA: Cambridge University Press.
Jara-Bertin, M., López-Iturriaga, F., and López-de-Foronda, O. (2012). Does the Influence of Institutional Investors Depend on the Institutional Framework? An International Analysis. Applied Economics 44, pp. 265-278.
Jensen, M.C., and Meckling, W.H. (1976). Theory of the Firm: Managerial Behavior, Agency Costs adn Ownership Structure.
Journal of Financial Economics, Vol. 3 No. 4, pp 305-360.
Kapopoulos, P., and Lazaretou S. (2007). Corporate Ownership Structure and Firm Performance: Evidence from Greek Firms.
Corporate Governance: An International Review, 15 (2), pp. 144-158.
Ministry of Industry, Republic of Indonesia. (2011). Menyiapkan Kemandirian Industri Nasional. Media Industri, No. 01. Liang, Chiung-Ju, and Lin, Ying-Li. (2008). Which IC Is More Important? A Life-Cycle Perspective. Journal Intellectual Capital,
Vol. 9 No. 1, pp. 62-76.
Liang, Chiung-Ju, Lin, Ying-Li, and Huang, Tzu-Tsang. (2011). Does Multi-Dimensional Ownership Structure Matter in Firm performance? A Dynamic Firm’s Life Cycle Perspective. The International Journal of Business and Finance Research, Vol. 5 No. 2.
McConnell, J.J., and Servaes, H. (1990). Additional Evidence on Equity Ownership and Corporate Value. Journal of Financial Economics, 27, pp. 595-612.
Morck, R., Shleifer, A., and Vishny, R.W. (1988). Management Ownership and Market Valuation: An Empirical Analysis. Journal of Financial Economic, 20, pp. 293-315.
Perrini, F., Rossi, G., and Rovetta B (2008). Does Ownership Structure Affect Performance? Evidence from Italian Market. An International Review, Vol 16 No. 4.
Ramaswamy, V., Ueng, C. J., and Carl, L. (2008). Corporate Governance Characteristics of Growth Companies: An Empirical Study. Academy of Strategic Management Journal, 7, 21-33.
Roche, O.P. (2008). Board Role and Composition within the Organizational Life Cycle. Disertasi. Desautels Faculty of Management, McGill University, Montreal.
Rose, Caspar. (2005). Managerial Ownership and Firm Performance in Listed Andish Firms: In Search of the Missing Link.
European Management Journal Vol. 23 No. 5, pp. 542-553.
Sari, Putri G. (2004). Analisia Hubungan Struktur Kepemilikan Saham and Kinerja Perusahaan-Perusahaan di Indonesia. Thesis for Master Degree. Study Program of Management Studies, Faculty of Economics, Universitas Indonesia.
Solomon, J. (2007). Corporate Governance and Accountability. John Wiley & Sons, Ltd. West Sussex, England.
Surya, I., and Yustiavananda, I. (2008). Penerapan Good Corporate Governance: Mengesampingkan Hak-Hak Istimewa Demi Kelangsungan Usaha. Jakarta: Kencana. (Kerjasama Fakultas Hukum Universitas Indonesia and Lembaga Kajian Pasar Modal and Keuangan/LKPMK FHUI).
Thomsen, S., Pedersen, T., and Kvist, H.K. (2006). Blockholder Ownership: Effect on Firm Value in Market and Control Based Governance Systems. Journal of Corporate Finance 12, pp. 246-269.