NCES 2011-004
U.S. DEPARTMENT OF EDUCATION
Highlights From PISA 2009:
Performance of U.S. 15-Year-Old Students in
Reading, Mathematics, and Science Literacy in
an International Context
December 2010
Howard L. Fleischman
Paul J. Hopstock
Marisa P. Pelczar
Brooke E. Shelley
Windwalker Corporation
Holly Xie
Project Officer
National Center for Education Statistics
NCES 2011-004
U.S. Department of Education
Arne Duncan Secretary
Institute of Education Sciences
John Q. Easton Director
National Center for Education Statistics
Stuart Kerachsky Acting Commissioner
The National Center for Education Statistics (NCES) is the primary federal entity for collecting, analyzing, and reporting data related to education in the United States and other nations. It fulfills a congressional mandate to collect, collate, analyze, and report full and complete statistics on the condition of education in the United States; conduct and publish reports and specialized analyses of the meaning and significance of such statistics; assist state and local education agencies in improving their statistical systems; and review and report on education activities in foreign countries.
NCES activities are designed to address high-priority education data needs; provide consistent, reliable, complete, and accurate indicators of education status and trends; and report timely, useful, and high-quality data to the U.S. Department of Education, the Congress, the states, other education policymakers, practitioners, data users, and the general public. Unless specifically noted, all information contained herein is in the public domain.
We strive to make our products available in a variety of formats and in language that is appropriate to a variety of audiences. You, as our customer, are the best judge of our success in communicating information effectively. If you have any comments or suggestions about this or any other NCES product or report, we would like to hear from you. Please direct your comments to
NCES, IES, U.S. Department of Education 1990 K Street NW
Washington, DC 20006-5651
December 2010
The NCES Home Page address is http://nces.ed.gov.
The NCES Publications and Products address is http://nces.ed.gov/pubsearch.
This report was prepared for the National Center for Education Statistics under Contract No. ED-04-CO-0084 with Windwalker Corporation. Mention of trade names, commercial products, or organizations does not imply endorsement by the U.S. Government.
Suggested Citation
Fleischman, H.L., Hopstock, P.J., Pelczar, M.P., and Shelley, B.E.(2010). Highlights From PISA 2009: Performance of U.S. 15-Year-Old Students in Reading, Mathematics, and Science Literacy in an International Context (NCES 2011-004). U.S. Department of Education, National Center for Education Statistics. Washington, DC: U.S. Government Printing Office.
For ordering information on this report, write to
ED Pubs, U.S. Department of Education P.O. Box 22207
Alexandria, VA 22304
Or call toll free 1-877-4-ED-Pubs or order online at http://www.edpubs.gov.
Content Contact
Highlights From PISA 2009 iii
Executive Summary
The Program for International Student Assessment (PISA) is an international assessment that measures the performance of 15-year-olds in reading literacy, mathematics literacy, and science literacy every 3 years. First implemented in 2000, PISA is coordinated by the Organization for Economic Cooperation and Development (OECD), an intergovernmental organization of 34
member countries. In all, 60 countries and 5 other education systems1 participated as partners in PISA 2009.
Each PISA cycle assesses one of the three subject areas in depth. In PISA 2009, reading literacy was the subject area assessed in depth, and science literacy and mathematics literacy were the minor subjects assessed. This report focuses on the performance of U.S. students2 in the major
subject area of reading literacy by presenting results from a combined reading literacy scale and three reading literacy subscales: access and retrieve, integrate and interpret, and reflect and evaluate. Achievement results for the minor subject areas of mathematics and science literacy are also presented.
Key findings from PISA 2009 include the following:
Reading Literacy
• U.S. 15-year-olds had an average score of 500 on the combined reading literacy scale, not measurably different from the OECD average score of 493. Among the 33 other OECD countries, 6 countries had higher average scores than the United States, 13 had lower average scores, and 14 had average scores not measurably different from the U.S. average. Among the 64 other OECD countries, non-OECD countries, and other education systems, 9 had higher average scores than the United States, 39 had lower average scores, and 16 had average scores not measurably different from the U.S. average.
• On the reflect and evaluate reading literacy subscale, U.S. 15-year-olds had a higher average score than the OECD average. The U.S. average was lower than that of 5 OECD countries and higher than that of 23 OECD countries; it was lower than that of 8 countries and other education systems and higher than that of 51
1 Other education systems are located in non-national entities, such as
Shanghai-China.
2 In the United States, a total of 165 schools and 5,233 students participated in
the assessment. The overall weighted school response rate was 68 percent before the use of replacement schools. The final weighted student response rate after replacement was 87 percent.
countries and other education systems overall. On the other two subscales—access and retrieve and integrate and interpret—the U.S. average was not measurably different from the OECD average.
In reading literacy, 30 percent of U.S. students scored at or above proficiency level 4. Level 4 is the level at which students are “capable of difficult reading tasks, such as locating embedded information, construing meaning from nuances of language and critically evaluating a text” (OECD 2010a, p. 51). At levels 5 and 6 students demonstrate higher-level reading skills and may be referred to as “top performers” in reading. There was no measurable difference between the percentage of U.S. students and the percentage of students in the OECD countries on average who performed at or above level 4.
Eighteen percent of U.S. students scored below level 2 in reading literacy. Students performing below level 2 in reading literacy are below what OECD calls “a baseline level of proficiency, at which students begin to demonstrate the reading literacy competencies that will enable them to participate effectively and productively in life” (OECD 2010a, p. 52). There was no measurable difference between the percentage of U.S. students and the percentage of students in the OECD countries on average who demonstrated proficiency below level 2.
Female students scored higher, on average, than male students on the combined reading literacy scale in all 65 participating countries and other education systems. In the United States, the difference was smaller than the difference in the OECD countries, on average, and smaller than the differences in 45 countries and other education systems (24 OECD countries and 21 non-OECD countries and other education systems).
On the combined reading literacy scale, White (non-Hispanic) and Asian (non-(non-Hispanic) students had higher average scores than the overall OECD and U.S. average scores, while Black (non-Hispanic) and Hispanic students had lower average scores than the overall OECD and U.S. average scores. The average scores of students who reported two or more races were not measurably different from the overall OECD or U.S. average scores.
Students in public schools in which half or more of students (50 to 74.9 percent and 75 percent or more) were eligible for free or reduced-price lunch (FRPL-eligible) scored, on average, below the overall OECD and U.S. average scores in reading literacy. Students in •
•
•
•
iv Highlights From PISA 2009
Executive Summary
schools in which less than 25 percent of students were FRPL-eligible (10 to 24.9 percent and less than 10 percent) scored, on average, above the overall OECD and U.S. average scores. The average scores of students in schools in which 25 to 49.9 percent were FRPL-eligible were above the overall OECD average but not measurably different from the U.S. average.
• There was no measurable difference between the average score of U.S. students in reading literacy in 2000, the last time in which reading literacy was the major domain assessed in PISA, and 2009, or between 2003 and 2009. There also were no measurable differences between the U.S. average score and the OECD average score in 2000 or in 2009.3
Mathematics Literacy
• U.S. 15-year-olds had an average score of 487 on the mathematics literacy scale, which was lower than the OECD average score of 496. Among the 33 other OECD countries, 17 countries had higher average scores than the United States, 5 had lower average scores, and 11 had average scores not measurably different from the U.S. average. Among the 64 other OECD countries, non-OECD countries, and other education systems, 23 had higher average scores than the United States, 29 had lower average scores, and 12 had average scores not measurably different from the U.S. average score.
• In mathematics literacy, 27 percent of U.S. students scored at or above proficiency level 4. This is lower than the 32 percent of students in the OECD countries on average that scored at or above level 4. Level 4 is the level at which students can complete higher order tasks such as “solv[ing] problems that involve visual and spatial reasoning...in unfamiliar contexts” and “carry[ing] out sequential processes” (OECD 2004, p. 55). Twenty-three percent of U.S. students scored below level 2. There was no measurable difference between the percentage of U.S. students and the percentage of students in the OECD countries on average demonstrating proficiency below level 2, what OECD calls a “a baseline level of mathematics proficiency on the PISA scale at which students begin to
3 The OECD averages against which the U.S. averages are compared are the
averages for the 27 OECD countries with comparable data for 2000 and 2009.
demonstrate the kind of literacy skills that enable them to actively use mathematics” (OECD 2004, p. 56).
• The U.S. average score in mathematics literacy in 2009 was higher than the U.S. average in 2006 but not measurably different from the U.S. average in 2003, the earliest time point to which PISA 2009 performance can be compared in mathematics literacy. U.S. students’ average scores were lower than the OECD average scores in each of these years.4
Science Literacy
• On the science literacy scale, the average score of U.S. students (502) was not measurably different from the OECD average (501). Among the 33 other OECD countries, 12 had higher average scores than the United States, 9 had lower average scores, and 12 had average scores that were not measurably different. Among the 64 other OECD countries, non-OECD countries, and other education systems, 18 had higher average scores, 33 had lower average scores, and 13 had average scores that were not measurably different from the U.S. average score.
• Twenty-nine percent of U.S. students and students in the OECD countries on average scored at or above level 4 on the science literacy scale. Level 4 is the level at which students can complete higher order tasks such as “select[ing] and integrat[ing] explanations from different disciplines of science or technology and link[ing] those explanations directly to...life situations” (OECD 2007, p. 43). Eighteen percent of U.S. students and students in the OECD countries on average scored below level 2. Students performing below level 2 are below what OECD calls a “baseline level of proficiency…at which students begin to demonstrate the science competencies that will enable them to participate effectively and productively in life situations related to science and technology” (OECD 2007, p. 44). There were no measurable differences between the percentages of U.S. students and students in the OECD countries on average that scored at the individual proficiency levels.
• The U.S. average score in science literacy in 2009
4 The OECD averages against which the U.S. averages are compared are the
Highlights From PISA 2009 v
Executive Summary
was higher than the U.S. average in 2006, the only time point to which PISA 2009 performance can be compared in science literacy. While U.S. students scored lower than the OECD average in science literacy in 2006, the average score of U.S. students in 2009 was not measurably different from the 2009 OECD average.5
5 The OECD averages against which the U.S. averages are compared are the
Highlights From PISA 2009 vii
Acknowledgments
This report reflects the contributions of many individuals. The authors wish to thank all those who assisted with PISA 2009, from the design stage through the creation of this report. The members of the U.S. PISA 2009 Steering Committee (noted in appendix C) gave their time and
Highlights From PISA 2009 ix
Contents
Page
Executive Summary . . . .iii
Acknowledgments . . . vii
List of Tables . . . x
List of Figures . . . xi
List of Exhibits. . . xii
Introduction . . . 1
PISA in Brief . . . 1
What PISA Measures . . . 4
How PISA 2009 Was Conducted . . . 5
U.S. Performance in Reading Literacy . . . 7
Performance of Students Overall. . . 7
Performance at PISA Proficiency Levels . . . 7
Differences in Performance by Selected Student and School Characteristics . . . 11
Trends in Average Performance . . . 16
U.S. Performance in Mathematics Literacy . . . 17
Performance of Students Overall. . . 17
Performance at PISA Proficiency Levels . . . 19
Trends in Average Performance . . . 21
U.S. Performance in Science Literacy . . . 23
Performance of Students Overall. . . 23
Performance at PISA Proficiency Levels . . . 25
Trends in Average Performance . . . 27
Further Information . . . 29
References . . . 31
Appendix A: Sample Reading Texts and Items From PISA 2009 . . . 33
Appendix B: Technical Notes. . . 45
Appendix C: U.S. PISA 2009 Steering Committee. . . 53
x Highlights From PISA 2009
List of Tables
Table Page
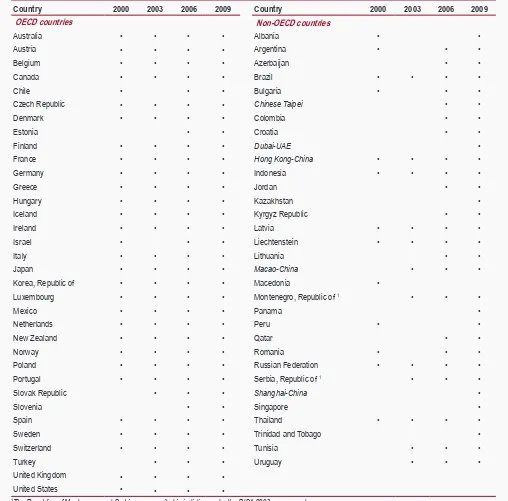
1. Participation in PISA, by country: 2000, 2003, 2006, and 2009. . . 3
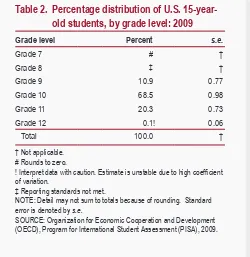
2. Percentage distribution of U.S. 15-year-old students, by grade level: 2009 . . . 4
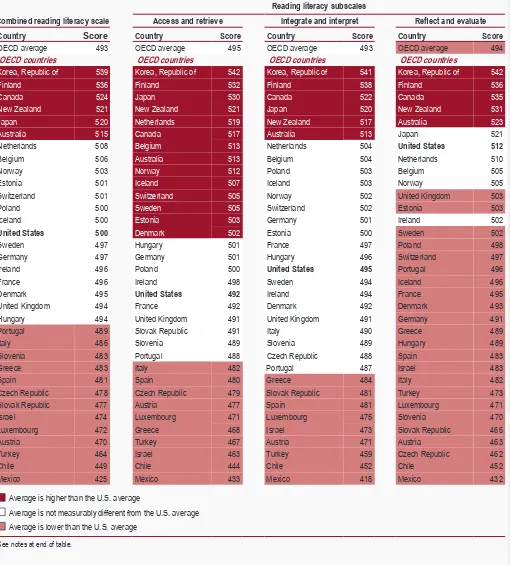
3. Average scores of 15-year-old students on combined reading literacy scale and reading literacy subscales,
by country: 2009 . . . 8
4. Average scores of 15-year-old female and male students on combined reading literacy scale, by
country: 2009 . . . 12
5. Average scores of U.S. 15-year-old students on combined reading literacy scale, by race/ethnicity: 2009. . . 14
6. Average scores of U.S. 15-year-old students on combined reading literacy scale, by percentage
of students in public school eligible for free or reduced-price lunch: 2009 . . . 15
7. Average scores of 15-year-old students on mathematics literacy scale, by country: 2009 . . . 18
Highlights From PISA 2009 xi
List of Figures
Figure Page
1. PISA administration cycle. . . 1
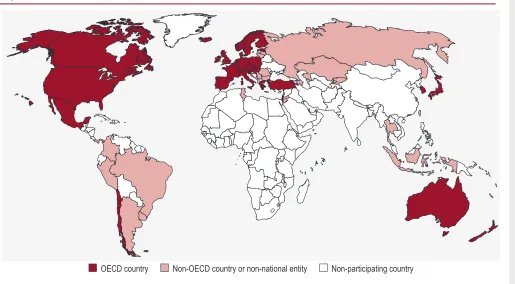
2. Countries that participated in PISA 2009 . . . 2
3. Percentage distribution of 15-year-old students in the United States and OECD countries on combined
reading literacy scale, by proficiency level: 2009 . . . 11
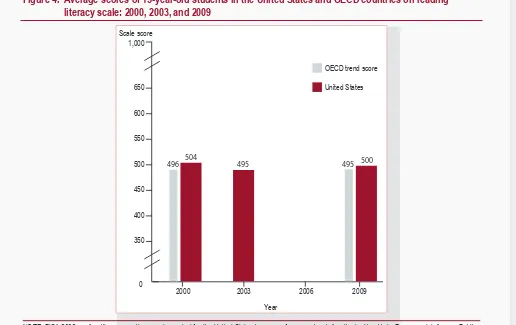
4. Average scores of 15-year-old students in the United States and OECD countries on reading literacy
scale: 2000, 2003, and 2009 . . . 16
5. Percentage distribution of 15-year-old students in the United States and OECD countries on
mathematics literacy scale, by proficiency level: 2009 . . . 20
6. Average scores of 15-year-old students in the United States and OECD countries on mathematics
literacy scale: 2003, 2006, and 2009 . . . 21
7. Percentage distribution of 15-year-old students in the United States and OECD countries on
science literacy scale, by proficiency level: 2009 . . . 26
8. Average scores of 15-year-old students in the United States and OECD countries on science
xii Highlights From PISA 2009
List of Exhibits
Exhibit Page
1. Description of PISA proficiency levels on combined reading literacy scale: 2009 . . . 10
2. Description of PISA proficiency levels on mathematics literacy scale: 2009. . . 19
3. Description of PISA proficiency levels on science literacy scale: 2009 . . . 25
A-1. Sample PISA 2009 reading texts and items by reading aspect and PISA proficiency level. . . 33
A-2. Example A of PISA 2009 reading assessment: Telecommuting. . . 34
A-3. Example B of PISA 2009 reading assessment: Cell Phone Safety . . . 36
Highlights From PISA 2009 1
T
Introduction
PISA in Brief
he Program for International Student Assessment (PISA) is an international assessment that measures the performance of 15-year-olds in reading literacy, mathematics literacy, and science literacy. Coordinated by the Organization for Economic Cooperation and Development (OECD), an intergovernmental organization of 34 member countries, PISA was first implemented in 2000 and is conducted every 3 years. PISA 2009 was the fourth cycle of the assessment.
Each PISA data collection effort assesses one of the three subject areas in depth (considered the major subject area), although all three are assessed in each cycle (the other two subjects are considered minor subject areas
for that assessment year). Assessing all three areas allows participating countries to have an ongoing source of achievement data in every subject area while rotating one area as the main focus over the years. In the fourth cycle of PISA, reading was the subject area assessed in depth, as it was in 2000 (figure 1).
Sixty countries and 5 other education systems1 participated
as partners in PISA 2009 (figure 2 and table 1).
This report focuses on the performance of U.S. students in the major subject area of reading literacy as assessed in PISA 2009. Achievement results for the minor subject areas of mathematics and science literacy in 2009 are also presented.
1 Other education systems are located in non-national entities, such as
Shanghai-China.
Figure 1. PISA administration cycle
Assessment year 2000 2003 2006 2009 2012 2015
Subjects assessed READING Reading Reading READING Reading Reading
Mathematics MATHEMATICS Mathematics Mathematics MATHEMATICS Mathematics
Science Science SCIENCE Science Science SCIENCE
Problem solving Problem solving
NOTE: Reading, mathematics, and science literacy are all assessed in each assessment cycle of the Program for International Student Assessment (PISA). A separate problem-solving assessment was administered in 2003 and is planned for 2012. The subject in all capital letters is the major subject area for that cycle.
2 Highlights From PISA 2009
Introduction
Figure 2. Countries that participated in PISA 2009
OECD country Non-OECD country or non-national entity Non-participating country
Highlights From PISA 2009 3
Introduction
Table 1. Participation in PISA, by country: 2000, 2003, 2006, and 2009
Country 2000 2003 2006 2009 Country 2000 2003 2006 2009
OECD countries
Montenegro, Republic of 1 Panama
Peru Qatar Romania
Russian Federation Serbia, Republic of 1 Shanghai-China
1 The Republics of Montenegro and Serbia were a united jurisdiction under the PISA 2003 assessment.
NOTE: A “•” indicates that the country participated in the Program for International Student Assessment (PISA) in the specific year. Because PISA is principally an Organization for Economic Cooperation and Development (OECD) study, non-OECD countries are displayed separately from the OECD countries. Eleven countries and other education systems—Albania, Argentina, Bulgaria, Chile, Hong Kong-China, Indonesia, Israel, Macedonia, Peru, Romania, and Thailand—administered PISA 2000 in 2001. Italics indicate non-national entities. UAE refers to the United Arab Emirates.
4 Highlights From PISA 2009
Introduction
What PISA Measures
P
ISA assesses the application of knowledge in reading, mathematics, and science literacy to problems within a real-life context (OECD 1999). PISA uses the term “literacy” in each subject area to denote its broad focus on the application of knowledge and skills. For example, when assessing reading, PISA assesses how well 15-year-old students can understand, use, and reflect on written text for a variety of purposes and settings. In science, PISA assesses how well students can apply scientific knowledge and skills to a range of different situations they may encounter in their lives. Likewise, in mathematics, PISA assesses how well students analyze, reason, and interpret mathematical problems in a variety of situations. Scores on the PISA scales represent skill levels along a continuum of literacy skills. PISA provides ranges of proficiency levels associated with scores that describe what a student can typically do at each level (OECD 2006).The assessment of 15-year-old students allows countries to compare outcomes of learning as students near the end of compulsory schooling. PISA’s goal is to answer the question “What knowledge and skills do students have at age 15?” In this way, PISA’s achievement scores represent a “yield” of learning at age 15, rather than a direct measure of attained curriculum knowledge at a particular grade level. Fifteen-year-old students participating in PISA from the United States and other countries are drawn from a range of grade levels. Sixty-nine percent of the U.S. students were enrolled in grade 10, and another 20 percent were enrolled in grade 11 (table 2).
In addition to participating in PISA, the United States has for many years conducted assessments of student achievement at a variety of grade levels and in a variety of subject areas through the National Assessment of Educational Progress (NAEP), the Trends in International Mathematics and Science Study (TIMSS), and the Progress in International Reading Literacy Study (PIRLS). These studies differ from PISA in terms of their purpose and design (see appendix D). NAEP reports information on the achievement of U.S. students using nationally established benchmarks of performance (i.e., basic, proficient, and
advanced), based on the collaborative input of a wide range of experts and participants from government, education, business, and public sectors in the United States.
Furthermore, the information is used to monitor progress in achievement over time, specific to U.S. students.
To provide a critical external perspective on the mathematics, science, and reading achievement of U.S. students, the United States participates in PISA as well as TIMSS and PIRLS. TIMSS provides the United States with information on the mathematics and science achievement of 4th- and 8th-grade U.S. students compared to students in other countries. PIRLS allows the United States to make international comparisons of the reading achievement of students in the fourth grade. TIMSS and PIRLS seek to measure students’ mastery of specific knowledge, skills, and concepts and are designed to broadly reflect curricula in the United States and other participating countries; in contrast, PISA does not focus explicitly on curricular outcomes but rather on the application of knowledge to problems in a real-life context.
Table 2. Percentage distribution of U.S. 15-year- old students, by grade level: 2009
! Interpret data with caution. Estimate is unstable due to high coefficient of variation.
‡ Reporting standards not met.
NOTE: Detail may not sum to totals because of rounding. Standard error is denoted by s.e.
Highlights From PISA 2009 5
Introduction
Highlights From PISA 2009 5
How PISA 2009 Was Conducted
P
ISA 2009 was coordinated by the OECD and implemented at the international level by the PISA Consortium, led by the Australian Council for Educational Research (ACER).2 The National Center forEducation Statistics (NCES) of the Institute of Education Sciences (IES) at the U.S. Department of Education was responsible for the implementation of PISA in the United States. Data collection and associated tasks in the United States were carried out through a contract with Windwalker Corporation and its two subcontractors, Westat and Pearson. A steering committee (see appendix C for a list of members) provided input on the development and dissemination of PISA in the United States.
PISA 2009 was a 2-hour paper-and-pencil assessment of 15-year-olds collected from nationally representative samples of students in participating countries.3 Like other
large-scale assessments, PISA was not designed to provide individual student scores, but rather national and group estimates of performance. In PISA 2009, although each student was administered one test booklet, there were 13 test booklets in total. Each test booklet included either reading items only; reading and mathematics items; reading and science items; or reading, mathematics, and
2 The other members of the PISA Consortium are Analyse des systèmes et des
pratiques d’enseignement (aSPe, Belgium), cApStAn Linguistic Quality Control (Belgium), the German Institute for International Educational Research (DIPF), Educational Testing Service (ETS, United States), Institutt for Laererutdanning og Skoleu tvikling (ILS, Norway), Leibniz Institute for Science and Mathematics Education (IPN, Germany), the National Institute for Educational Policy Research (NIER, Japan), CRP Henri Tudor and Université de Luxembourg – EMACS (Luxembourg), and Westat (United States).
3 Some countries also administered the PISA Electronic Reading Assessment,
which was analyzed and reported separately from the paper-and-pencil assessment. The United States did not administer this optional component.
science items. As such, all students answered reading items, but not every student answered mathematics and science items (for more information on the PISA 2009 design, see the technical notes in appendix B).
PISA 2009 was administered in the United States between September and November 2009. The U.S. sample included both public and private schools, randomly selected and weighted to be representative of the nation.4 In total, 165
schools and 5,233 students participated in PISA 2009 in the United States. The overall weighted school response rate was 68 percent before the use of replacement schools and 78 percent after the addition of replacement schools. The final weighted student response rate was 87 percent (see the technical notes in appendix B for additional details on sampling, administration, response rates, and other issues).
This report provides results for the United States in relation to the other countries participating in PISA 2009, distinguishing OECD countries and non-OECD countries and other education systems. Differences described in this report have been tested for statistical significance at the .05 level, with no adjustments for multiple comparisons. Additional information on the statistical procedures used in this report is provided in the technical notes in appendix B. For further results from PISA 2009, see the OECD publications PISA 2009 Results (Volumes I-V) (OECD 2010a, 2010b, 2010c, 2010d, 2010e) and the NCES website at http://nces.ed.gov/surveys/pisa.
4 The sampling data for public schools were obtained from the 2005–06
Highlights From PISA 2009 7
U.S. Performance in Reading Literacy
U.S. Performance in Reading Literacy
PISA’s major focus in 2009 was reading literacy, which is defined as follows:
Reading literacy is understanding, using, reflecting on and engaging with written texts, in order to achieve one’s goals, to develop one’s knowledge and potential, and to participate in society (OECD 2009, p. 23).
In assessing students’ reading literacy, PISA measures the extent to which students can construct, extend, and reflect on the meaning of what they have read across a wide variety of texts associated with a wide variety of situations.
The PISA reading literacy assessment is built on three major task characteristics: “situation – the range of broad contexts or purposes for which reading takes place; text – the range of material that is read; and aspect – the cognitive approach that determines how readers engage with a text” (OECD 2009, p. 25). Text types include prose texts (such as stories, articles, and manuals) and noncontinuous texts (such as forms and advertisements) that reflect various uses or situations for which texts were constructed or the context in which knowledge and skills are applied. Reading aspects, or processes, include retrieving information; forming a broad understanding; developing an
interpretation; reflecting on and evaluating the content of a text; and reflecting on and evaluating the form of a text. Sample reading literacy tasks are shown in appendix A.
Since reading literacy was the major subject area for the 2009 cycle of PISA, results are shown for the combined reading literacy scale, as well as for the three reading literacy subscales that reflect the reading aspects or
processes: accessing and retrieving information, integrating and interpreting, and reflecting and evaluating. Scores on the reading literacy scale (combined and subscales) range from 0 to 1,000.5
5 The reading literacy scale was established in PISA 2000 to have a mean of 500
and a standard deviation of 100. The combined reading literacy scale is made up of all items in the three subscales. However, the combined reading scale and the three subscales are each computed separately through Item Response Theory (IRT) models. Therefore, the combined reading scale score is not the average of the three subscale scores.
Performance of Students Overall
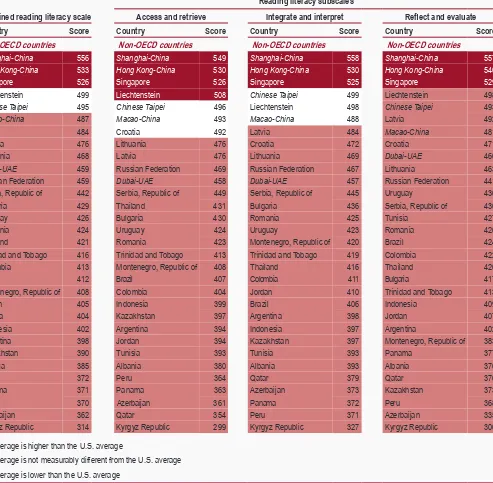
U.S. 15-year-olds had an average score of 500 on the combined reading literacy scale, not measurably different from the average score of 493 for the 34 OECD countries (table 3). Among the 33 other OECD countries, 6
countries had higher average scores than the United States, 13 had lower average scores, and 14 had average scores not measurably different from the U.S. average. Among the 64 other OECD countries, non-OECD countries, and other education systems, 9 had higher average scores than the United States, 39 had lower average scores, and 16 had average scores not measurably different from the U.S. average.
On the reflect and evaluate subscale, U.S. 15-year-olds had a higher average score than the OECD average (512 versus 494). The U.S. average was lower than that of 5 OECD countries and higher than that of 23 OECD countries; it was lower than that of 8 countries and other education systems and higher than that of 51 countries and other education systems overall. On the other two subscales—
access and retrieve and integrate and interpret—the U.S. average was not measurably different from the OECD average (492 versus 495 and 495 versus 493, respectively).
Performance at PISA
Proficiency Levels
8 Highlights From PISA 2009
U.S. Performance in Reading Literacy
Table 3. Average scores of 15-year-old students on combined reading literacy scale and reading literacy subscales, by country: 2009
Co
O
O
Reading literacy subscales
Access and retrieve Integrate and interpret Reflect and evaluate mbined reading literacy scale
Country Score Country Score Country Score Country Score
ECD average 493 OECD average 495 OECD average 493 OECD average 494
OECD countries ECD countries OECD countries OECD countries
Korea, Republic of 539 Korea, Republic of 542 Korea, Republic of 541 Korea, Republic of 542
Average is higher than the U.S. average
Average is not measurably different from the U.S. average Average is lower than the U.S. average
Highlights From PISA 2009 9
U.S. Performance in Reading Literacy
Table 3. Average scores of 15-year-old students on combined reading literacy scale and reading literacy subscales, by country: 2009–Continued
mbined reading literacy scale
Reading literacy subscales
Access and retrieve Integrate and interpret Reflect and evaluate
Country Score Country Score Country Score Country Score
Co
on-OECD countries
N Non-OECD countries Non-OECD countries Non-OECD countries
Shanghai-China 556 Shanghai-China 549 Shanghai-China 558 Shanghai-China 557 Hong Kong-China 533 Hong Kong-China 530 Hong Kong-China 530 Hong Kong-China 540
ngapore
Si 526 Singapore 526 Singapore 525 Singapore 529
Liechtenstein 499 Liechtenstein 508 Chinese Taipei 499 Liechtenstein 498
Chinese Taipei 493
Chinese Taipei 495 Chinese Taipei 496 Liechtenstein 498
acao-China
M 487 Macao-China 493 Macao-China 488 Latvia 492 Latvia 484 Croatia 492 Latvia 484 Macao-China 481 Croatia 476 Lithuania 476 Croatia 472 Croatia 471 Lithuania 468 Latvia 476 Lithuania 469 Dubai-UAE 466
Dubai-UAE 459 Russian Federation 469 Russian Federation 467 Lithuania 463 Russian Federation 459 Dubai-UAE 458 Dubai-UAE 457 Russian Federation 441 Serbia, Republic of 442 Serbia, Republic of 449 Serbia, Republic of 445 Uruguay 436 Bulgaria 429 Thailand 431 Bulgaria 436 Serbia, Republic of 430 Uruguay 426 Bulgaria 430 Romania 425 Tunisia 427 Romania 424 Uruguay 424 Uruguay 423 Romania 426 Thailand 421 Romania 423 Montenegro, Republic of 420 Brazil 424 Trinidad and Tobago 416 Trinidad and Tobago 413 Trinidad and Tobago 419 Colombia 422 Colombia 413 Montenegro, Republic of 408 Thailand 416 Thailand 420 Brazil 412 Brazil 407 Colombia 411 Bulgaria 417
ontenegro, Republic of
M 408 Colombia 404 Jordan 410 Trinidad and Tobago 413 Jordan 405 Indonesia 399 Brazil 406 Indonesia 409 Tunisia 404 Kazakhstan 397 Argentina 398 Jordan 407 Indonesia 402 Argentina 394 Indonesia 397 Argentina 402 Argentina 398 Jordan 394 Kazakhstan 397 Montenegro, Republic of 383 Kazakhstan 390 Tunisia 393 Tunisia 393 Panama 377 Albania 385 Albania 380 Albania 393 Albania 376 Qatar 372 Peru 364 Qatar 379 Qatar 376 Panama 371 Panama 363 Azerbaijan 373 Kazakhstan 373 Peru 370 Azerbaijan 361 Panama 372 Peru 368 Azerbaijan 362 Qatar 354 Peru 371 Azerbaijan 335 Kyrgyz Republic 314 Kyrgyz Republic 299 Kyrgyz Republic 327 Kyrgyz Republic 300
Average is higher than the U.S. average
Average is not measurably different from the U.S. average Average is lower than the U.S. average
TE: The Organization for Economic Cooperation and Development (OECD) average is the average of the national averages of the OECD member countries, with each NO
country weighted equally. Because the Program for International Student Assessment (PISA) is principally an OECD study, the results for non-OECD countries are displayed separately from those of the OECD countries and are not included in the OECD average. Countries are ordered on the basis of average scores, from highest to lowest within the OECD countries and non-OECD countries. Scores are reported on a scale from 0 to 1,000. Score differences as noted between the United States and other countries (as well as between the United States and the OECD average) are significantly different at the .05 level of statistical significance. The standard errors of the estimates are shown in table R1 available at http://nces.ed.gov/surveys/pisa/pisa2009tablefigureexhibit.asp. Italics indicate non-national entities. UAE refers to the United Arab Emirates.
10 Highlights From PISA 2009
U.S. Performance in Reading Literacy
Exhibit 1. Description of PISA proficiency levels on combined reading literacy scale: 2009
Proficiency level and lower cut
point score Task descriptions
Level 6 698
At level 6, tasks typically require the reader to make multiple inferences, comparisons and contrasts that are both detailed and precise. They require demonstration of a full and detailed understanding of one or more texts and may involve integrating information from more than one text. Tasks may require the reader to deal with unfamiliar ideas, in the presence of prominent competing information, and to generate abstract categories for interpretations. Reflect and evaluate tasks may require the reader to hypothesize about or critically evaluate a complex text on an unfamiliar topic, taking into account multiple criteria or perspectives, and applying sophisticated understandings from beyond the text. There are limited data about access and retrieve tasks at this level, but it appears that a salient condition is precision of analysis and fine attention to detail that is inconspicuous in the texts.
Level 5 626
At level 5, tasks involve retrieving information that require the reader to locate and organize several pieces of deeply embedded information, inferring which information in the text is relevant. Reflective tasks require critical evaluation or hypothesis, drawing on specialized knowledge. Both interpretative and reflective tasks require a full and detailed understanding of a text whose content or form is unfamiliar. For all aspects of reading, tasks at this level typically involve dealing with concepts that are contrary to expectations.
Level 4 553
At level 4, tasks involve retrieving information that require the reader to locate and organize several pieces of embedded information. Some tasks at this level require interpreting the meaning of nuances of language in a section of text by taking into account the text as a whole. Other interpretative tasks require understanding and applying categories in an unfamiliar context. Reflective tasks at this level require readers to use formal or public knowledge to hypothesize about or critically evaluate a text. Readers must demonstrate an accurate understanding of long or complex texts whose content or form may be unfamiliar.
Level 3 480
At level 3, tasks require the reader to locate, and in some cases recognize the relationship between, several pieces of information that must meet multiple conditions. Interpretative tasks at this level require the reader to integrate several parts of a text in order to identify a main idea, understand a relationship or construe the meaning of a word or phrase. They need to take into account many features in comparing, contrasting or categorizing. Often the required information is not prominent or there is much competing information; or there are other text obstacles, such as ideas that are contrary to expectation or negatively worded. Reflective tasks at this level may require connections, comparisons, and explanations, or they may require the reader to evaluate a feature of the text. Some reflective tasks require readers to demonstrate a fine understanding of the text in relation to familiar, everyday knowledge. Other tasks do not require detailed text comprehension but require the reader to draw on less common knowledge.
Level 2 407
At level 2, some tasks require the reader to locate one or more pieces of information, which may need to be inferred and may need to meet several conditions. Others require recognizing the main idea in a text, understanding relationships, or construing meaning within a limited part of the text when the information is not prominent and the reader must make low level inferences. Tasks at this level may involve comparisons or contrasts based on a single feature in the text. Typical reflective tasks at this level require readers to make a comparison or several connections between the text and outside knowledge, by drawing on personal experience and attitudes.
Level 1a 335
At level 1a, tasks require the reader to locate one or more independent pieces of explicitly stated information; to recognize the main theme or author’s purpose in a text about a familiar topic, or to make a simple connection between information in the text and common, everyday knowledge. Typically the required information in the text is prominent and there is little, if any, competing information. The reader is explicitly directed to consider relevant factors in the task and in the text.
Level 1b 262
At level 1b, tasks require the reader to locate a single piece of explicitly stated information in a prominent position in a short, syntactically simple text with a familiar context and text type, such as a narrative or a simple list. The text typically provides support to the reader, such as repetition of information, pictures or familiar symbols. There is minimal competing information. In tasks requiring interpretation the reader may need to make simple connections between adjacent pieces of information.
NOTE: To reach a particular proficiency level, a student must correctly answer a majority of items at that level. Students were classified into reading literacy levels according to their scores. Cut point scores in the exhibit are rounded; exact cut point scores are provided in appendix B. Scores are reported on a scale from 0 to 1,000.
Highlights From PISA 2009 11
U.S. Performance in Reading Literacy
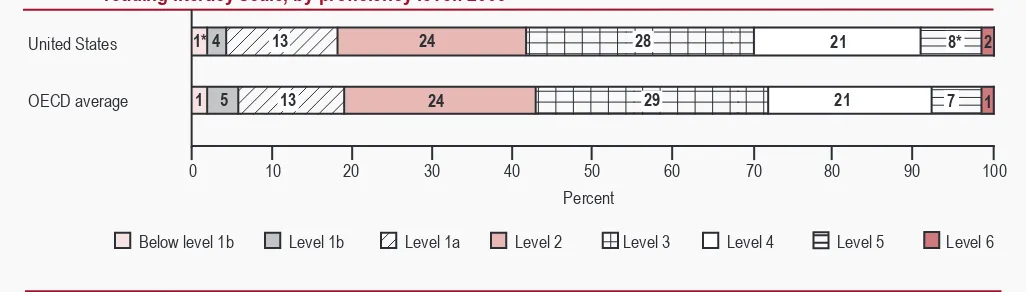
In reading literacy, 30 percent6
or above proficiency level 4, that is, at levels 4, 5, or 6, as shown in figure 3. Level 4 is the level at which students are “capable of difficult reading tasks, such as locating embedded information, construing meaning from nuances of language and critically evaluating a text” (OECD 2010a, p. 51). At levels 5 and 6 students demonstrate higher-level reading skills and may be referred to as “top performers” in reading. While there was no measurable difference between the percentage of U.S. students and the percentage of students in the OECD countries on average who performed at or above level 4, a higher percentage of U.S. students performed at level 5 than the OECD average (8 versus 7 percent). In comparison to the United States, 7 OECD countries and 3 non-OECD countries and other education systems had higher percentages of students who performed at or above level 4 in reading literacy; 14 OECD countries and 27 non-OECD countries and other education systems had lower percentages of students who performed at or above level 4; and for 12 OECD countries and 1 non-OECD country, there were no measurable differences in the percentages of students who performed at or above level 4 (data shown in table R7A at http://nces. ed.gov/surveys/pisa/pisa2009tablefigureexhibit.asp).
Eighteen percent of U.S. students scored below level 2 (that is, at levels 1a or 1b or below 1b). Students performing below level 2 are below what OECD calls “a baseline level of proficiency, at which students begin to
6 This estimate was calculated using unrounded percentages at levels 4, 5, and 6.
of U.S. students scored at demonstrate the reading literacy competencies that will enable them to participate effectively and productively in life” (OECD 2010a, p. 52). Students performing at levels 1a and 1b are able to perform only the least complex reading tasks on the PISA assessment such as locating explicitly stated information in the text and making simple connections between text and common knowledge (level 1a) or doing so in simple texts (level 1b), as described in exhibit 1. Students below level 1b are not able to routinely perform these tasks; this does not mean that they have no literacy skills but the PISA assessment cannot accurately characterize their skills. There was no measurable difference between the percentage of U.S. students and the percentage of students in the OECD countries on average demonstrating proficiency below level 2.
Differences in Performance by
Selected Student and School
Characteristics
This section reports performance on the PISA combined reading literacy scale by selected characteristics of students: sex, racial/ethnic background, and the socioeconomic context of their schools. The results cannot be used to demonstrate a cause-and-effect relationship between these variables and student performance. Student performance can be affected by a complex mix of educational and other factors that are not accounted for in these analyses.
Figure 3. Percentage distribution of 15-year-old students in the United States and OECD countries on combined reading literacy scale, by proficiency level: 2009
*p < .05. Significantly different from the corresponding OECD average percentage at the .05 level of statistical significance.
NOTE: To reach a particular proficiency level, a student must correctly answer a majority of items at that level. Students were classified into reading literacy levels according to their scores. Exact cut point scores are as follows: below level 1b (a score less than or equal to 262.04); level 1b (a score greater than 262.04 and less than or equal to 334.75); level 1a (a score greater than 334.75 and less than or equal to 407.47); level 2 (a score greater than 407.47 and less than or equal to 480.18); level 3 (a score greater than 480.18 and less than or equal to 552.89); level 4 (a score greater than 552.89 and less than or equal to 625.61); level 5 (a score greater than 625.61 and less than or equal to 698.32); and level 6 (a score greater than 698.32). The Organization for Economic Cooperation and Development (OECD) average is the average of the national averages of the OECD member countries, with each country weighted equally. Scores are reported on a scale from 0 to 1,000. Detail may not sum to totals because of rounding. The standard errors of the estimates are shown in table R7 available at http://nces.ed.gov/surveys/pisa/pisa2009tablefigureexhibit.asp.
12 Highlights From PISA 2009
U.S. Performance in Reading Literacy
Sex
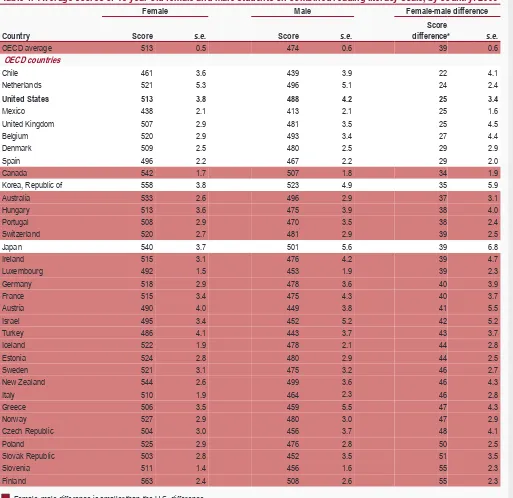
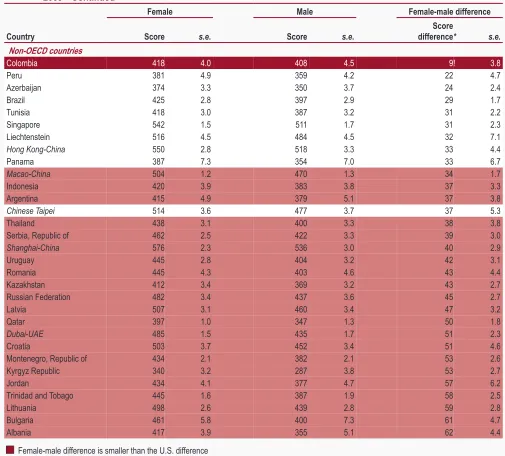
Female students scored higher, on average, than male students on the combined reading literacy scale in all 65 participating countries and other education systems (table 4). The gender gap ranged from a difference of 9 scale score points in Colombia to 62 scale score points in Albania.
In the United States, the difference (25 scale score points) was smaller than the difference in the OECD countries, on average (39 scale score points), and smaller than the differences in 45 countries and other education systems (24 OECD countries and 21 non-OECD countries and other education systems).
Table 4. Average scores of 15-year-old female and male students on combined reading literacy scale, by country: 2009
Female Male Female-male difference Female-male difference is smaller than the U.S. difference
Female-male difference is not measurably different from the U.S. difference Female-male difference is larger than the U.S. difference
Highlights From PISA 2009 13
U.S. Performance in Reading Literacy
Table 4. Average scores of 15-year-old female and male students on combined reading literacy scale, by country: 2009—Continued
Female Male Female-male difference
Score
difference* s.e.
Country Score s.e. Score s.e.
Non-OECD countries Female-male difference is smaller than the U.S. difference
Female-male difference is not measurably different from the U.S. difference Female-male difference is larger than the U.S. difference
! Interpret data with caution. Estimate is unstable due to high coefficient of variation.
* p < .05. All differences between females and males are significantly different at the .05 level of statistical significance. Differences were computed using unrounded numbers.
NOTE: The Organization for Economic Cooperation and Development (OECD) average is the average of the national averages of the OECD member countries, with each country weighted equally. Because the Program for International Student Assessment (PISA) is principally an OECD study, the results for non-OECD countries are displayed separately from those of the OECD countries. Scores are reported on a scale from 0 to 1,000. Standard error is noted by s.e. Italics indicate non-national entities. UAE refers to the United Arab Emirates.
14 Highlights From PISA 2009
U.S. Performance in Reading Literacy
Race/Ethnicity
Racial and ethnic groups vary by country, so it is not possible to compare performance of students in individual countries by students’ race/ethnicity. Therefore, only results for the United States are presented.
On the combined reading literacy scale, White (non-Hispanic) and Asian (non-(non-Hispanic) students had higher average scores (525 and 541, respectively) than the overall OECD and U.S. average scores, while Black
(non-Hispanic) and Hispanic students had lower average scores (441 and 466, respectively) than the overall OECD and U.S. average scores (table 5). The average scores of students who reported two or more races (502) were not measurably different from the overall OECD or U.S. average scores.
The average scores of White (non-Hispanic) students, Asian (non-Hispanic) students, and students who reported two or more races (525, 541, and 502, respectively) were in the range of PISA’s proficiency level 3 (signifies a score of greater than 480 and less than or equal to 553), while the average scores of Black (non-Hispanic) and Hispanic
students (441 and 466, respectively) were in the range of PISA’s proficiency level 2 (signifies a score of greater than 407 and less than or equal to 480). These findings describe average performance and do not describe variation within the subgroup. Students at level 3 on the reading literacy scale are typically successful at “reading tasks of moderate complexity, such as locating multiple pieces of information, making links between different parts of a text, and relating it to familiar everyday knowledge,” as described in exhibit 1, and other tasks that might be expected to be commonly demanded of young and older adults across OECD countries in their everyday lives (OECD 2010a, p. 51). At level 2, which “can be considered a baseline level of proficiency, at which students begin to demonstrate the reading literacy competencies that will enable them to participate effectively and productively in life” (OECD 2010a, p. 52), students can typically locate information that meets several conditions, make comparisons or contrasts around a single feature, determine what a well-defined part of a text means even when the information is not prominent, and make connections between the text and personal experience.
Table 5. Average scores of U.S. 15-year-old students on combined reading literacy scale, by race/ ethnicity: 2009 Native Hawaiian/Other Pacific Islander, non-Hispanic Two or more races, non-Hispanic
OECD average
‡ Reporting standards not met.
*p < .05. Significantly different from the U.S. and OECD averages at the .05 level of statistical significance.
Highlights From PISA 2009 15
U.S. Performance in Reading Literacy
School Socioeconomic Contexts
The percentage of students in a school who are eligible for free or reduced-price lunch (FRPL-eligible) through the National School Lunch Program is an indicator, in the United States, of the socioeconomic status of families served by the school. Other countries have different indicators of school socioeconomic context and thus only results for the United States are shown by the percentage of students in schools who are FRPL-eligible. Data are for public schools only.
Students in public schools in which half or more of
students were eligible for free or reduced-price lunch (50 to 74.9 percent and 75 percent or more) scored, on average, below the overall OECD and U.S. average scores (table
6). Students in schools in which less than 25 percent of students were FRPL-eligible (10 to 24.9 percent and less than 10 percent) scored, on average, above the overall OECD and U.S. average scores. The average scores of students in schools in which 25 to 49.9 percent were FRPL-eligible were above the overall OECD average but not measurably different from the U.S. average.
The average scale score of students in schools with less than 10 percent of FRPL-eligible students (551) was at the upper end of proficiency level 3 (upper cut point is 553), while students in schools with 75 percent or more of FRPL-eligible students performed at the middle of level 2, with an average scale score of 446 (level 2 midpoint is 444), a difference of 105 scale score points.
Table 6. Average scores of U.S. 15-year-old students on combined reading literacy scale, by percentage of students in public school eligible for free or reduced-price lunch: 2009
Percent of students eligible
for free or reduced-price lunch Score s.e. U.S. average
Less than 10 percent 10 to 24.9 percent *p < .05. Significantly different from the U.S. and OECD averages at the .05 level of statistical significance.
16 Highlights From PISA 2009
U.S. Performance in Reading Literacy
Trends in Average Performance
There was no measurable difference between the average score of U.S. students in reading literacy in 2000 (504), the last time in which reading literacy was the major domain assessed in PISA, and 2009 (500), or between 2003 (495) and 2009 (figure 4).7 There also were no measurable
differences between the U.S. average score and the OECD average score in 2000 or in 2009 when the OECD averages were 496 and 495, respectively.
The PISA 2000 and 2009 OECD averages used in the analysis of trends in reading literacy over time are based on the averages of the 27 OECD countries with comparable
7 U.S. reading results for PISA 2006 are not available due to a printing error in
the U.S. test booklets in 2006.
data for 2000 and 2009.8 As a result, the reading literacy
OECD average score for PISA 2000 differs from previously published reports and the reading literacy OECD average score for PISA 2009 differs from that reported in other tables in this report. The recalculated OECD averages are referred to as OECD trend scores. The U.S. averages in 2000 and 2009 are compared with OECD trend scores in 2000 and 2009 because reading literacy was the major domain assessed in those years.
8 OECD trend scores are not reported for 2003 and 2006 because data were not
available for all 27 comparable countries. The seven current OECD members not included in the OECD averages used to report on trends in reading literacy include the Slovak Republic and Turkey, which joined PISA in 2003; Estonia and Slovenia, which joined PISA in 2006; Luxembourg, which experienced substantial changes in its assessment conditions between 2000 and 2003; and the Netherlands and the United Kingdom, which did not meet the PISA response-rate standards in 2000. The OECD excluded the data for Austria from the trend analysis in its report (OECD 2010e) because of a concern over a data collection issue in 2009; however, after consultation with Austrian officials, NCES kept the Austrian data in the U.S. trend reporting.
Figure 4. Average scores of 15-year-old students in the United States and OECD countries on reading literacy scale: 2000, 2003, and 2009
United States OECD trend score
2000 2003 2006 2009 Year
350 400 450 500 550 600 650 1,000
0 Scale score
504
500 496 495 495
NOTE: PISA 2006 reading literacy results are not reported for the United States because of an error in printing the test booklets. For more details, see Baldi et al. 2007 (available at http://nces.ed.gov/pubsearch/pubsinfo.asp?pubid=2008016). The Organization for Economic Cooperation and Development (OECD) average is the average of the national averages of the OECD member countries, with each country weighted equally. Scores are reported on a scale from 0 to 1,000. There were no statistically significant differences between the U.S. average score and the OECD average score in 2000 or in 2009. The standard errors of the estimates are shown in table R5 available at http://nces.ed.gov/surveys/pisa/pisa2009tablefigureexhibit.asp.
Highlights From PISA 2009 17
U.S. Performance in Mathematics Literacy
U.S. Performance in Mathematics Literacy
In PISA 2009, mathematics literacy is defined as follows:
An individual’s capacity to identify and understand the role that mathematics plays in the world, to make well-founded judgments and to use and engage with mathematics in ways that meet the needs of that
individual’s life as a constructive, concerned and reflective citizen (OECD 2009, p. 84).
Performance of Students Overall
U.S. 15-year-olds had an average score of 487 on the mathematics literacy scale, which was lower than the OECD average score of 496 (table 7).9 Among the 33
9 The mathematics literacy scale was established in PISA 2003 to have a mean of
500 and a standard deviation of 100.
18 Highlights From PISA 2009
U.S. Performance in Mathematics Literacy
Table 7. Average scores of 15-year-old students on mathematics literacy scale, by country: 2009
Mathematics literacy scale Mathematics literacy scale
Country Score Country Score
OECD average 496
OECD countries Non-OECD countries
Korea, Republic of 546 Shanghai-China 600
Average is higher than the U.S. average
Average is not measurably different from the U.S. average Average is lower than the U.S. average
Highlights From PISA 2009 19
U.S. Performance in Mathematics Literacy
Performance at PISA Proficiency
Levels
PISA’s six mathematics literacy proficiency levels, ranging from 1 to 6, are described in exhibit 2 (see appendix B for information about how the proficiency levels are created).
Exhibit 2. Description of PISA proficiency levels on mathematics literacy scale: 2009
Proficiency level and lower cut
point score Task descriptions
Level 6 669
At level 6, students can conceptualize, generalize, and utilize information based on their investigations and modeling of complex problem situations. They can link different information sources and representations and flexibly translate among them. Students at this level are capable of advanced mathematical thinking and reasoning. These students can apply this insight and understandings along with a mastery of symbolic and formal mathematical operations and relationships to develop new approaches and strategies for attacking novel situations. Students at this level can formulate and precisely communicate their actions and reflections regarding their findings, interpretations, arguments, and the appropriateness of these to the original situations.
Level 5 607
At level 5, students can develop and work with models for complex situations, identifying constraints and specifying assumptions. They can select, compare, and evaluate appropriate problem solving strategies for dealing with complex problems related to these models. Students at this level can work strategically using broad, well-developed thinking and reasoning skills, appropriate linked representations, symbolic and formal characterizations, and insight pertaining to these situations. They can reflect on their actions and formulate and communicate their interpretations and reasoning.
Level 4 545
At level 4, students can work effectively with explicit models for complex concrete situations that may involve constraints or call for making assumptions. They can select and integrate different representations, including symbolic ones, linking them directly to aspects of real-world situations. Students at this level can utilize well-developed skills and reason flexibly, with some insight, in these contexts. They can construct and communicate explanations and arguments based on their interpretations, arguments, and actions.
Level 3 482
At level 3, students can execute clearly described procedures, including those that require sequential decisions. They can select and apply simple problem solving strategies. Students at this level can interpret and use representations based on different information sources and reason directly from them. They can develop short communications reporting their interpretations, results and reasoning.
Level 2 420
At level 2, students can interpret and recognize situations in contexts that require no more than direct inference. They can extract relevant information from a single source and make use of a single representational mode. Students at this level can employ basic algorithms, formulae, procedures, or conventions. They are capable of direct reasoning and making literal interpretations of the results.
Level 1 358
At level 1, students can answer questions involving familiar contexts where all relevant information is present and the questions are clearly defined. They are able to identify information and to carry out routine procedures according to direct instructions in explicit situations. They can perform actions that are obvious and follow immediately from the given stimuli.
20 Highlights From PISA 2009
U.S. Performance in Mathematics Literacy
In mathematics literacy, 27 percent of U.S. students scored at or above proficiency level 4, that is, at levels 4, 5, or 6 (figure 5 and exhibit 2). This is lower than the 32 percent of students in the OECD countries on average that scored at or above level 4. Level 4 is the level at which students can complete higher order tasks such as “solv[ing] problems that involve visual and spatial reasoning...in unfamiliar contexts” and “carry[ing] out sequential processes” (OECD 2004, p. 55). A lower percentage of U.S. students performed at level 4 than the OECD average (17 percent versus 19 percent) and at level 6 (2 percent versus 3 percent). Twenty-three percent of U.S. students scored below level 2 (that is, at level 1 or below level 1), what OECD calls a “a baseline level of mathematics proficiency on the PISA scale at which students begin to demonstrate the kind of literacy skills that enable them to actively use mathematics” (OECD 2004, p. 56). There was no measurable difference between the percentage
of U.S. students and the percentage of students in the OECD countries on average demonstrating proficiency below level 2. A description of the general competencies and tasks 15-year-old students typically can do, by proficiency level, for the mathematics literacy scale is shown in exhibit 2. In comparison to the United States, 16 OECD countries and 6 non-OECD countries and other education systems had higher percentages of students who performed at or above level 4 in mathematics literacy; 5 OECD countries and 25 non-OECD countries and other education systems had lower percentages of students who performed at or above level 4; and for 12 OECD countries, there were no measurable differences in the percentage of students who performed at or above level 4 (data shown in table M4A at http://nces.ed.gov/surveys/pisa/pisa2009tablefigureexhibit. asp).
Figure 5. Percentage distribution of 15-year-old students in the United States and OECD countries on mathematics literacy scale, by proficiency level: 2009
*p < .05. Significantly different from the corresponding OECD average percentage at the .05 level of statistical significance.
NOTE: To reach a particular proficiency level, a student must correctly answer a majority of items at that level. Students were classified into mathematics literacy levels according to their scores. Exact cut point scores are as follows: below level 1 (a score less than or equal to 357.77); level 1 (a score greater than 357.77 and less than or equal to 420.07); level 2 (a score greater than 420.07 and less than or equal to 482.38); level 3 (a score greater than 482.38 and less than or equal to 544.68); level 4 (a score greater than 544.68 and less than or equal to 606.99); level 5 (a score greater than 606.99 and less than or equal to 669.30); and level 6 (a score greater than 669.30). Scores are reported on a scale from 0 to 1,000. The Organization for Economic Cooperation and Development (OECD) average is the average of the national averages of the OECD member countries, with each country weighted equally. Detail may not sum to totals because of rounding. The standard errors of the estimates are shown in table M4 available at http://nces.ed.gov/surveys/pisa/pisa2009tablefigureexhibit.asp.
SOURCE: Organization for Economic Cooperation and Development (OECD), Program for International Student Assessment (PISA), 2009. United States
OECD average
0 10 20 30 40 50 60 70 80 90 100
Below Level 1 Level 1 Level 2 Level 3 Level 4 Level 5 Level 6 Percent
15
8
8 24*
14
25
22
17*
24 19
2*
3 8
Highlights From PISA 2009 21
U.S. Performance in Mathematics Literacy
Trends in Average Performance
The U.S. average score in mathematics literacy in 2009 (487) was higher than the U.S. average in 2006 (474) but not measurably different from the U.S. average in 2003 (483), the earliest time point to which PISA 2009 performance can be compared in mathematics literacy (figure 6). U.S. students’ average scores were lower than the OECD average scores in each of these years (2003 and 2009).
The PISA 2003 and 2009 OECD averages used in the analysis of trends in mathematics literacy over time are based on the averages of the 29 OECD countries with comparable data for 2003 and 2009.10 As a result, the
mathematics literacy OECD average score for PISA
2003 differs from previously published reports and the mathematics literacy OECD average score for PISA 2009 differs from that reported in other tables in this report. The recalculated OECD averages are referred to as OECD trend scores. The U.S. averages in 2003 and 2009 are compared with the OECD trend scores in 2003 and 2009 because in 2003 mathematics literacy was the major domain assessed.
10 The OECD trend score is not reported for 2006 because data were not
available for all 29 comparable countries. The five current members not included in the OECD averages used to report on trends in mathematics literacy include Chile, Estonia, Israel, and Slovenia, which did not participate in 2003, and the United Kingdom, which did not meet PISA response-rate standards for the 2003 assessment. The OECD excluded the data for Austria from the trend analysis in its report (OECD 2010e) because of a concern over a data collection issue in 2009; however, after consultation with Austrian officials, NCES kept the Austrian data in the U.S. trend reporting.
Figure 6. Average scores of 15-year-old students in the United States and OECD countries on mathematics literacy scale: 2003, 2006, and 2009
United States OECD trend score
2003 2006 2009 Year
350 400 450 500 550 600 650 1,000
0 Scale score
483 487
500*
474**
499*
*p < .05. U.S. average is significantly different from the OECD trend score at the .05 level of statistical significance.
**p < .05. U.S. average in 2006 is significantly different from the U.S. average in 2009 at the .05 level of statistical significance.
NOTE: The PISA mathematics framework was revised in 2003. Because of changes in the framework, it is not possible to compare mathematics learning outcomes from PISA 2000 with those from PISA 2003, 2006, and 2009. For more details, see OECD (2010e). The Organization for Economic Cooperation and Development (OECD) average is the average of the national averages of the OECD member countries, with each country weighted equally. Scores are reported on a scale from 0 to 1,000. The standard errors of the estimates are shown in table M2 available at
http://nces.ed.gov/surveys/pisa/pisa2009tablefigureexhibit.asp.
Highlights From PISA 2009 23
U.S. Performance in Science Literacy
In PISA 2009, science literacy is defined as follows:
An individual’s scientific knowledge and use of that knowledge to identify questions, to acquire new knowledge, to explain scientific phenomena, and to draw evidence based conclusions about science-related issues; understanding of the characteristic features of science as a form of human knowledge and inquiry; awareness of how science and technology shape our material, intellectual, and cultural environments; and willingness to engage in science-related issues, and with the ideas of science, as a reflective citizen (OECD 2009, p. 128).
Performance of Students Overall
On the science literacy scale, the average score of U.S. students (502) was not measurably different from the OECD average (501) (table 8).11 Among the 33 other
OECD countries, 12 had higher average scores than the United States, 9 had lower average scores, and 12 had average scores that were not measurably different. Among the 64 other OECD countries, non-OECD countries, and other education systems, 18 had higher average scores, 33 had lower average scores, and 13 had average scores that were not measurably different from the U.S. average score.
11 The science literacy scale was established in PISA 2006 to have a mean of 500