An integrated mathematical model for co-composting of agricultural solid
wastes with industrial wastewater
A. Vlyssides
*, S. Mai, E.M. Barampouti
National Technical University of Athens, School of Chemical Engineering, 9, Heroon Polytechniou St., Zografou, 15780 Athens, Greece
a r t i c l e
i n f o
Article history:
Received 6 February 2009
Received in revised form 5 May 2009 Accepted 5 May 2009
Available online 28 May 2009
Keywords:
Co-composting Composting Kinetics Modelling Olive mill waste
a b s t r a c t
An integrated model for the composting process was developed. The structure of the model is such that it can be implemented in any mixture of different substrates, even in the case of co-composting of a solid waste with industrial wastewater. This paper presents a mathematical formulation of the physicochem-ical and biologphysicochem-ical principles that govern the composting process. The model of the co-composting eco-system included mass transfer, heat transfer and biological processes. The biological processes included in the model were hydrolysis of particulate substrates, microbial growth and death. Two microbial pop-ulations (bacteria and fungi) were selected using Monod kinetics. Growth limiting functions of inhibitory factors, moisture and dissolved oxygen were added in the Monod kinetics. The bacteria were considered to utilise the easy biodegradable carbon hydrolysis product, fungi the difficult one, while both could degrade the carbon of wastewater. The mass balances of the most important nutrients, nitrogen and phosphorous, were also included in this approach. Model computer simulations provided results that fit-ted satisfactory the experimental data. Conclusively, the model could be a useful tool for the prediction of the composting process performance in the future and could be used to assist in the operation of co-composting plants.
Ó2009 Elsevier Ltd. All rights reserved.
1. Introduction
From the standpoint of chemical engineering, composting is an organic matter decomposition process under aerobic conditions. During this process, bacteria, fungi and other microorganisms transform the initial organic matter into a useful product called compost. During composting, the biodegradable organic com-pounds are broken down whereas part of the remaining organic material is converted into humic-like substances (Veeken et al., 2000). This process consumes oxygen and emits carbon dioxide, water vapor and heat resulting in a volume reduction of the waste and pathogen destruction when a good control is performed ( Keen-er, 1998). Because of its properties, the final compost obtained can be used for many applications (Raviv, 2005; Stoffella and Kahn, 2001) such as soil amendment, organic fertilizer or raw material for other industries. With the aim to enhance the composting pro-cess, increasing the degradation rate and the quality of the final compost, several modifications have been made in the process; such as the addition of biodegradable wastes to reach the optimum C/N ratio of about 30 (Haug, 1993), that is co-composting, and the addition of chemicals to increase the reaction rates and the compo-sition of the compost (Bangar et al., 1988; Brown et al., 1998; Sánchez-Arias et al., 2008).
Other parameters that control the composting procedure are: the temperature of the process, the moisture of the bulking mate-rial and the nutrients (nitrogen and phosphorous) (Finstein et al., 1985; Haug, 1980). For a continuous and stable process, the re-moved by degradation carbon as well as the moisture rere-moved by evaporation must be replaced. The use of a wastewater in order to fill the water needs and partially or totally the carbon needs of a continuously operating composting system can be an effective technological solution. Also, possibly, an easy degradable and nutrient rich bulking material could supplement a nutrient poor wastewater of low degradable, due to inhibitory factors, organic matter and vise versa (Vlyssides et al., 2003).
In order to reach the optimum results in the composting piles, co-composting is widely used. Co-composting processes have been reported for composting of agroindustrial wastes with wastewa-ters. For example, co-composting of exhausted grape marc with different biowastes (Fernández et al., 2008), of winery and distill-ery wastes (Bustamante et al., 2008), of olive mill wastes and sew-age sludge with industrial waste (Sánchez-Arias et al., 2008) has been reported.
The inputs of every co-composting process are a liquid and a so-lid waste. At the end of a successful co-composting process, both inputs would have been stabilised into a solid product that may be used as a fertiliser. Thus, by appropriate control of the opera-tional parameters, co-composting may be used for either the max-imization of the solid waste treatment, or the maxmax-imization of the wastewater treatment or for both.
0960-8524/$ - see front matterÓ2009 Elsevier Ltd. All rights reserved. doi:10.1016/j.biortech.2009.05.005
* Corresponding author. Tel.: +30 2107723268; fax: +30 2107723269.
E-mail addresses:[email protected](A. Vlyssides),[email protected](S. Mai).
Contents lists available atScienceDirect
Bioresource Technology
Proper design and operation of the composting reactor is neces-sary to guarantee a good compost quality and the desired con-sumption of the raw materials (liquid and solid waste). To define the optimal conditions, the dependence of the composting rate on environmental conditions, i.e. composting kinetics should be known (Hamelers, 2004). For this reason mathematical modelling has been widely utilised in the description of the composting pro-cess. Mathematical models of the composting process have ap-peared in the literature since 1976, with more than 100 papers addressing this topic published up to today. In addition, contribu-tions from studies on liquid-phase aerobic digestion and the broad-er field of high solids abroad-erobic degradation have provided models with potential relevance to the understanding and prediction of composting system behaviour (Mason, 2006). Nevertheless com-posting mathematical models that may use wastewater as an input – substrate have not yet been addressed in the literature.
The present study is intended to present an integrated bio-chemical and physical model for such a co-composting process. Taking into account the majority of the approaches of modelling composting kinetics, the model developed would incorporate both the theoretical knowledge (as represented by the basic parame-ters) as well as the information retained in the data (as represented by identifiable combined parameters) (Hamelers, 2004).
2. Model theoretical principles
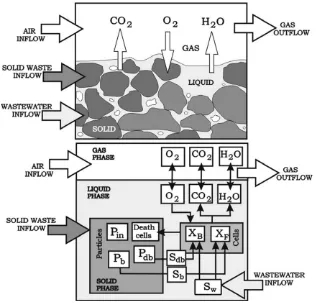
A volume unit (V) formed by a gaseous and a liquid phase was considered, in which the solid particles were immersed or covered by a water film (Fig. 1). Wastewater (WW), solid waste (PP) and air (Air) were the inlet flows. The solid particles were considered spherical and symmetrical with a given particle size distribution (xfractions, each with diameterdx). All phases were regarded as
homogeneous and the particles size was supposed to be small
en-ough so that inner concentration or temperature gradients could be neglected.
A schematic representation of all the processes included in the model is shown inFig. 1. The model contains 21 state variables cor-responding to particulate, soluble and gas components, moisture, temperature and flow rates (Table 1).
For the biological details of the composting process, much more effort had to be made to find a suitable compromise which would keep the model both practicable and realistic. The first problem
Fig. 1.Schematic representation of the considered processes.
Table 1
Components of the model.
i,j Symbol Units Description
1 Pb gC Easy biodegradable carbon in particulate waste
2 Pdb gC Difficult biodegradable carbon in particulate waste
3 Pin g Inert organic material in particulate waste
4 P g Particulate waste
5 XB gC Bacteria
6 XF gC Fungi
7 XD gC Decayed biomass
8 Sb gC Easy biodegradable carbon hydrolysis product
9 Sdb gC Difficult biodegradable carbon hydrolysis product
10 Sw gC Soluble carbon of wastewater
11 DO g/L Dissolved oxygen
12 nO2 mol Oxygen gas
13 nCO2 mol Carbon dioxide gas
14 nH2O mol Water vapor
15 T °C Temperature
16 VL L Liquid phase
17 VC L Co-composting mixture
18 Vg L Gas phase
19 WW g/h Wastewater flow rate
20 Air L/h Air flow rate
that arose was the appropriate limitation of the number of sub-strate and biotic components. The components were classified in a way that each substrate class could be treated like a homoge-neous compound and each biotic class as a homogehomoge-neous popula-tion. Thus, a system of one defined substrate and one defined consuming species could only give a very rough representation of composting; it could not reflect the performance quantitatively, including the speed of start and the duration of the process (Kaiser, 1996). Generally, the substrate range of composting includes com-ponents that vary considerably in degradability and structural properties (bulk density). By comparing literature on composting (Finstein et al., 1986; Biddlestone et al., 1987) and on natural deg-radation of organic matter (Knapp, 1985; Begon et al., 1990; Betts et al., 1991), a natural classification within the substrate range of typical raw materials of composting could be outlined as an easily biodegradable fraction, a difficult biodegradable fraction and an in-ert (non-biodegradable) one (Haug, 1980; Kaiser, 1996). Thus, the composting mass (P) was fractionated into easy biodegradable car-bon (Pb), difficult biodegradable carbon (Pdb) and inert materials
(Pin).
Comparing literature, a natural classification of the microflora range could be outlined. The main representatives of the regularly aerobic degradation of plant materials are bacteria and fungi. So, in this model two microbial populations, each with a particular substrate specificity, were considered: bacteria (XB) and fungi
(XF) (Haug, 1980; Kaiser, 1996). The bacteria were considered to
utilise the easy biodegradable carbon hydrolysis product, fungi the difficult one, while both could degrade the carbon of wastewater.
The biological processes included in the model were hydrolysis of particulate substrates, microbial growth and death (Fig. 1).
3. Hydrolysis
During hydrolysis the particulate substrates make contact with hydrolytic microbial cells and the released enzymes. Two main phases were taken into account for the description of the hydroly-sis kinetics. The first phase is a bacterial colonization, during which the hydrolytic bacteria cover the surface of solids. Bacteria on or near the particle surface release enzymes and produce the mono-mers which can be utilised by the hydrolytic bacteria themselves, as well as by other bacteria. When an available surface is covered with bacteria the surface will be hydrolysed at a constant depth per unit of time (second phase) (Vavilin and Rytov, 1996).
Hydrolysis of particulate matter was considered to be selec-tively performed by bacteria for easy biodegradable particulate matter and by fungi for difficult particulate matter.
It was assumed that the hydrolysis rate was limited by a contact area (A) between the particles of organic substrate and biomass, and the diameter of the hydrolysed particle was much greater than the depth of the bacterial layer. It was also assumed that the total number (N) of the particles per unit volume did not change but that the size of the particles decreased as a result of the hydrolysis. With these assumptions the contact area per unit volume is writ-ten as:
A¼X
p
d2xNx ð1ÞThen, a saturation biomass concentrationX^
jcovering the
con-tact surface of the hydrolysed particles per unit volume is:
^
Xj¼
q
jAd ð2Þwhere
q
jare the densities of bacteria (j= 5) or fungi (j= 6) anddthedepth of minimum microbial layer.
In this context the hydrolysis rate function is equal to:
dPi
wherekhthe hydrolysis constant.
The temperature dependence of the hydrolysis constant was adopted fromHaug (1980).
kh¼kh;T¼20Cð1:066ðT20Þ1:21ðT60ÞÞ ð5Þ
4. Biomass growth
4.1. Carbon mass balances
The kinetics of matter conversion was modelled according to Monod kinetics.
As far as the microbial degradation of hydrolysed soluble prod-ucts is concerned, bacteria were assumed to grow on the prodprod-ucts resulting from the degradation of easy biodegraded matter, while fungi grew on the products resulting from the degradation of dif-ficult biodegraded matter. Both microbial populations could de-grade the carbon content of the wastewater. Thus, it is clear that the carbon of the wastewater should be distributed both to bacteria and fungi. It was assumed that this distribution takes place proportionally to each species growth rate and concentra-tion. In other words, the percentage of wastewater carbon avail-able to bacteria is equal to an F ratio (Eq. (6))) and the rest (1F) to fungi.
F¼
l
BXBl
BXBþl
FXF ð6Þ
According to the assumptions mentioned above, the reaction rates of substrate consumption are shown in the following equations:
where
l
Dis the maximum uptake rate for bacteria,l
Fthe maximumuptake rate for fungi,kSbthe half-saturation concentration of
bacte-ria for the easy biodegradable carbon hydrolysis product,kSdbthe
half-saturation concentration of fungi for the difficult biodegradable carbon hydrolysis product,kSBwthe half-saturation concentration of
bacteria for the wastewater andkSFwthe half-saturation
concentra-tion of fungi for the wastewater.
According toHaug (1980), the correction factor (fmoist) of the
maximum rate constant due to moisture content (moist) is de-scribed by the following equations:
For moist>¼40; fmoist¼117:3 1
The growth limiting function of dissolved oxygen (kDO) is given
kDOj¼ DO
kO2jþDO
ð12Þ
wherekO2is the oxygen saturation constant.
The temperature dependence of the oxygen saturation constant was adopted fromHaug (1980).
kO2¼kO2;T¼201:12
ðT20Þ ð13Þ
Taking into consideration each time the composition of particulate waste as well as the composition of the wastewater, inhibition fac-tors could be included either for bacteria growth or for fungi. In this model inhibition factors were considered to act according to the fol-lowing equation:
fin¼
kin
kinþin ð
14Þ
wherefinis the inhibition factor,kininhibition coefficient and (in)
the concentration of inhibitor.
The microbial growth was described by the following equation:
dXj
dt ¼Y
XdSi
dt bXj ð15Þ
whereYis the biomass yield coefficient andbthe decay rate.
5. Nitrogen and phosphorous mass balances
In order to construct the mass balances for nitrogen and phos-phorous, it was considered that these elements entered the system from the hydrolysis process and from the wastewater, while they were consumed through biomass yield. The nitrogen content of bacteria (Nb), fungi (Nf), particulate matter (NP) and wastewater
(Nw) as well as the respective contents for phosphorous (Phb, Phf,
Php, Phw) were taken into account. The nitrogen mass balance
was described by the following equation:
dN
The phosphorous mass balance was considered by:
dPh
In order to describe the phenomena taking place in the gas phase and consequently construct the mass balances, the term of free air space (FAS) was introduced. FAS are defined as the ratio of gas volume to the total volume of composting mixture (Haug, 1980).
where
q
pis the density of the particulate matter.If co-composting process takes place in a reactor with a certain volume as gas buffer (BF) the gas volume is calculated as:
Vg¼BFþFASVC ð19Þ
Otherwise Vg¼FASVC ð20Þ
The molar balance equation for the components in the gas phase is:
dni
dt ¼ni;intakeni;exhaustþVLri ð21Þ
Fori= 20, 21 and 22.
whereni;intake;ni;exhaustare the in and out molar flows,
respec-tively,rithe rate of production (or consumption) through biological
reactions.
Inflows are determined by the volumetric air flow and standard air composition, while outflows are computed assuming ideal gas behaviour and constant total pressure. The evolution of bioreaction water is directly proportional to the evolution of CO2. According to
the oxidation equation of glucose.
C6H12O6þ6O2!6CO2þ6H2O ð22Þ
1 mol of H2O evolves per mol of CO2, and 1 mol of O2is
con-sumed per mol of CO2(respiration coefficient = 1) (Kaiser, 1996).
The rate of CO2production due to biological reactions is equal to:
rCO2¼rH2O¼ rO2¼
For vapor mass balance the following assumptions were made:
(1) Intake air had a humidityf(kg H2O/m3air).
(2) The exhaust gases were saturated in water and the satura-tion humidity (fs) was calculated according the following
equation (Vlyssides et al., 2003):
fs¼2;40972e0:029781ðT9=5þ32Þ2;22912e0:02578ðT9=5þ32Þ ð24Þ
Taking into consideration the water produced from the biolog-ical reactions (Eq. (23)) and the saturation of exhaust gases in water (Eq.(24)), the water mass balance is as follows:
dVL
dt
q
w¼WWþrH2O18Air ðffsÞ ð25Þ whereq
wis the density of the liquid phase that is assumed water.7. Energy balance
In order to construct the energy balance, it was taken into con-sideration that the heat flow in isobaric (constant pressure) pro-cesses is equal to the enthalpy change (Haug, 1980). The value of specific heat at constant pressure varies depending on the compo-nent. The thermal balance is (Kaiser, 1996):
dQ
whereQis the heat content of the composter,dQbio
dt the evolution of
the bioreactions heat,dQambient
dt the heat loss by conduction from the
surface, dQintake
dt the heat flow via intake air and wastewater and
dQexhaust
dt the heat flow via exhaust air.
The bioreactive evolution heat was considered directly propor-tional to the evolution of CO2(5060 cal/gC) (Finstein et al., 1986),
thus
dQbio
dt ¼5060
XdSi
dt ð27Þ
Heat loss by conduction from the surface is:
dQambient
dt ¼UAc ðTTaÞ ð28Þ
whereUis the overall heat transfer coefficient of the surface,ACthe
composter surface area andTathe ambient temperature. The heat
flow via intake air is:
wherehare the enthalpies of air streams and water,cpthe specific
The heat flow via exhaust air is:
dQexhaust
dt ¼hexhaust
dVexhaust
dt ð31Þ
where hexhaust¼hwater vaporexhaust þh dry
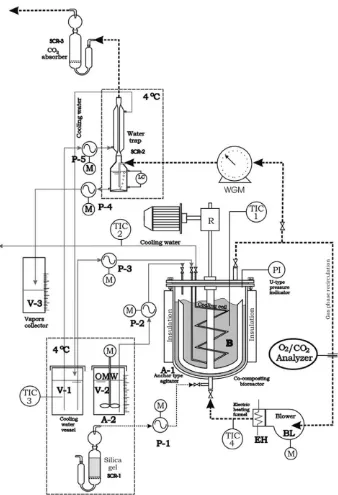
In order to examine the model validity, a fully computerised laboratory apparatus was designed and constructed (Fig. 2). The programmable logic controller (PLC) used was Direct Logic 205. The composter consists of a cylindrical double layered metal auto-clave (10.058 L active volume) with a six wing anchor agitator. The gas phase homogenization is achieved by continuous gas recycling. A O2/CO2gas analyzer (ADC 5000 Gas Analyzer) is included in the
gas-recycling line. During the bioreactions, oxygen is consumed and carbon dioxide is produced, thus the oxygen partial pressure tends to lower. The control of this parameter is performed by feed-ing dry atmospheric air accordfeed-ing to the O2/CO2 gas analyzer’s
indications. Through a simple and fully handleable system the bio-reactor may operate under constant pressure. The exhaust gasses pass through a Wet Gas Meter (WGM) (Ritter Gas meter Drum type TG01) and their moisture is removed by a water trap. Thus the car-bon dioxide and the moisture of the gas phase can be estimated. The wastewater is stored in a refrigerator (4°C) in order to avoid any undesirable biological degradation. The apparatus is able to maintain constant moisture by wastewater addition through a Del-ta-T soil moisture sensor. The temperature inside the bioreactor can be fully controlled through a Temperature Indicator Controller (TIC) (SHIMADEN SR91 with a thermocouple PT100). The heating of the reactor is achieved by the heating of the recycled gas. The temperature of the recycled air is controlled under 80°C. The bio-reactor’s cooling is achieved by circulation of cool (4°C) water be-tween the layers of the reactor. Thus, due to the appropriate design of this apparatus and its automations, temperature, oxygen partial pressure and moisture could be kept constant to a predetermined set point.
9. Raw materials
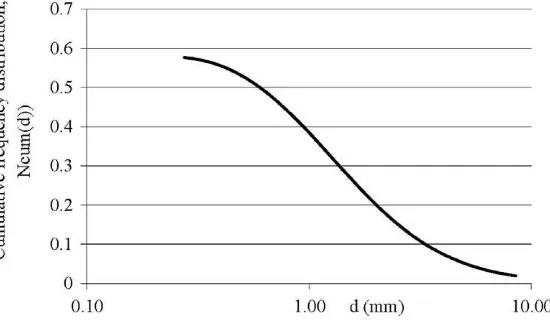
9.1. Olive stone wooden residue
Olive stone wooden residue (OSWR) was used as bulking mate-rial for the co-composting process. The OSWR samples were taken from an olive mill plant in Crete, Greece. The main physical and chemical characteristics of the OSWR used that were analysed according to standard methods (APHA, 1985), are presented in Table 2. The solid residues were classified by sieving (Fritsch, ANALYSETTE 3 PRO) in order to estimate the initial particle size distribution (Fig. 3). For the rest of the parameters like cellulose, hemicellulose and lignin the methods of analysis that are cited in Vlyssides et al. (1999)were used. In order to fractionate the com-posting particulate matter based on the model’s assumptions, cel-lulose and lignin (59.36% of TS) were considered as the difficult biodegradable carbon, while proteins, sugars, fats and oils and hemicellulose (28.41% of TS) as the easy biodegradable carbon and the rest as inert matter (12.23% of TS). The same ratios were adopted for carbon as well. Thus, this bulking material has 0.16 g
easy biodegradable carbon per g OSWR, 0.34 g difficult biodegrad-able carbon per g OSWR.
9.2. Olive mill wastewater
The water needs of co-composting process were fulfilled by ol-ive mill wastewater (OMWW) produced in the same olol-ive mill plant in Crete, Greece. The composition of the OMWW, used for all experiments is shown inTable 3. All parameters were analysed according to standard methods (APHA, 1985).
10. Experimental procedure
The experiments were conducted in a semi-batch mode; the OSWR (6 kg) was loaded in the beginning of each experiment. Dur-ing the 20 days experiment, parameters such as wastewater addi-tion, exhaust gas flow rate and composition were continuously recorded, while total solids, carbon, nitrogen, phosphorous and phenolic compounds in the liquid phase were measured daily. Sev-eral experiments were conducted for the model evaluation. In all experiments temperature, oxygen partial pressure and moisture were controlled in a given set point. For the evaluation experiment that is presented in the paper, the set points were for temperature 70°C, for oxygen partial pressure 17% and for moisture 40%. From the model’s implementation under these conditions, a deficit of nutrients (nitrogen and phosphorous) was estimated. Thus, in the beginning of the experiment, adequate amount of these nutrients (70 g N and 30 g P) was added as di-ammonium hydrogen phos-phate and ammonium carbonate.
11. Model inputs
Three different categories of data are required in the model: ini-tial values (substrate composition), kinetic and operational param-eters. Default kinetic parameter values used in the model are listed inTable 4. The values have been obtained after a literature review, choosing values with physical and biological sense in the frame-work of the developed model.
It has been reported that the hydrolysis constant for the whole process ranged from 0.00324 to 0.1798 h1 (Laspidou and
Ritt-mann, 2001; Sole-Mauri et al., 2007; Tremier et al., 2005; Veeken and Hamelers, 1999).Haug (1980) reported that the constant of hydrolysis rate is a function of temperature and this proposal was adopted in this model. For easy biodegradable carbon the va-lue ofHaug (1980)was selected, whilekh dbwas selected in the
range of the reported values for the whole process considering dif-ficult biodegradable fractions. The densities of bacteria and fungi were adopted fromBakken and Olsen (1983) and were equal to 577 and 580 gC/L respectively. As far as the depth of minimum microbial layer is concerned, it was supposed to be equal to 1.6104mm and 8.3
104mm for bacteria and fungi
respec-tively. For the bacteria, the maximum uptake rate and the half-sat-uration concentration were considered in accordance with Vlyssides et al. (2009), where the biokinetic constants for aerobic degradation of the olive mill wastewater were determined. The respective values for fungi were selected fromSole-Mauri et al. (2007).
For the aerobic degradation of OMWW, the inhibition of pheno-lic compounds is well established in literature (D’Adamo et al., 1984; Liu et al., 2002). Thus, phenolic compounds were chosen to act as an inhibitor factor. In the model’s implementation, phenolic compounds were considered to inhibit just bacterial growth with an inhibition constant equal to 373 mg/L (Vlyssides et al., 2009), whereas fungal growth was not inhibited by any factor (in Eq. (8),fin= 1). Phenolic compounds were considered to be degraded
just by fungi following the same kinetics as the difficult biodegrad-able carbon hydrolysis productSdb. It was also considered that
phe-nols were released during the hydrolysis of both fractions of OSWR. During the model’s implementation, apart from the carbon mass balance, the mass balance of the phenolic compounds was also ac-counted for in order to monitor the formulation of the inhibitor factor. Thus, in the phenolic compounds mass balance, the wastewater content in phenolic compounds and their release rates during hydrolysis (0.08 gCphenol/gCPbhydrolysed and
0.04 gCphenol/gCPdbhydrolysed) were considered.
All microorganisms were supposed to have a biomass yield coefficient (Y) of 0.246 gC/gC (Sole-Mauri et al., 2007; Stombaugh and Nokes, 1996). Stombaugh and Nokes (1996)andSole-Mauri et al. (2007)have previously described the saturation constant val-ues used for substrate and oxygen that have been adopted in this
model. For nitrogen and phosphorous mass balances certain inputs were needed. According toHaug (1980), the chemical formula of aerobic bacteria is C5H7O2N, while of fungi is C10H17O6N. Thus their
nitrogen content is 0.23 gN/gC and 0.12 gN/gC. Phosphorous contents were considered equal to 0.069 gP/gC for bacteria and 0.033 gP/gC for fungi. From Tables 2 and 3, it derived that NP= 2102gN/gChydrolysed, Php= 9104gP/gChydrolysed, Nw= 1.15103gN/g wastewater, Phw= 2.3104gP/g
waste-water.
12. Results
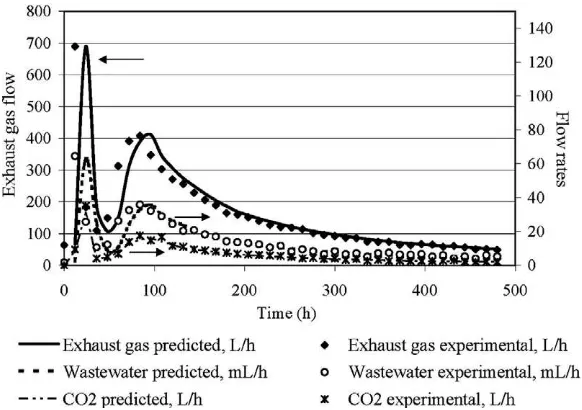
response of the model was compared to the experimental data. Plots of actual and simulated values are shown inFig. 4. The wastewater addition and exhaust gas flow which were parameters directly and continuously recorded during the experiment were in good agree-ment with the predicted results. The wastewater addition was cal-culated from the implementation of the water mass balance that was described by Eq.(25). This approach takes into account the production of water from the biological reactions (Eq.(23)), the saturation of exhaust gases in water as well as the progress of the hydrolysis of particulate matter. The fact that the wastewater addition predicted values follow the same exact pattern as the measured values and present good numerical agreement indicates that the model has managed to incorporate successfully all basic processes (biological and physicochemical) involved in water con-sumption and production. As far as the exhaust gas flow rate is concerned, given the good results that were obtained, the assump-tion that the liquid–gas phase transfer phenomena that were ne-glected did not reduce the credibility of the proposed model. The good prediction of carbon dioxide flow indicates that the proposed model describes adequately the biological activity.
Fig. 5presents the nitrogen and phosphorous concentrations in the liquid phase throughout the experiment. The consumption of macronutrients was performed through biomass yield, while these elements entered the system from the hydrolysis process and from the wastewater. These results are also in good agreement with the predicted values, reflecting the fact that the relative rates of all the involved processes were sensibly assumed.
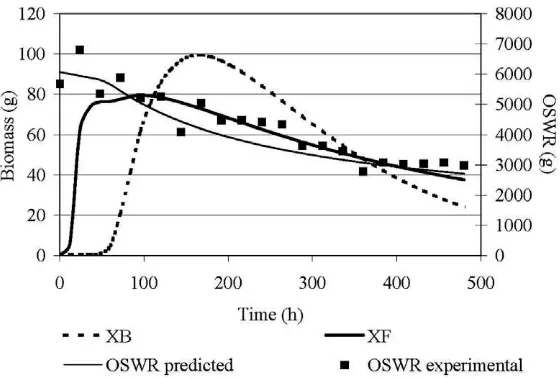
The microorganisms performance is strongly related to the con-centration of carbon and carbon dioxide production, as well as to the concentration of the inhibitory factor (Figs. 4 and 5).Fig. 6 pre-sents the biomass development of the different microbial popula-tions considered in the model. This figure can provide useful information for a better understanding of the data illustrated in Figs. 4 and 5. Biomass from individual populations peaked at differ-ent times. Fungi were the first microorganisms to appear and grow, since they were not inhibited by phenolic compounds. A lag phase of approximately 72 h was observed before the growth of bacteria. By the inhibitory factor’s depletion, bacteria became the predomi-nant population. FromFig. 6, it is obvious that after a certain point the biomass started to decrease, fact that indicates that the bio-mass that was produced was lower than the decayed one. The car-bon dioxide production showed two main peaks, which reflect high microbial activity. The first one can be attributed to the high avail-ability of carbon from wastewater (initial value 42500 mg/L), while the second one to the maximization of bacteria mass.
InFig. 6the reduction of the mass of bulking material (OSWR) is presented. The model succeeded in predicting this mass reduction during co-composting process and this is evidence that the phe-nomena of particulate matter’s hydrolysis were incorporated well in the model. The results presented in this figure are in accordance with literature since Hachicha et al. (2008) mention that a co-composting mixture of olive cake (75%) and poultry manure (25%) that was irrigated with olive mill wastewater presented a 44.4% organic mass loss after 27 days of co-composting in a windrow. In the validation experiment the composting conditions were fully controlled. Thus, a higher hydrolysis rate of the bulking material was justifiable.
13. Discussion
Modelling the complex interaction between relevant and bio-chemical processes during co-composting represents a consider-able challenge. The theory of co-composting is understood and most of the forces involved are known, yet engineering of these Table 2
Physical and chemical characteristics of OSWR in dry base.
Parameter
Moisture (%) 13.50 ± 0.52
Fats and oils (% of TS (total solids)) 1.85 ± 0.69
Nitrogen content substances (% of TS) 7.39 ± 0.037
Total sugars (% of TS) 2.13 ± 0.025
Cellulose (% of TS) 37.39 ± 0.438
Hemicellulose (% of TS) 17.04 ± 0.942
Ash (% of TS) 3.66 ± 0.225
Ether extraction substances (% of TS) 8.61 ± 0.035
Lignin (% of TS) 21.97 ± 0.45
Kjeldahl nitrogen content (% of TS) 1.093 ± 0.015
Phosphorous content as P2O5(% of TS) 0.113 ± 0.008
Potassium content as K2O (% of TS) 0.83 ± 0.07
Calcium content as CaO (% of TS) 0.95 ± 0.092
Total carbon content (% of TS) 56.13 ± 4.48
Carbon/Nitrogen ratio 51.34 ± 4.52
Carbon/Phosphorous ratio 1137 ± 99.11
Fig. 3.Initial density distribution of OSWR.
Table 3
Composition of olive mill wastewater (OMW) used in experiments.
Characteristics Value (mg L1)
pH 4.2
Total organic carbon 42,500
Total phosphorus 230
Total Kjeldahl nitrogen 1150
Total phenolic compounds 14,250
systems is still conducted using ‘‘handbooks” approach with lim-ited knowledge of how to control these forces to achieve the final end product. Composting kinetics modeling is a scientific topic
well established in literature, whereas co-composting kinetics has not yet been cited (Haug, 1980; Kaiser, 1996; Mason and Milke, 2005;Sole-Mauri et al., 2007).
Table 4
Default values for coefficients and parameters used in model evaluation.
Symbol Name Units Value
kh b,T= 20°C Hydrolysis constant of easy biodegradable carbon in particulate waste
d1 0.0126 (Haug (1980))
kh db,T= 20°C Hydrolysis constant of difficult biodegradable carbon in particulate
waste
d1 0.00252 (Haug (1980))
lD Maximum uptake rate for bacteria onSbandSw mg C substrate/mgC
bacteriah1
0.447/1.55 (Vlyssides et al. (2009)) lF Maximum uptake rate for fungi onSbandSw mg C substrate/mgC fungih1 0.122 (Sole-Mauri et al. (2007)) ksb,kSBw Half-saturation concentration of bacteria forSbandSw gC/L 0.002891.07355(20T)(Vlyssides et al.
(2009))
kSdb,kSFw Half-saturation concentration of fungi forSdbandSw gC/L 0.1951.07355(20T)(Haug (1980))
kO2;B;T¼20 Oxygen saturation constant for bacteria g/L 210
6(Sole-Mauri et al. (2007))
kO2;F;T¼20 Oxygen saturation constant for fungi g/L 710
6(Sole-Mauri et al. (2007))
bB Death constant for bacteria h1 0.03 (Sole-Mauri et al. (2007))
bF Death constant for bacteria h1 0.01 (Sole-Mauri et al. (2007))
Fig. 4.Actual and simulated values of the instant wastewater addition, exhaust gas and carbon dioxide flow rates.
Composting kinetic models are generally inductive models. The inductive approach seems to have reached its practical limit. The deductive approach seems therefore an additional fruitful direction to investigate composting kinetics. Care should however be taken not to develop models with non-identifiable parameters, as deduc-tive models of complex systems like composting contain many parameters. To prevent this situation it is proposed that a model should be constructed with combined parameters, i.e. fewer parameters that are identifiable however still a clear relationship with the basic parameters has. The advantage of this approach is that it enables to use information from existing knowledge (as rep-resented by the basic parameters) with the information retained in the data (as represented by the identifiable combined parameters) (Hamelers, 2004). Thus, taking into consideration the mathemati-cal models of composting process, their performance and limita-tions, a new model describing the co-composting process was proposed.
It is known that simplifications of the whole process as a non-biological process described by a first order kinetics or consider-ations of it as a ‘‘single organism and substrate” system didn’t manage to fully describe composting process. It was not until Kai-ser (1996)andSole-Mauri et al. (2007)that the active biomass was divided into different populations, each specialized in certain cate-gories of substrate available in the liquid phase.Kaiser (1996) pro-posed that the first trophic level was described as a consumption of four substrates by a four-component microflora, whileSole-Mauri et al. (2007)proposed an even more complicated system with six polymeric substrates, which were hydrolysed and consumed by six microbial populations. Each population had particular substrate specificity. In an innovative approach, the present model combined the fractionation of the compostable waste into only three frac-tions and the introduction of hydrolysis for each fraction according to the two-phase model for hydrolysis kinetics (Vavilin and Rytov, 1996). Another innovative point in the proposed model was that the wastewater carbon content could be consumed by both micro-bial populations. As in other works, biomass growth was modelled by multiple Monod kinetics for organic substrate and oxygen. In the model presented here, growth limitation due to inhibitory fac-tors was implemented by including a term in the general growth kinetic expression. In the model evaluation, this parameter turned to be crucial. The mass balances of the most important nutrients, nitrogen and phosphorous, were included in this approach. They were considered to be immobilized due to microbial growth, while
they were released in the liquid phase through hydrolysis of the particulate matter and wastewater addition. The principle of mass and energy conservation represented another cornerstone of the model.
Simulations generated with the new model fitted the experi-mental measurements on the time-course exhaust-gas flow and composition, as well as wastewater addition. The description of the biological reactions as well as the liquid–gas equilibrium was adequate enough to represent the co-composting process. The reduction of particulate waste mass was in good agreement with the model predictions, enforcing the assumption for hydrolysis kinetics. Furthermore, the microbial community dynamics were depicted in the simulated results and followed the pattern pro-posed in composting systems (Sole-Mauri et al., 2007). The bio-mass yield and hydrolysis rates were also validated given the successful representation of the macronutrients concentration throughout the experiment. From the validation experiment, it was revealed the selection of the inhibitory factor was crucial. A possible omission would lead to devious results that would under-estimate the credibility of the model. It of vital importance for a sound implementation of the model to be familiarized either experimentally or from literature with the biological kinetic parameters of the raw materials of the co-composting system. Generally, the simulation results justified the classification of sub-strate range and microbial range as well as the model’s assump-tions on substrate utilisation.
14. Conclusions
An integrated model for the co-composting of solid wastes with industrial wastewater was developed. The model of co-composting ecosystem included mass transfer, heat transfer and biological pro-cesses. Two microbial populations (bacteria and fungi) were se-lected using Monod kinetics. The mass balances of the most important nutrients, nitrogen and phosphorous, were also included in this approach. Model computer simulations provided results that fitted satisfactory the experimental data. In summary, the model represents a valuable tool that will contribute to the under-standing of the complex biological and physicochemical interac-tions of co-composting and will be essential for the design and operation of co-composting units in compliance with strict market demands and tight environmental legislation. Further research is directed to calibrate and validate the model in an even wider range Fig. 6.Actual and simulated values of the mass of bulking material (OSWR) and representation of biomass development of the different microbial populations (bacteria and fungi).
of operational conditions and raw materials. For an even more integrated composting model, the gas–liquid transfer coefficients should be incorporated in the model. A biomass growth limiting factor that would take into account the macronutrients availability should also be incorporated in order to predict the performance of the biological system in case of nutrients depletion.
References
APHA, 1985. Standard Method for the Examination of Water and Wastewater, 16th ed. American Public Health Association, Washington.
Bakken, L.R., Olsen, R.A., 1983. Buoyant densities and dry-matter contents of microorganisms: conversion of a measured biovolume into biomass. Appl. Environ. Microbiol. 45 (4), 1188–1195.
Bangar, K.C., Kapoor, K.K., Mishra, M.M., 1988. Effect of pyrite on conservation of nitrogen during composting. Biol. Wastes 25, 227–231.
Begon, M., Harper, J.L., Townsend, C.R., 1990. Decomposers and detritivores. Ecology – Individuals, Populations, Communities. Blackwell, Oxford, pp. 361–389. Betts, W.B., Dart, R.K., Ball, A.S., Pedlar, S.L., 1991. Biosynthetics and structure of
lignocellulose. In: Betts, W.B. (Ed.), Biodegradation: Natural and Synthetic Materials. Springer, London, pp. 139–156.
Biddlestone, A.J., Gray, K.R., Day, C.A., 1987. Composting and straw decomposition. In: Forster, C.F., John Wase, D.A. (Eds.), Environmental Biotechnology. Ellis Horwood, Chichester, pp. 135–175.
Brown, S., Angle, J.S., Jacobs, L., 1998. Beneficial co-utilization of agricultural, municipal and industrial by-products. Kluwer Academic, Doordrecht. Bustamante, M.A., Moral, R., Paredes, C., Vargas-García, M.C., Suárez-Estrella, F.,
Moreno, J., 2008. Evolution of the pathogen content during co-composting of winery and distillery wastes. Bioresour. Technol. 99, 7299–7306.
D’Adamo, P., Rozich, A., Gaudy Jr., A.F., 1984. Analysis of growth data with inhibitory carbon sources. Biotechnol. Bioeng. 26, 397–402.
Fernández, F.J., Sánchez-Arias, V., Villaseñor, J., Rodríguez, L., 2008. Evaluation of carbon degradation during co-composting of exhausted grape marc with different biowastes. Chemosphere 73, 670–677.
Finstein, M.S., Miller, C.F., Macgregor, C.F., Psarianos, M.K., 1985. The Rutgers Strategy for Composting: Process Design and Control, EPA Project Summary, EPA 600/S2-85/059, Cincinnati, Ohio.
Finstein, M.S., Miller, C.F., Strom, P.F., 1986. Waste treatment composting as a controlled system. In: Schönborn, W. (Ed.), Biotechnology. VCH, Weinheim, pp. 363–398.
Hachicha, S., Sallemi, F., Medhioub, K., Hachicha, R., Ammar, E., 2008. Quality assessment of composts prepared with olive mill wastewater and agricultural wastes. Waste Manage. 28 (12), 2593–2603.
Hamelers, H.V.M., 2004. Modeling composting kinetics: a review of approaches. Rev. Environ. Sci. Biotechnol. 3, 331–342.
Haug, R.T., 1993. The Practical Handbook of Compost Engineering. Lewis Publishers, Boca Raton, FL.
Haug, T.R., 1980. Compost Engineering: Principles and Practice. Technomic Publishing Co., Lancaster.
Kaiser, J., 1996. Modelling composting as a microbial ecosystem: a simulation approach. Ecol. Model. 91, 25–37.
Keener, H.M., 1998. Composting Principles and Practices for Design and Operation. The Ohio State University, Ohio Compost Association.
Knapp, J.S., 1985. Biodegradation of celluloses and lignins. In: Moo-Young, M. (Ed.), Comprehensive Biotechnology. Pergamon Press, Oxford, pp. 835–846. Laspidou, C.S., Rittmann, B.E., 2001. Non-steady state modeling of extracellular
polymeric substances, soluble microbial products, and active and inert biomass. Water Res. 36 (8), 1983–1992.
Liu, Y., Woon, K.H., Yang, S.F., Tay, J.H., 2002. Influence of phenol on cultures of acetate-fed aerobic granular sludge. Lett. Appl. Microbiol. 35, 162–165. Mason, I.G., 2006. Mathematical modelling of the composting process: a review.
Waste Manage. 26, 3–21.
Mason, I.G., Milke, M.W., 2005. Physical modelling of the composting environment: a review. Part 1: reactor systems. Waste Manage. 25, 481–500.
Raviv, M., 2005. Production of high-quality composts for horticultural purposes: a mini-review. Hortic. Technol. 15, 52–57.
Sánchez-Arias, V., Fernández, F., Villasenˇor, J., Rodrguez, L., 2008. Enhancing the co-composting of olive mill wastes and sewage sludge by the addition of an industrial waste. Bioresour. Technol. 99, 6346–6353.
Sole-Mauri, F., Illa, J., Magrí, A., Prenafeta-Boldú, F.X., Flotats, X., 2007. An integrated biochemical and physical model for the composting process. Bioresour. Technol. 98, 3278–3293.
Stoffella, P.J., Kahn, B.A., 2001. Compost Utilization in Horticultural Cropping Systems. Lewis Publishers, New York.
Stombaugh, D.P., Nokes, S.E., 1996. Development of a biologically based aerobic composting simulation model. Trans. ASAE 39 (1), 239–250.
Tremier, A., de Guardia, A., Massiani, C., Paul, E., Martel, J.L., 2005. A respirometric method for characterising the organic composition and biodegradation kinetics and the temperature influence on the biodegradation kinetics, for a mixture of sludge and bulking agent to be co-composted. Bioresour. Technol. 96 (2), 169– 180.
Vavilin, V.A., Rytov, S.V., Lokshina, L.Ya., 1996. A description of hydrolysis kinetics in anaerobic degradation of particulate organic matter. Bioresour. Technol. 56, 229–237.
Veeken, A., Hamelers, B., 1999. Effect of temperature on hydrolysis rates of selected biowaste components. Bioresour. Technol. 69 (3), 249–254.
Veeken, A., Nierop, K., de Wilde, V., 2000. Characterisation of NaOH extracted humic acids during composting of a biowaste. Bioresour. Technol. 72, 33–41. Vlyssides, A., Barampouti, E.M., Mai, S., Loukakis, H., Loizides, M., 2009. Phenolic
compounds inhibition kinetics in aerobic degradation of organic wastewaters. Water Environ. Res. 81 (6), 587–591.
Vlyssides,F., Loizides, M., Barampouti, E.M., Mai, S., 2003. Treatment of high organic and toxic strength effluents using the method of co-composting with organic residuals. In: Proceedings of the Eighth European Biosolids and Organic Residuals Conference, Workshop and Exhibition, 23–26 November, Wakefield. Vlyssides, A., Loizidou, M., Zorpas, A.A., 1999. Characteristics of solid residues from