CHAPTER III
RESEARCH METHOD
In this part, it describes about research methodology will be use in conducting the research. It is purposed to answer the problem of the study. This chapter consists of Approach and Type of Research, Population and Sample, Research Instruments, Data Collecting Procedures, Level of Dificulty, and Data Analysis Procedures.
A.Approach and Type of Research.
In this study the writer used quantitative approach because the problem of study was answer through a quantitative approach. Quantitative approach is an approach that emphasizes analysis numerical data which is processed by statistical method.
63
The type of this study was quasi-experimental design. Quasi experimental design is similar to randomized experimental research in that involve
manipulation of an independent variable but differ in that subjects are not
randomly assigned to treatment group.64Because the quasi-experimental design doesnot provide full control. It is extremely important that writer be aware of thethreats to both internal and external validity and consider these factors in their interpretation.65
63
SaifuddinAzwar, MetodePenelitian, Yogyakarta: Pustakapelajar, 2007,p.5 64
Donald Ary, Lucy Cheser Jacobs, Chris Sorensen, and Asghar Razavieh, Introduction to Research in Education, Eight Edition, Wadsworth: Cengage Learning, 2006, p.316.
The writer used nonrandomized control group pre-test, post-test design with a kind of treatment. There are two groups in this model; control group and experimental group. Both of groups will give pre-test to measure the score of students before the treatment given (Y1 and Y2). The treatment will be given for experimental group only (X). Post-test will give for both of groups to measure the score of students after the treatment is given (Y1 and Y2). The scheme of this model is:66
Table 3.1
The Scheme of Quasi Experimental Design
Nonrandomized Control Group, Pretest-Posttest Design
Group Pre-Test Treatment Post-Test
E Y1 X Y1
C Y2 - Y2
Where:
E : Experimental group
C : Control group
X : Treatment
Y1 :Pre-test
Y2 : Post-test
66Ibid.
B.Population and Sample
1. Population
A population is defined as all members of any well defined class of people, events, or object. If someone wants to research all of the elements in research areas, his/her research called poulation research on cencus study.67
The population of this study was 55 tenth grader students of MA HidayatulInsanFiiTa’limiddin Palangkaraya ,the scheme of this population is:
Table 3.2
The Number of the Tenth Grade Students of
MA HidayatulInsanFiiTa’limiddin Palangka Raya
No. Classes The Number of Students
1. X-A 30
2. X-B 25
All Students 55
2. Sample
Sample is a subset of individuals or case from within a population.68 According to Donald Ary, the small group that is observed is called a
67
Donald Ary At All, Introduction to Research in Education, 8th Edition, Wardsworth: USA, 2010, P. 266
68
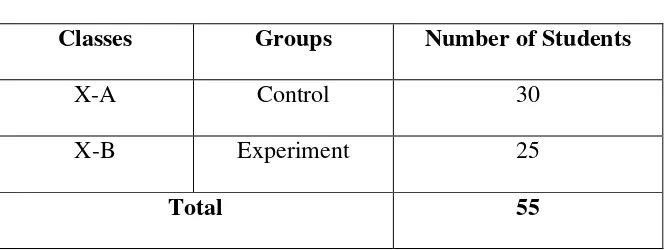
sample.69 To determine the students as experiment group the witer usedcluster sampling where the writer can choose the sample related to the purpose. Cluster sampling is used if the population not an individual but a group of individuals who are naturally together.70 The writer chose cluster sampling because the score of population is heterogeneity. This study will put X-B as the experiment class with 25 students and X-A as the control class with 30 students. The scheme of this sample is:
Table 3.3
The Number of Sample
Classes Groups Number of Students
X-A Control 30
X-B Experiment 25
Total 55
C.Research Instruments
1. Research Instrument
The data is very important in the study to support and prove the study itself.There were two instruments were use in this study , namely test and documentation.
a.Test
69
Donald Ary At All, Introduction to Research in Education, 2nd Edition, P. 129 70Ibid.,
According to Heaton "Test may be constructed primarily as devices to reinforce learning and to motivate student, or primarily as a means of a seeing the student's performance the language.71 A test, in plain woerd, is method of measuring a person ability or knowledge in a given domain.72 The function of test is to measure level of development or achievement achieved by students after they have done learning process in current time.
The writer collected the data of this study by using a test. The result of the test was used to measure the students’ reading scores on narrative text.
According to level of comprehension, this test was constructed in literal level 70%, and Inferential level 30%. The test in this study was multiple choice test item which consists of 40 items for pre-test and 40 items for post-test.the test items were adapted from Develoving English Competiences For Senoir High School (SMA/MA) Grade X by Achmad Doddy, Achmad Sugeng, Effendi, Jakarta: Pusat Perbukuan Departemen Pendidikan Nasional , 2008, and Interlanguage English for Senior High School Students X by Joko Priyana Virga Renita Sari, Arnys Rahayu Irjayanti, Gramedia Widiasarana Indonesia (Rasindo), Jakarta: Pusat Perbukuan Departemen Pendidikan Nasional , 2008
In this study the writer used Multiple Choice Test, because the multiple choise is objective test. Objective test are frequently criticised on the grounds that they are simpler to answer than subjective examinations. Item in an objective test, however, can be made just easy or as difficult as the test
71
J.B Heaton, Language Testing, England: Longman, 1974, p.1 72
constructor wishes.73 Beside of having the strength, a test in form of multiple choise also has a weakness. Multiple choice test type encourages guessing. It can be solved by doing try out of the test items to find out the test validity and realibity.74
a. Scoring Rubric
Indicator Assessment
Technique Instrument Example
Students read narratitive text
Result = Maximal score X correct answer Number of items
Aspect of scoring for students Reading Comprehension.75
No. Categories Scoring
1 Excellent 85-100
73
J.B Heaton, Language Testing, p.12 74
J.B Heaton, Writing English Language Test. England: Longman,1975, p.12 75
2. Good 70-84
3. Enough 60-69
4 Less 50-59
b. Documentation
This technique used to collect written data which are related to the research. Through this technique, the writer would like to get some document from MA HidayatulInsanFiiTa’limiddin Palangkaraya, such as :
1) The data of students ( the students’ names, class and the number of the students),
2) The syllabus of English subject for the tenth grade students of MA HidayatulInsanFiiTa’limiddin Palangkaraya..
3) The students’ pre-test and post-test result. 4) The photos of teaching learning scenario.
2. Research Instrument Try out
1. Preparing the instrument of try out
2. Giving the test items to the students who will be student’s try out. 3. Determine the allocation of time.
4. Collecting and scoring the student answer. 5. Analizing the result of the student test.
After collecting the information about the instrument quality done, the writer will continue to check the validity of test and realibility of test also the level of difficulty of the test time.
3. Research Instrument Reliability
Reliability refers to the consistency of test score. It means how consistent test scores or other evaluation results are from one measurement to another.76 Basically there are three basic methods and the type of information each provides are as follow:
a. Test–Retest method, which indicates the stability of test scores over some given period of time.
b. Equivalent forms method, which indicates the consistency of test scores over different forms of the test.
c. Internal consistency method, which indicates the consistency of test scores over different parts of the test.
The steps in determining the reliability of the test were: a) Making tabulating of tester’s scores.
b) Measuring the mean of the testers’ scores with the formula :
76
M= 𝑿
𝑵x100
c) Measuring the total variants with the formula:
S2= 𝑿
𝟐− 𝑿 𝟐 𝑵
𝑵
Where:
S2= the total variants ΣX = the total of score ΣX2
= the square of score total N = the number of testers
d) Calculating the instrument reliability using KR-21. r11=𝒌−𝟏𝒌 𝟏 −𝑴 𝒌−𝑴 𝒌
.𝑺𝟐
Where:
r11= Reliability of instrument
k = the number of items
M = the mean score for all the testers S2 = the standard deviation of the test score
e) The last decision is comparing the value of r11 and Ttable
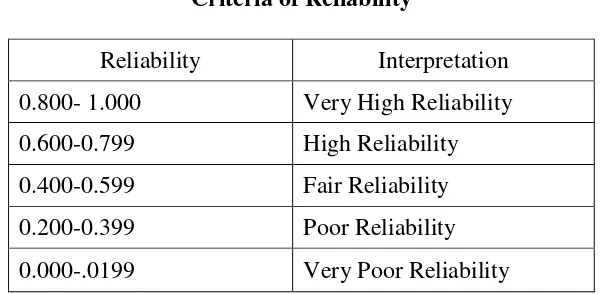
f) To know the level of reliability of instrument, the value of r11was interpreted based on the qualification of reliability as follows:
r11>Ttable= Reliable
Table 3.5 Criteria of Reliability
Reliability Interpretation
0.800- 1.000 Very High Reliability
0.600-0.799 High Reliability
0.400-0.599 Fair Reliability
0.200-0.399 Poor Reliability
0.000-.0199 Very Poor Reliability
4. Research Instrument Validity
Heaton stated that validy of a test is the extanent to which it measures what is supposed to measure and nothing else.77 Validity, on the other hand, involves the degree to which weare measuring what we are supposed to,more simply, the accuracy of the measurement. Validity is more important than reability because if an instrument does not accurately measure what it is supposed to, there is no reason to use it even if it measures consistently (reliably). The test can be said valid if it is able to measure what it is suppose to be measure. Validity in this study distinguished into some kinds as follows:78
1. Face Validity
Face validity is an estimate of whether a test appears tomeasure certaint critetion; it does not guarantee that the test actually measures phenomena in that domain. The face validity represents that instrument should contain a representative sample of the content being assessed, and in a format
77
that is appropriate for those using the instrument. To face validity of the test items as follows:
a) The evaluation by multiple choice tests based on scoring system. b) Kinds of the test items consist of reading narrative text
c) Language uses English.
d) The test items are suitable with syllabus of English subject of the MA HidayatulInsanFiiTa’limiddin Palangkaraya.
2. Constuct Validity
Construct validity refers to the degree to which the research adequately captures the construct of interest. Construct validity can be enhanced when multiple estimates of a construct are used.79 A language test considered to have construct validity when it is capable to measure certain specific characteristics in accordance with theories of language behavior of language learning.
The tests would be based on the syllabus in making. The test will be refered to scope and limitation of the study. The test was about narrative text, reading literacy (Literal) and reading interpretative (inferential) which was refer to Senior High School students. The item test is suitable to the syllabus of the tenth grade students of MA HidayatulInsanFiiTa’limiddin Palangkaraya.
79
3. Content Validity
According to Heaton, a good test should posses’ validity: that is it
should measure what is intended to measure and nothing else.80 If a test does this, it said to be valid. All of the test must be relates to what students learned. In this study instruments are equal and proportional in their distributions as the indicators of test.
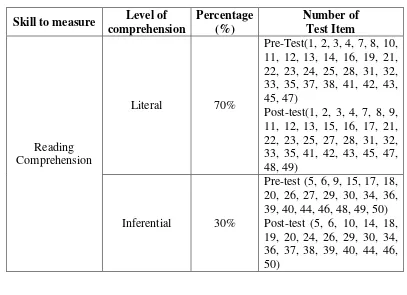
In this study, the writer used multiple choice item tests for students. It was useful to measure their reading comprehension thematerial should be test is about narrative text, it contained generic structure and language features.The contents of test items were then shown in the following table:
Table 3.6
Content Specificationof Items Research Instruments
Skill to measure Level of
From the table above, it was shown that the test items content of 100 items each pre-test 50 and post test 50 items.The percentage of level of comprehension was 70% of literal questions with 60 items and 30% of inferential questions with 40 items. The writer did try out test for getting the pre-test and post-test item. The result of try out test was 56 items of literal questions and 24 item of inferential question. Based on the result of the try out test there were 40 items for pre test and 40 items for post test.
To measure the validity of the instrument, the writer used the formulation of Product Moment by Pearson as follows:81
r
xy=
𝐍 𝐗𝐘−( 𝐗) ( 𝐘) √{𝐍𝚺𝐗²−(𝚺𝐗)²}{𝐍𝚺𝐘²−(𝚺𝐘)²}
Where:
rxy : Total coefficient of correlation ∑X : Total value of score X
∑Y : Total value of score Y
∑XY : Multiplication result between score X and Y N : Number of students
To know the level of validity of instrument, the value interpreted based on the qualification of validity as follows:
t-test>t-table = Valid
t-test>t-table = Not Valid
81
The writer analyzed the data using Pearson Product Moment calculation manually.Then, re-check the manual calculation using Microsoft
Excel program
D.Data Collecting Procedure.
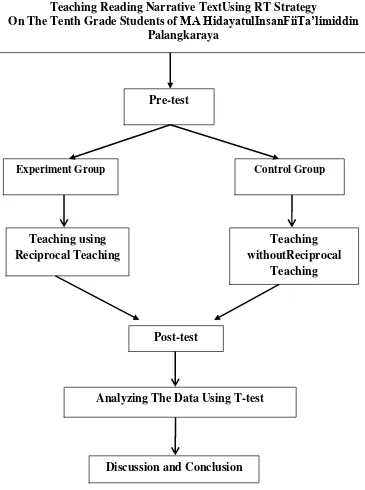
Figure 3.1 Data Collecting Procedure
Teaching Reading Narrative TextUsing RT Strategy
On The Tenth Grade Students of MA HidayatulInsanFiiTa’limiddin
Palangkaraya
Pre-test
Teaching using Reciprocal Teaching
Post-test
Analyzing The Data Using T-test
Discussion and Conclusion
Experiment Group Control Group
Teaching withoutReciprocal
Based on the figure above, the data collecting procedure wereexplain as follows:
1. Observing the class. The writer directly did observation in the fieldwhere the place was taken.It was done to observe the class condition in learning English, to know how the students’ attitude while teaching learning process was going on.
2. The observation was purpose to get specific data, they were: a. The general description of the location of the study. b. The syllabus and lesson plan of the school.
c. The number of class.
d. The number of students and students’ name e. The number of the English Teacher.
f. The process of teaching learning English.
3. Grouping the students into experimental group and control group. 4. Giving pre-test to the experimental group and control group.
5. Teaching English Reading for four times to students in the experimental group by implementing the Reciprocal Teaching strategy and teach English reading to students in the control group with Teacher Centered Method. 6. Giving post-test to the experimental and control group
E.Level of Difficulty
Difficulty standard test is the ability test in the number subject of participant test who can answer correctly.82 If the participants test who can answer correctly, the difficulty level of the test is low. Otherwise, if only a few of the subjects who answer correctly, the difficulty level of the test is high.
Difficulty standard is stated P and the formula as follows:
P =𝐵
𝑗 83
Explanation:
P = Index of Difficulty
B = the number of students who answer question correctly J = the number of all students who follow the test
Then the classifications of the reliability are: - 0,00 < 0,30 = difficult
- 0,30 - 0, 70 = fair - >0.70 = easy.84
F. Data Analysis Procedure
In order to analyze the data, the writer will do some procedures below: 1. Giving tests (pre-test and post-test) to the students at tenth grade
students of MA HidayatulInsanFiiTa’limiddin Palangkaraya. 2. Collecting the score of the students worksheet result.
3. Giving score the students’ answer using the formula:
82
SumarnaSurapnata, Analisi, Validitas,danInterpretasi Hail TesImplementasiKurikulum 2004, Bandung: PT.Remaja Rosdakarya,2006,p.114
83
S = 𝒏
𝑵×𝟏𝟎𝟎%
Where:
S : Students’ score
n : Number of true answer N : Number of tests items
4. Tabulating the data into the distribution of frequency of score table, then find out the mean of students’ score, standard deviation, and
standard error of variable X1 (Experiment group) and X2 (Control group) by using the formulas bellow:
a. Mean of students’ score
𝐗 = 𝒇𝑿ᵢ 𝒏
Where:
∑fXᵢ : Total of score N : Total of the students b. Standard Deviation85
S = 𝒏. 𝒇𝑿ᵢ𝟐− ( 𝒇𝑿ᵢ)² 𝒏.(𝒏−𝟏)
c. Standard Error86 SEM = √𝑵−𝟏𝑺𝑫
85
Riduwan, MetodedanTeknikMenyusun Thesis, Bandung: Alfabeta, 2010, P. 351 86
Where:
SEM : Standard error of the mean SD : Standard deviation
N : Number of cases 1 : Bilangan konstan 5. Normality Test
Used to know the normality of the data that is going to be analyzed whether both groups has normal distribution or not. Chi square is used here.87
X2observed = 𝒌𝒊=𝟏 𝒇ₒ−𝒇ₑ 𝒇ₑ
Where:
X2observed : Chi square
fo : Frequency from observation fe : Expected frequency
Calculation result of X2observed was compared with X2table by 5% degree of significance using the criteria:
If X2observed ≥ X2table,so the distribution list is not normal. If X2observed ≤ X2table,so the distribution list is normal. 6. Homogeneity Test
Used to know whether experimental group and control group that are decide, come from population that has relatively same variant or not. The formula is:88
87
X2observed = 𝒍𝒐𝒏 𝟏𝟎 × 𝑩 − 𝒅𝒌 𝒍𝒐𝒈 𝑺²ᵢ degree of significance, it means both group has same variant.
7. Calculating the data by using ttest to test the hypothesis of the study, whether the use of RT Strategy give effect to the students’ reading
scores or not. To examined the hypothesis, the writer uses ttest. T-test is statistical test which is used to examine the truth or falseness of null hypothesizes states that between two of Sample Mean taken randomly from the same population, there is no significant different.89T-test is used to measure whether RT Strategy give effect to the students reading narrative text score using formula as follows:90
to= 𝑴𝟏−𝑴𝟐
To know the hypothesis is accepted or rejected using the criterion:
88Ibid
, P. 178 89
AnasSudijono, PengantarStatistikPendidikan, Jakarta: Raja GrafindoPersada, 1987, p.278 90Ibid,
If t-test (the value) ≥ ttable, it means Ha is accepted and Ho is rejected. If t-test (the value) ≤ ttable, it means Ha is rejected and Ho is accepted. 8. Interpreting the result of ttest. Previously, the writer accounted the
degrees of freedom (df) with the formula:91
df = (N1 + N2– 2)
Where:
df : Degrees of freedom
N1 : Number of subject group 1 N2 : Number of subject group 2 2 : Number of variables
After that, the value of ttest consulted on the ttable at the level of significance 1% and 5%. In this research, the writer used the level of significance at 5%. If the result or ttest is higher than ttable, it means Ha is accepts. But if the result of ttest is lower than ttable, it means Ho is accepts. 9. Making the conclusion of data analysis obtained.
10.In addition, the writer used SPSS 21.0 program to compare the data. 11.Discussing and concluding the result of data analysis.