The Effect of Profitability, Leverage, Liquidity, and the Company Size on
Aggressiveness Tax the Sector Companies Consumer Goods Industry That
Listed On The Indonesia Stock Exchange Year 2014-2016
a
Islamic University of Surakarta Batik, JL. KH. AgusSalim No. 10, Surakarta, Indonesia
b
Islamic University of Surakarta Batik, JL. KH. AgusSalim No. 10, Surakarta, Indonesia
Corresponding e-mail: [email protected]
Abstract : This research aims to examine and analyze the effect of profitability, leverage, liquidity, and company size on the tax aggressivenes. The tax aggressivenes is an independent variablethat is measure by the ETR (Effective Tax Rate). Variable dependent is an profitability, leverage, liquidity, and company size. The population in this study is sector companies consumer goods industry that listed on The Indonesia Stock Exchange in period 2014-2016. Sampling technique using purposive sampling method obtained by samples of 62 sector companies consumer goods industry that listed on The Indonesia Stock Exchange in period 2014-2016. Data used in this study is secondary data. This research used data in the form of corporate financial statements contained in The Indonesia Stock Exchange (IDX) and www.idx.co.id website. Data analysis method used is multiple linear regression. The result shows that the profitability, leverage, dan size of company do not affect impact on tax aggressiveness. Meanwhile, liquidity affect impact on tax aggressiveness. Based on the determination coefficient test (R2) obtained the coefficient of determination with adjusted R2 of 0,093. This result show that 9,3% of variables tax aggressivenes can be explained by the profitability, leverage, liquidity, and company size. While, the rest of 91,7% is explained by other factors outside in this research.
Keywords: Aggressiveness Tax, Profitability, Leverage, Liquidity, and Company Size.
1. INTRODUCTION
Indonesia is a country with a population that a lot and developing countries that have a number of wealth abundant natural and geography Indonesian strategic to track the world trade. So in Indonesia there are many companies standing good of home and abroad. It will raise income state especially in the sector taxes.
Several factors such as the profitability, leverage, liquidity, and the size of the company is the thing that could affect the level aggressiveness a company. Profitability is a company's
ability to produce a profit. According Rodriguez and Arias (2012) in Nugraha (2015) profitability is determinants of tax expense, because the greater the income generated company then tax would be great too. However, if the company has profit low then pay low tax anyway. With the compensation system tax, loss can reduce the amount of tax are borne on the following year.
Leverage is the ratio of which is used to measure the extent to which assets company financed with debt. Calculation results ratio leverage indicates how big
Erna Setyowatia, Kartika Hendra Titisaria, Riana Rachmawati Dewib
assets owned company that comes from the loan capital of the company.
Subramanyam & Wild (2010) defines the liquidity as a company's ability to meet the obligations of the short-term that conventional, "short-term" is a period of up to one year.
The size of the company is a measurement grouped by large size of the company, and describe the activities of operations and profit acquired the company. According Kurniasari (2013) company great would maintain good name and reputation to reveal the information in fact, has the internal control system and risk management effective, and do social responsibility to get the opinion of a good.
Many previous research that examines aggressiveness tax with variable different and the led to the results of different. So it appears the problems of research on the factors that affect aggressiveness taxes. These differences interesting author to investigate further and do the research re-based phenomenon is going on and existing problems.
Based on the background and previous study the researchers are interested in researching "The Effect Of Profitability, Leverage, Liquidity, And The Company Size To Aggressiveness Tax The Sector Companies Industrial Goods Consumption That Listed In Indonesia Stock Exchange Year 2014-2016".
2. RESEARCH METHODS
2.1 Type Research
This research is quantitative research. According Sugiyono (2012), quantitative research can be interpreted positivistic method with the sampling technique in general, randomized, data collection using the research instruments, data analysis
quantitative or statistics in order to test the hypothesis that has been determined.
2.2 Population and Sampling
Population used in this study is a company industry sector consumer goods registered in Indonesia stock Exchange (IDX) years 2014-2016. Samples in this study selected using purposive sampling. Criteria samples that meets the criteria 62 sector companies consumer goods industry that listed on The Indonesia Stock Exchange in period 2014-2016.
3. METHODS OF DATA
ANALYSIS
3.1 Descriptive Statistical Tests
Testing the descriptive statistics output the form of the size of numerical easier to understand the reader. Picture or descriptive of data seen from the average value (mean), the standard deviation, the maximum, the minimum (Ghozali, 2011).
3.2 Test The Classical
Assumptions
This study using the classical assumption test which includes normality test, multicollinearity test, test heteroscedasticity, and the autocorrelation test.
3.3 Regression Analysis
This study using the regression model multiple linear aimed to determine the effect of one or more independent variables to the dependent variable. This study using the following formula:
Y = α + β1 X1+ β2 X2 + β3 X3 + β4 X4
+ e = -0,721 – 0,017 X1 + 0,001 X2 –
Information:
Y : Effective Tax Rates (ETR) A : Regression coefficients
(constant)
β1 : regression coefficients
profitability
β2 : regression coefficientsleverage
β3 : regression coefficients likuidity
β4 : regression coefficients company
size
X1 : variable profitability
X2 : variable leverage
X3 : variable likuidity
X4 : variable company size
e : eror
3.3.1 F Test
F test is done by looking at the value of F research results (F count) and compare it with F table. If the value of Fcount >
Ftable shows that all the
independent variable together affect the dependent variable with confidence level 5%.
3.3.2 t-Test
t test done by comparing the value of the coefficient of t count with t table, if the value of tcount > ttable then ha will be
accepted and Ho rejected. But
if the value of tcount < ttable
then ha rejected and Ho
accepted. With significant level 5%.
3.3.3 The Coefficient of
Determination
The coefficient of determination (R2) measure how far the ability of the model independent variables in explain the variation of the dependent variable. If the value R2 = 0 then no slightest percentage of the influence of a given the independent
variable to the dependent variable. Instead R2 = 1 then the percentage of the influence of a given the independent variable to the dependent variable is perfect or variation independent variables used in the model describes 100% variable variation of the dependent variable.
4. RESULTS AND DISCUSSION
4.1 Descriptive Statistics
Based test statistic descriptive, the test results descriptive statistics presented in table as follows:
Table 1 Descriptive Statistics
Variable N Min Max Mean Std. Dev
ROA 62 0,023 0,432 0,14640 0,109087
LEV 62 0,017 0,415 0, 09848 0,097794
CR 62 0,514 7,604 2,69898 1,554226
SIZE 62 25,842 32,085 28, 78150 1,592068
ETR 62 0,222 0,299 0,25715 0,17424
Valid N 62
Source: of Results Data, 2017
1,592068. Variable aggressiveness tax have a minimum value for 0,222, the maximum of 0,299, with an average (mean) for 0,25715 and the level of Std. deviation of 0,17424.
4.2 Test The Classical
Assumptions
4.2.1 Test of Normality
Normality test aims to test the variable bully or residual in regression model. Regression models good is to have the data distributed normal. After testing obtained results normality test as follows:
Table 2 Test of Normality
Variable Sig Standar Description Unstandar
dized Residual
0,389 >0,05 Normal
Source: of Results Data, 2017
The results of normality test showed that the value of the significance of the variables unstandardized residual value> 0,05 amounting 0,389. It can be concluded that distributed data normally.
4.2.2 Multicollinearity Test
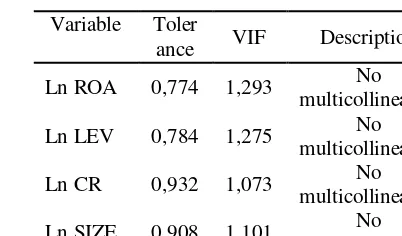
Multicollinearity test aims to test whether in regression model found the correlation between the independent variables . With the value of the cutoff commonly used to indicate multikolonieritas is the value of tolerance < 0,1 or value VIF > 10 (priyatno, 2009). After testing obtained results multicollinearity test as follows:
Table 3 Multicollinearity Test
Variable Toler
ance VIF Description Ln ROA 0,774 1,293 No
multicollinearity Ln LEV 0,784 1,275 No
multicollinearity Ln CR 0,932 1,073 No
multicollinearity Ln SIZE 0,908 1,101 No
multicollinearity Source: of Results Data, 2017
Test results multicollinearity show that the entire independent variables used in this study has a value of Tolerance > 0,1 and value VIF <10. It can be concluded that there is no symptoms multicollinearity on variable studied.
4.2.3 AutocorrelationTest
Autocorrelation test is used to know whether or not deviation assumption classical autocorrelation the correlation happened between the residual on one observations with the observation of the other in the regression model. Based testing obtained results autocorrelation test as follows:
Table 4 Autocorrelation test
Model
Durbin-Watson Information Description 1 2,483 dU < d <
4-dU
No autocorrelation Source: of Results Data, 2017
and 1,455. Pursuant to which has been described above that the value of d is located on the dU < d< 4-dU, it can be concluded that there is no autocorrelation in this study.
4.2.4 Heteroscedasticity Test
Heteroscedasticity test aims to test whether in regression model happen inequality variance of the residual one observations to the observation of the other. Regression models good is the homoskedastisitas or not the case heteroscedasticity (Ghozali, 2011).
Research to know whether or
not symptoms
heteroscedasticity known by using the test glejser, provided that if the value of the significance of the entire independent variable has a value > 0,05, then it can be concluded that there is no symptoms heteroscedasticity. After testing obtained test results heteroscedasticity as follows:
Table 5 Heteroscedasticity Test
Variable Sig Standart Description Ln ROA 1 >0,05 No
heteroscedasticity Ln LEV 1 >0,05 No
heteroscedasticity Ln CR 1 >0,05 No
heteroscedasticity Ln SIZE 1 >0,05 No
heteroscedasticity Source: of Results Data, 2017
Based on the test heteroscedasticity in table 5 shows that all the independent variables used in this study has a value of significance> 0,05. It can be concluded that
there is no symptoms heteroscedasticity on the regression model or variance of the residual one observations to observations
other remain
homoskedastisitas.
4.3 The Regression Test
Based testing obtained results multiple linear regression analysis as follows:
Table 6 The Regression Test
Variable β Sig
Constant -0,721 0,188
Ln ROA -0,017 0,195
Ln LEV 0,001 0,911
Ln CR -0,03 0,028
Ln SIZE -0,193 0,223
Source: of Results Data, 2017
4.4 Test the Hypothesis
4.4.1 F Test
F test basically shows are all the independent variables included in the model has influence silmutan against the dependent variable. If the value of Fcount > Ftable shows
that all the independent variable together affect the dependent variable with confidence level 5%. After testing obtained test results F as follows:
Table 7 F Test
Model Fcount Ftable Sig
Standar
t Result
1 2,569 2,53 0,048 <0,05
Model of a Significan Source: of Results Data, 2017
F test results show that F count of 2,569. This means that Fcount > Ftable (2,569>
significance of 0,048 which means less than 0,05 (0,048 <0,05). So it can be concluded that the study can explain between the independent variable (profitability, leverage, liquidity, company size) affect the dependent variable (aggressiveness tax) and eligible to research.
4.4.2 t Test
t test basically shows how far the influence of the independent variable individually in explain the variation of the dependent variable. If the value of tcount
> ttable then ha will be
accepted and ho rejected. But if the value of tcount <
ttable then Ha rejected and Ho
accepted. With significant level 5%. After testing obtained results hypothesis test (t test) as follows:
Table 8 t Test Source: of Results Data, 2017
Based on the t test can be explained the hypothesis that formed as follows:
a. Variable the profitability of value -tcount of -1,313. It
turns out -t calculate>- ttable (-1,313 > -2,002) and
the value of the
significance of 0,195 which means greater than 0,05 (0,454>0,05). Then this means Ho received
and H1 rejected. That is
variable the profitability of no effect on aggressiveness taxes. b. Variable leverage value
tcount of 0,113. It turns out
tcount< ttable (0,113<2,002)
and the value of the significance of 0,911 which means greater than 0,05 (0,911>0,05). Then this means Ho received
and H2 rejected. That is
variable leverage not affect the aggressiveness taxes.
c. Variable liquidity value tcount for -2,250. It turns
out - tcount< -ttable
(-2,250<-2,002) and the value of the significance of 0,195 which means greater than
>-ttable (-1,232>-2,002) and
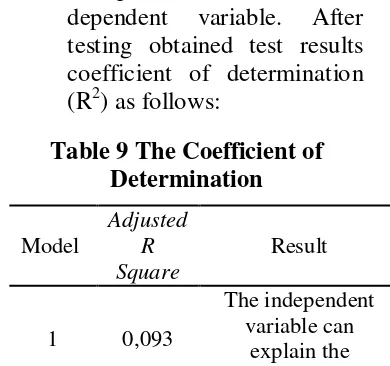
4.4.3 The Coefficient of Determination
The coefficient of determination (R2) measure how far the ability of the model independent variables in explain the variation of the dependent variable. After testing obtained test results coefficient of determination (R2) as follows:
Table 9 The Coefficient of Determination
Model
Adjusted R Square
Result
1 0,093
The independent variable can
explain the dependent variable Source: of Results Data, 2017
The results show that the independent variables used in this study can explain the variation of the dependent variable in this case aggressiveness tax of 9,3%. It looks of value Adjusted R Square of 0,093. While for 91,7% dependent variable aggressiveness tax influenced by the variables other outside the model of this research.
5. DISCUSSION
5.1 The Effect Of The Profitability Of Aggressiveness Tax
Based on the hypothesis testing showing variables the profitability of no effect on aggressiveness tax, then the H1 rejected. This result in line
with the research Lanis & Richardson (2011), Ardyansah (2014), Nugraha (2015), and Rosalia (2017) that is not supported by the empirical evidence.
These results are not in line with Chiou et al. (2012), Syah & Supriyadi (2014) and Ribeiro et al. (2015) showed that ROA influential positive and significant to ETR. While Noor (2010) and Agusti (2015) showed that ROA negatively affect ETR.
The profitability of a company low and high will not affect the aggressiveness tax, because the majority of a company of there is a profit high want tax payments as low as possible in a way that allowed by legislation.
5.2 The Effect Of The Leverage Of Aggressiveness Tax
Based on the hypothesis testing showing variables leverage not affect the aggressiveness tax, then H2
rejected. These results are not in line with the study conducted by Lanis & Richardson (2011), Agusti (2014), Ardyansyah (2014), Dyah & Supriyadi (2014), Anita (2015), Adisamartha & Noviari (2015), Tiaras And Victory (2015), and Swingly & Sukartha (2015) that is not supported by the empirical evidence. These results are not in line with Ribeiro et al. (2015) showed leverage positive influence to ETR. Nugraha (2015) and Fadli (2016) showed leverage significantly influence aggressiveness corporate tax.
5.3 The Effect Of The Liquidity Of Aggressiveness Tax
Based on the hypothesis testing showing variables liquidity affect aggressiveness tax, then H3 accepted.
This result in line with the study conducted by Anita (2015), Adisamartha & Noviari (2015), And Fadli (2016), which is supported by the presence of empirical evidence. These results are not in line with Rosalia (2017) and Tiaras & Wijaya (2015) showed that the liquidity not affect the tax avoidance.
The results of this study explained that liquidity high and low will affect aggressiveness tax, because if liquidity high aggressiveness tax will also be a high because of the company's ability to meet the obligations of the tax filled with either by in accordance with that have been calculated and set.
5.4 The Effect Of The Company Size Of Aggressiveness Tax
Based on the hypothesis testing showing variables the size of the company does not affect the aggressiveness tax, then H4 rejected.
This result in line with the study conducted by richardson & lanis (2017), lanis & richardson (2011), anita (2015), and nugraha (2015) that is not supported by the empirical evidence. These results are not in line with the research conducted Noor (2010), Chiou et al. (2012), and Ribeiro et al. (2015) that the company size effect positive and significant to ETR. Research Ardyansah (2014) Tiaras and Wijaya (2015) showed that the company size significantly influence effective tax rate. Further research conducted by Swingly & Sukartha (2015) showed company size positive influence of the tax avoidance.
The results of this study explained that the level size of a company will not affect the aggressiveness tax, because of the company great tend want profit or revenues for prosperity company owner than meet the obligations of taxation.
6. CONCLUSION
The purpose of this study is to test and analyze the influence of profitability, leverage, liquidity and the size of the company to aggressiveness taxes. This study using a sample of 62 sector companies consumer goods industry that listed on The Indonesia Stock Exchange in period 2014-2016.
Based on the testing, stating that the profitability, leverage, and the size of the company does not affect the aggressiveness taxes. While the test results liquidity affect aggressiveness taxes.
7. REFERENCE
Adisamartha, I. B., & Noviari, N. (2015). Pengaruh Likuiditas, Leverage, Intensitas Persediaan dan Intensitas Aset Tetap Pada Tingkat Agresivitas Wajib Pajak Badan. E-Jurnal Akuntansi. ISSN: 2303-1018
(pp. Vol.13.3 Desember (2015): 973-1000). Bali: Fakultas Ekonomi dan Bisnis Universitas Udayana.
Anita, F. (2015). Pengaruh Corporate Social Responsibility, Leverage, Likuiditas, dan Ukuran Perusahaan Terhadap Agresivitas Pajak.
Faculty of Economics Riau University, Pekanbaru , Vol. 2 No. 2 1-15.
Ardyansah, D. (2014). Pengaruh Size,
Rate (ETR). Diponegoro Journal of Accounting , Vol.3, No.2, hlm 1-9.
Fadli, I. (2016). Pengaruh Likuiditas,
Leverage, Komisaris Independen, Manajemen Laba, dan Kepemilikan Institusional Terhadap Agresivitas Pajak Perusahaan. JOM Fekom, Vol.3 No.1 (pp. 1205-1219). Pekanbaru: Faculty of Economics Universitas Riau.
Ghozali, I. (2011). Aplikasi Analisis Multiariate dengan Program IBM SPS. Semarang: Badan Penerbit Universitas Diponegoro.
Kurniasari, W. I. (2013). Pengaruh Luas Pengungkapan Corporate Social Responsibility Dan Keberadaan
Risk Management Committee
Terhadap Agresivitas Pajak Perusahaan. Skripsi. Fakultas Ekonomi dan Bisnis. Universitas Diponegoro. Semarang .
Lanis, R., & Richardson, G. (2011).
Corporate social responsibility and tax aggressiveness: An empirical
analysis. Sydney: Journal
Accounting Public Policy 31 (2012) 86–108.
Nugraha, N. B. (2015). Pengaruh
Corporate Social Responsibility, Ukuran Perusahaan, Profitabilitas, Leverage Dan Capital Intensity
Terhadap Agresivitas Pajak.
Skripsi. Jurusan Akuntansi Fakultas Ekonomika dan Bisnis, Universitas Diponegoro .
Priyatno, D. (2009). 5 Jam Belajar Olah Data dengan SPSS 17. Yogjakarta: CV Andi Offset.
Richardson, G., & Lanis, R. (2007).
Determinants of the variability in corporateeffective tax rates and tax reform: Evidence from Australia.
Journal of Accounting and Public Policy , 689–704.
Rosalia, Y. (2017). Pengaruh Profitabilitas, Likuiditas Dan
Corporate Governance Terhadap Penghindaran Pajak. Jurnal Ilmu dan Riset Akuntansi, STIESIA, Surabaya , Volume 6, Nomor 3, Maret 2017.
Subramanyam, K. R., & Wild, J. J. (2010). Analisis Laporan Keuangan. Jakarta: Salemba Empat.
Sugiyono. (2012). Metode Penelitian
Pendidikan (Pendekatan
Kuantitatif, Kualitatif dan R&D).
Bandung: Alfabeta.