MALAYSIA
COUNTRY PAPER ON
PEPPER PRODUCTION, PROCESSING AND TRADE FOR THE 42th PEPPER EXPORTERS’ MEETING
25th NOVEMBER 2011
SHERATON SENGGIGI BEACH RESORT & HOTEL, LOMBOK ISLAND, INDONESIA
1. Introduction
This paper updates delegates of the IPC Pepper Exporters’ Meeting on the following aspects:
• The current status of pepper production in Malaysia
• The acreage and production for the year 2010-2012
• The factors affecting current production and productivity of pepper holdings
• The monthly average prices
• Trade and investment policies
• Export, domestic consumption and carryover stock
• The on-going research and development programmes
2. Production
2.1 Current Status of Pepper Production
The state of Sarawak is the main pepper producing region in Malaysia accounts for more than 90% of the country’s annual production. The other producing areas are Sabah and Peninsular Malaysia. Production for 2011 is estimated at 25,672 tonnes, an increase of 5.96% from 24,227 in 2010. The hectarage and production figures are shown in Tables 1, 2 and 3 respectively.
Table 1: Hectarage Under Pepper Cultivation for 2010-2011 (ha)
Year New Planting
Area Productive Area
Non-Productive
(*) denote estimation
Table 2: Distribution of Pepper Cultivation for the Year of 2011 and 2012
Report of 42nd Pepper Exporters Meeting, 25th Nov. 2011
128
Table 3: Production of Black and White Pepper for 2010, 2011 and Projection 2012 (mt)
Year Black White Total
2010 2011* 2012**
16,959 17,970 18,550
7,268 7,702 7,950
24,227 25,672 26,500
(*) denote estimated and (**) denote forecast
2.2 Factors affecting current production and productivity of holdings
a) Pepper Price
The international prices for black and white pepper had increased and farmers responded to the rise in prices by giving better maintenance and expanding the hectarage. As a result, the total hectarage in Malaysia for pepper increased to about 4% from 13,618 hectares in 2009 to 14,174 hectares in 2010. The production also increased from 21,915 tonnes in 2009 to 24,227 tonnes in 2010.
b) Pests and Diseases
The losses of pepper crop due to major diseases such as Phytophora foot rot, black berry, velvet blight and wrinkled leaf diseases and damaging pests like tingid bugs, pepper weevils and nematodes remain a serious problem. Thus, farmers are advised to start a new plot in disease-free areas.
c) High Cost of Inputs
The costs of agricultural inputs, particularly the compound fertilizers and herbicides remain high. It was made worst by high transportation cost due to fuel price increase and therefore increases the cost of farm maintenance.
d) Weather Patterns
Generally, the weather pattern in 2011 have been favourable to the crop however it was forecasted the possibility of heavy rains towards the end of 2011 and it may affect the production in 2012.
3. Processing
3.1 Methods of Processing, Packaging and Storage
3.2 Processing Facilities
Various pepper processing facilities has been set up by both the government and industry players to meet their customers’ product expectation and demand. These facilities include physical cleaning machine, sterilization and grinding facilities.
4. Trade
4.1 Current status of pepper exports from Malaysia is as shown in Table 4.
Table 4: Malaysia Pepper Export by Destination for the Year 2009, 2010 & 2011
No. Destination
2009 2010 2011 (Jan – Aug)
Tonnes RM
(Million) Tonnes
RM
(Million) Tonnes
RM (Million)
1. Caribbean - - 1.00 15.70 -
-2. Eastern Africa 20.37 145.17 7.15 62.72 7.86 76.23
3. Eastern Asia 9,228.19 113,256.86 9,344.99 135,945.16 5,499.55 102,148.30
4. Eastern Europe - - - - -
-5. Northern Africa 8.77 67.44 - - -
-6. Northern America 91.30 1,567.66 288.15 5,052 121.78 2,874.88
7. Northern Europe 248.10 3,960.97 235.16 4,541.58 366.77 6,830.86
8. Oceania-Australia & NZ 127.29 1,762.98 110.19 1,938.97 96.06 1,787.84
9. Oceania-Melanesia 0.32 3.04 0.38 6.27 0.05 1.54
10. Oceania-Polynesia - - 0.09 2.86 -
-11. South America 6.57 106.60 0.14 2.36 -
-12. South-Central Asia 135.30 991.94 115.22 1,298.69 70.05 755.36
13. South-Eastern Asia 2,802.92 28,848.87 3329.35 40,840.81 1,978.42 32,943.79
14. Southern Africa 35.96 391.41 43.45 368.78 80.42 1,159.04
15. Southern Europe 78.22 799.25 152.97 2,366.91 143.32 2,331.80
16. Western Asia 4.40 89.84 45.66 658.4 31.14 551.46
17. Western Europe 335.81 4,146.09 402.69 6,199.25 161.02 3,678.08
TOTAL 13,123.52 156,138.12 14,076.59 199,300.46 8,556.44 155,139.18
Source: Departments of Statistics, Malaysia
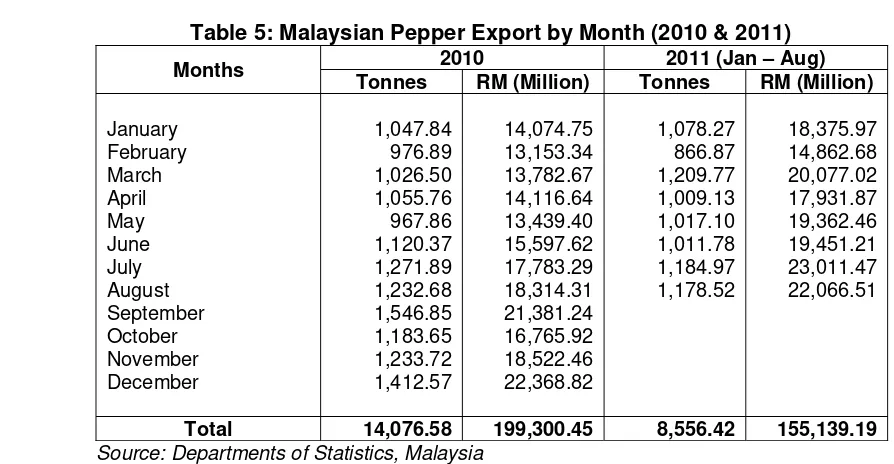
a) Monthly Export of Whole and Ground Black and White pepper
Table 5: Malaysian Pepper Export by Month (2010 & 2011)
Months 2010 2011 (Jan – Aug)
Tonnes RM (Million) Tonnes RM (Million)
January
Report of 42nd Pepper Exporters Meeting, 25th Nov. 2011
130
Table 6: Estimate of Total Exports for 2011 and Projection for 2012
Year Tonnes Value
RM (Million)
2011
2012 (projection)
15,500 18,000
220.00 250.00
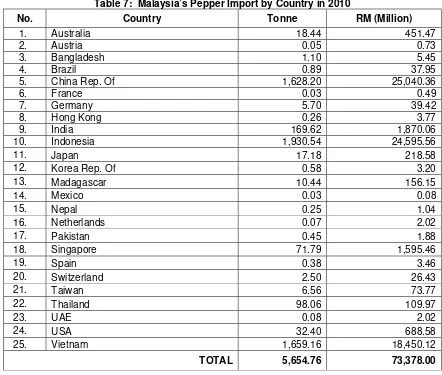
4.2 Import of Pepper
Malaysia imported 5,654.76 tonnes of pepper in 2010. The details are as shown in Table 7.
Table 7: Malaysia’s Pepper Import by Country in 2010
No. Country Tonne RM (Million)
1. Australia 18.44 451.47
2. Austria 0.05 0.73
3. Bangladesh 1.10 5.45
4. Brazil 0.89 37.95
5. China Rep. Of 1,628.20 25,040.36
6. France 0.03 0.49
7. Germany 5.70 39.42
8. Hong Kong 0.26 3.77
9. India 169.62 1,870.06
10. Indonesia 1,930.54 24,595.56
11. Japan 17.18 218.58
12. Korea Rep. Of 0.58 3.20
13. Madagascar 10.44 156.15
14. Mexico 0.03 0.08
15. Nepal 0.25 1.04
16. Netherlands 0.07 2.02
17. Pakistan 0.45 1.88
18. Singapore 71.79 1,595.46
19. Spain 0.38 3.46
20. Switzerland 2.50 26.43
21. Taiwan 6.56 73.77
22. Thailand 98.06 109.97
23. UAE 0.08 2.02
24. USA 32.40 688.58
25. Vietnam 1,659.16 18,450.12
Report of 42nd Pepper Exporters Meeting, 25th Nov. 2011
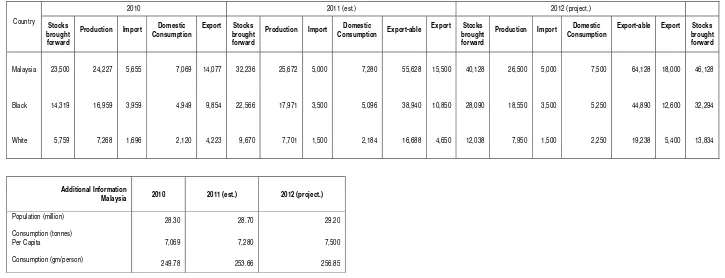
131 5. Summary of Production, Export, Domestic Consumption and Carry-over Stock of Pepper in 2010, Estimates for 2011 and Projections for 2012
Table 8
Country
2010 2011 (est.) 2012 (project.)
Stocks brought forward
Production Import Domestic
Consumption
Export Stocks
brought forward
Production Import Domestic
Consumption Export-able
Export Stocks
brought forward
Production Import Domestic
Consumption
Export-able Export Stocks
brought forward
Malaysia 23,500 24,227 5,655 7,069 14,077 32,236 25,672 5,000 7,280 55,628 15,500 40,128 26,500 5,000 7,500 64,128 18,000 46,128
Black 14,319 16,959 3,959 4,949 9,854 22,566 17,971 3,500 5,096 38,940 10,850 28,090 18,550 3,500 5,250 44,890 12,600 32,294
White 5,759 7,268 1,696 2,120 4,223 9,670 7,701 1,500 2,184 16,688 4,650 12,038 7,950 1,500 2,250 19,238 5,400 13,834
Additional Information
Malaysia 2010 2011 (est.) 2012 (project.)
Population (million) 28.30 28.70 29.20
Consumption (tonnes)
Per Capita 7,069 7,280 7,500
Consumption (gm/person) 249.78 253.66 256.85
Report of 42nd Pepper Exporters Meeting, 25th Nov. 2011
132
6. Pepper Prices
In 2010, the local pepper prices for black and white pepper were opened at RM9,360/tonne and RM15,320/tonne respectively. The prices continued to increase steadily in the second and third quarter of 2010 and closed at RM10,050/tonne for black pepper and RM16,000/tonne for white pepper by the end of September. Pepper prices remain stronger until the end of fourth quarter of 2010 due to limited supply. By the end of December, the prices were RM12,100/tonne for black pepper and RM19,500/tonne for white pepper.
In 2011, the domestic prices increased sharply compared to 2010. In January 2011, the pepper market for both black and white were considered to be very dynamic and prices demonstrated a sharp increasing trend as compared to 2010. By the end of October, the prices were closed at RM17,600/tonne for black pepper and RM27,330/tonne for white pepper.
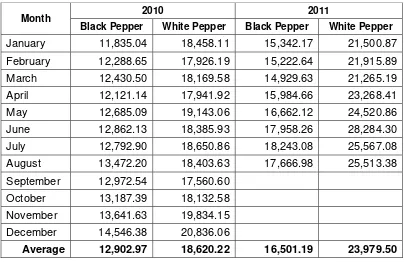
6.1 Monthly Average FOB Prices for Black and White Pepper in 2010 and 2011 (RM/tonne)
Table 8: Monthly Average FOB Prices in 2010 & 2011
Month 2010 2011
Black Pepper White Pepper Black Pepper White Pepper
January 11,835.04 18,458.11 15,342.17 21,500.87 February 12,288.65 17,926.19 15,222.64 21,915.89 March 12,430.50 18,169.58 14,929.63 21,265.19 April 12,121.14 17,941.92 15,984.66 23,268.41 May 12,685.09 19,143.06 16,662.12 24,520.86 June 12,862.13 18,385.93 17,958.26 28,284.30 July 12,792.90 18,650.86 18,243.08 25,567.08 August 13,472.20 18,403.63 17,666.98 25,513.38 September 12,972.54 17,560.60
October 13,187.39 18,132.58 November 13,641.63 19,834.15 December 14,546.38 20,836.06
7. Development Programmes for Pepper
The on-going development programmes for the Malaysian pepper industry are aimed at addressing issues on:
7.1 Production and Productivity.
Programmes to improve pepper production, productivity and sustainability are:
a) New Pepper Planting Area and Maintenance Schemes
The Government continues to assist the pepper farmers through technical assistance and know how to encourage the farmers to produce higher and better quality crop.
b) Research and Development
The R&D activities continue to focus on:
• production of quality planting material;
• better agronomics and cultural practices to reduce cost production;
• developing effective and efficient pest and disease control measures to reduce crop losses; and
• developing green farm technologies in an effort to improve farm level processing of pepper through the use of environment friendly implements.
7.2 Quality Improvement and Value-addition
Report of 42nd Pepper Exporters Meeting, 25th Nov. 2011
134
a) Improvement of Processing/ Cleaning Technologies and Test Methodologies
In an effort to upgrade the quality of pepper from the farm to export level, continue effort are being taken to improve pepper processing/cleaning technologies and QC test methods.
b) Product Development
Activities are aimed on developing the small-and-medium enterprises to manufacture and market value-added pepper products. The activities are in line with the Government effort to increase domestic pepper consumption. Currently the focus of product development are mainly on seasonings, sauces, marinades, pepper-flavoured products and non-food products
c) Promoting Domestic Consumption
Domestic promotional efforts through organizing promotion activities with hotel and also participates in trade promotions and exhibitions. In 2011, MPB actively participated in 30 local exhibitions.
8. Conclusion
The Malaysian pepper industry in the year 2011 is impacted by:
(a) Rising cost of production (b) Global economic
(c) Weather patterns