Electronic copy available at: http://ssrn.com/abstract=513663
International Convergence of Accounting
Practices: Choosing between IAS and US GAAP
Ann Tarca
UWA Business School, University of Western Australia, 35 Stirling Hwy, Crawley, Western Australia 6009
Email: [email protected]
Abstract
This study examines reporting practices of a sample of foreign listed and domestic-only listed companies from the United Kingdom, France, Germany, Japan and Australia to determine the extent to which companies voluntarily use ‘‘international’’ standards. Two types of use of non-national standards in the consolidated accounts presented to the public are considered: adoption of ‘‘international’’ standards instead of national standards, and supplementary use where ‘‘international’’ standards are used in conjunction with national standards. ‘‘International’’ standards are defined as US GAAP or IAS (now IFRS). The study tests for a preference for either set of standards and considers the relationship of choice of regime with firm attributes.
The results show significant voluntary use of ‘‘international’’ standards in all five countries and among foreign listed and domestic-only listed companies. Companies using ‘‘international’’ standards are likely to be larger, have more foreign revenue and to be listed on one or more foreign stock exchanges. US GAAP is the predominant choice, but IAS are used by many firms in Germany and some in Japan. Firms listed in the United States’ regulated markets (NYSE and NASDAQ) are more likely to choose US GAAP, but companies traded in the OTC market often select IAS.
The study demonstrates for managers and regulators that there is considerable support for ‘‘international’’ standards, and that choice of IAS or US GAAP relates to specific firm characteristics which differ according to a firm’s country of origin. Most use of ‘‘international’’ standards reflects individual countries’ institutional frameworks, confirm-ing the key role of national regulators and standard setters in assistconfirm-ing companies to achieve more comparable international reporting.
1. Introduction
This study examines the extent to which companies from five countries use ‘‘international’’ standards, considering both adoption of ‘‘international’’ standards instead of national standards, and where ‘‘international’’
The helpful comments of Garry Biddle, Steven Cahan, Sid Gray, Jill McKinnon, Richard Morris, Chris Nobes and an anonymous referee are gratefully acknowledged, as is the contribution of seminar participants at the AAANZ 2001 PhD Colloquium, AAA International Group mid-year meeting 2002, University of Aberdeen, University of Glasgow, Macquarie University, Monash University, University of New South Wales, University of Technology Sydney and the University of Western Australia. The author thanks her PhD supervisors Professor Philip Brown and Associate Professor David Woodliff for their encouragement and the AAANZ and AAA International Group for their generous provision of PhD scholarship funds.
Electronic copy available at: http://ssrn.com/abstract=513663
standards are used in conjunction with national standards. Companies’ stock exchange listings are noted, so that voluntary and mandatory use of ‘‘international’’ standards is addressed. ‘‘International’’ standards are defined as US GAAP, the generally accepted accounting practices of the United States of America (US), or IAS (International Accounting Standards, now described as IFRS) developed by the IASC.1Attributes of companies that choose US GAAP or IAS are also examined.
As global business activities have increased, the comparability of financial information between firms from different countries has become an important issue. Standard setters and regulators from many countries have become involved in initiatives to harmonize reporting requirements, such as the development of global standards and regulations through the IASC (and subsequently the IASB) and the International Organization of Securities Commissions (IOSCO). These activities suggest that at least some firms seek uniform requirements, to assist them in producing more comparable financial statements. One way to improve comparability and transparency in financial reporting is to use ‘‘international’’ accounting standards. However the motivation for firms to use ‘‘international’’ standards, and the extent to which they are able to do so, will reflect the institutional framework in each country. These issues are investigated in this research.
The study makes both a theoretical and practical contribution. It builds on the strand of research that has identified differences between countries in the nature of their accounting systems, and in accounting standards and practices (see Saudagaran and Meek, 1997). The study demonstrates how different national environments impact on the use of ‘‘international’’ standards. The national accounting framework may itself provide an incentive to use ‘‘international’’ standards, and national regulations can assist or impede companies’ efforts to produce more comparable financial statements.
Adoption of IAS will be facilitated, and compliance with spirit of IAS more likely, where companies have indicated that they want to use IAS.
The study also explores how stock exchange requirements influence the use of ‘‘international’’ standards, and the choice of US GAAP or IAS. Although IAS have been endorsed by IOSCO for cross-border listings, individual exchanges can require additional disclosures such as the US Securities and Exchange Commission’s (SEC) Form 20F (IOSCO, 2000). The findings may provide further input to the debate about the use of IAS without reconciliation to US GAAP in US markets (Dye and Sunder, 2001).
The remainder of the paper is organized as follows. Section two describes how countries’ institutional frameworks could impact on use of ‘‘international’’ standards, and section three considers other factors that influence financial reporting and therefore may affect use of ‘‘interna-tional’’ standards. Section four formalizes the hypotheses and section five describes sample selection and data collection. Results are presented in section six and conclusions drawn in the final section.
2. The Institutional Framework and Use of ‘‘International’’ Standards
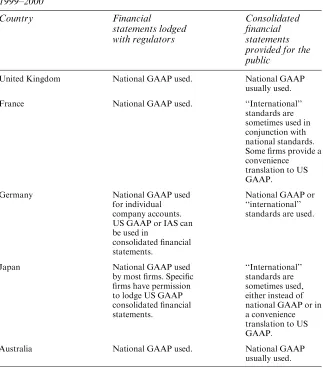
A company’s decision to use ‘‘international’’ accounting standards will be affected by the institutional framework (the body of accounting law, rules and accepted practices as well as the institutions that formulate, administer and enforce these requirements) of its home country. Since institutional frameworks vary between countries, a company’s country of origin will impact on its use of ‘‘international’’ standards. In theory and subject to meeting minimum legal requirements, a company could prepare financial statements for the public based on any accounting standards it chooses. However, in practice cost considerations mean that a company’s choice of standards reflects the requirements of the institutional framework of its home country. Five countries (the United Kingdom (UK), France, Germany, Japan and Australia) are included in this study as they illustrate a range of positions in relation to the use of ‘‘international’’ standards, as shown in Table 1.
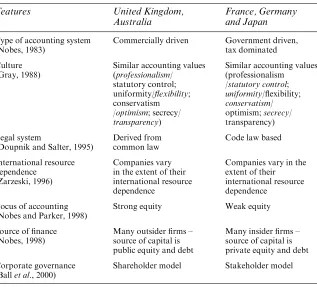
explain these differences (Mueller, 1967; Nobes, 1983; Gray, 1988; Doupnik and Salter, 1995; Zarzeski, 1996; Nobes and Parker, 1998; Nobes, 1998). Table 2 lists selected factors in relation to the five countries included in this study. It shows areas of similarity and difference that impact on financial reporting and may influence companies’ motivation to use ‘‘international’’ standards. For example, the investor focus of financial reporting that already exists for firms in the common law countries (the UK and Australia) could mean that they have relatively less incentive to use ‘‘international’’ standards than firms in the code law countries (France,
Table 1. Use of National and ‘‘International’’ Standards in Five Countries 1999–2000
United Kingdom National GAAP used. National GAAP usually used. France National GAAP used. ‘‘International’’
standards are
Australia National GAAP used. National GAAP
Germany and Japan) where accounting has traditionally served the needs of creditors and tax authorities.2
Stock exchange requirements form part of the institutional framework. They could affect use of ‘‘international’’ standards because they include rules stipulating which accounting standards listed firms can adopt. The stock exchanges in London, Paris, Frankfurt, Tokyo and Australia accept financial statements prepared according to domestic GAAP and other selected GAAP, including US GAAP. The London, Paris, Frankfurt and Australian exchanges also accept accounts prepared according to IAS. The stock exchanges of the countries included in this study may require foreign listed firms to provide additional information but they do not require reconciliation to the stock exchange’s national GAAP as mandated by the SEC (IASB, 2002c).
Stock exchange requirements have been shown to impact on a company’s choice of foreign exchange (Saudagaran and Biddle, 1992,
1995; Cheung and Lee, 1995) and level of disclosure. Botosan and Frost (1998) found that companies traded on the OTC Bulletin Board made significantly less disclosures than companies listed on NYSE and NASDAQ, and did not make voluntary disclosures to match the mandatory 20F disclosures required of listed firms. There has been considerable debate about the impact of stock exchange regulations on foreign companies considering listing in the US (see Zeff, 1998), with the SEC’s US GAAP accounting requirements identified as an impediment to US listing. Choi and Levich (1990) found that many foreign firms did not list in the US but instead raised debt and equity capital in a variety of ways that did not involve meeting US GAAP accounting requirements.
Considering the institutional framework in each country, predictions can be made about companies’ use of ‘‘international’’ standards and choice of US GAAP or IAS. In Germany, legal provisions allow firms that want to produce financial reports with greater international comparability and usefulness for investors to adopt ‘‘international’’ standards. French firms may be similarly motivated to use international standards, but companies do not have the legislative support that exists in Germany. French law allowing use of IAS in consolidated reporting had been written but not approved for use at the time of the study (IASB, 2002b). Thus greater use of ‘‘international’’ standards is expected in Germany than in France. Firms from both Germany and France are expected to choose IAS rather than US GAAP because IAS are politically neutral (Zeff, 1998). A survey by KPMG (2000) supports this conjecture: it found that 34 out of 122 European companies were contemplating changing from non-national standards during the next three to five years, and that 56% planned to adopt IAS while 29% were considering US GAAP. Japanese accounting has been significantly influenced by US accounting practices (McKinnon, 1986). Since the 1970s several Japanese firms have prepared consolidated accounts according to US GAAP (Radebaugh and Gray, 1997, p. 65), so some use of US GAAP is expected among the Japanese firms. However, Japanese standard setters refer to IAS in setting standards (Deloitte Touche Tohmatsu, 2002) and have announced a greater role for IAS in their processes (Ravlic, 1999) so firms may also use IAS.
3. Other Factors Affecting Use of ‘‘International’’ Standards
Studies have identified several influences on the production of financial information in addition to a country’s institutional framework. For example, competitive market forces and managerial incentives have been shown to affect the form and content of financial statements. These factors could affect the use of ‘‘international’’ standards.
It has been suggested that firms are motivated to produce financial reports because of the operation of competitive market forces (see Healy and Palepu, 2001). Information asymmetry between buyers and sellers in the capital market means that there is the possibility of being perceived as a ‘‘lemon’’ (Ackerlof, 1970) so sellers make disclosures to distinguish their product from the ‘‘lemons’’. Firms supply information so capital can be raised on more favorable terms. Choi (1973) demonstrated that increased firm disclosure reduced investors’ uncertainty about the firm resulting in a lower cost of capital for the firm. Botosan (1997) found that for firms with a low analyst following, greater disclosure was associated with a lower cost of capital.
Competitive market forces could promote the use of ‘‘international’’ standards where firms consider that an international regime will enable better communication with information users. KPMG (2000) reported that European company executives provided many reasons for changing from national standards to IAS or US GAAP including: the possibility of increasing the availability of capital and lowering its cost; quality of the standards; and preferences of institutional investors and analysts. Leuz and Verrecchia (2001) examined German firms that changed from national to ‘‘international’’ standards and found that cost of capital proxies (bid-ask spread and trading volume) indicated that the use of IAS and US GAAP reduced the cost of capital.
provided more standardized information and were more likely to file Form 20F information than firms that used national standards. Firms were more likely to disclose IAS information when they participated in seasoned equity offerings, and when US GAAP required more disclosure or restricted accounting measurement methods relative to domestic-GAAP. Production of financial reports, and therefore use of ‘‘international’’ standards, could be influenced by managerial incentives. Managers’ disclosure of financial information has been investigated using agency theory (Jensen and Meckling, 1976), which posits that disclosure is used to reduce information asymmetry that exists between agents (being managers and therefore insiders) and principals (who are outside the firm and are less informed) about future prospects of the firm and managers’ consumption of perquisites. Since use of ‘‘international’’ standards may mean that a firm makes more disclosure, agency theory can be used to predict the relationship of firm attributes and use of ‘‘international’’ standards. Level of foreign revenue has been linked with disclosure of financial information (Meek et al., 1995; Zarzeski, 1996), and with Swiss firms’ use of IAS (Dumontier and Raffournier, 1998). Foreign listing was associated with more disclosure in many studies (Singhvi and Desai, 1971; Buzby, 1975; Cooke, 1989, 1991; Firth, 1979; Maloneet al., 1993; Hossain and Adams, 1995; Mitchellet al., 1995; Meeket al., 1995).
Other firm attributes considered in the present study are size, leverage and industry. Size is often related to more disclosure (see above studies). Larger companies are more likely to be more international and therefore to make greater use of ‘‘international’’ standards. Leverage is used in this study as a proxy to capture the firm’s dependence on equity capital. Firms with higher leverage are relatively less dependent on equity capital, and are therefore less likely to be subject to shareholders’ demands for information and to use disclosure to reduce information asymmetry with shareholders. Some studies find that disclosure practices vary between industries (McNallyet al., 1982; Cooke, 1991; McKinnon and Dalimunthe, 1993; Mitchellet al., 1995; Meeket al., 1995). Therefore industry classification is considered in this study.
4. Use of ‘‘International’’ Standards and Choice of US GAAP or IAS
boundaries. International firms may want to communicate financial information to interested parties, and may select ‘‘international’’ standards to increase transparency in reporting and reduce restatement of financial information. There are two sets of accounting standards that could have the title of ‘‘international’’, namely IAS and US GAAP. The IASC has issued the only comprehensive set of ‘‘international’’ standards, so for companies seeking ‘‘international’’ standards IAS are an obvious choice. However, because of SEC listing requirements US GAAP are also used by foreign listed firms. Therefore, in a multi-country sample of companies with a range of foreign listings, the ‘‘international’’ standards selected may be either IAS or US GAAP.
Hypotheses to test the relationship between use of ‘‘international’’ standards and choice of US GAAP or IAS and a firm’s level of internationality can be stated formally (in alternate form) as:
H1: Companies with a greater proportion of foreign revenue are more likely to use ‘‘international’’ standards.
H2: Companies with a foreign stock exchange listing are more likely to use ‘‘international’’ standards.
These hypotheses are investigated for the whole sample, and for individual countries. Countries are considered separately to recognize the influence of their institutional frameworks. This approach provides an opportunity to extend Ashbaugh’s (2001) conclusion that foreign listed firms are more likely to use ‘‘international’’ standards by showing how each country’s institutional framework impacts on their use. The study builds on Ashbaugh’s (2001) findings in relation to foreign firms listed on the London Stock Exchange by examining use of ‘‘international’’ standards by firms listed on several major stock exchanges. In addition firms that adopt ‘‘international’’ standards and those that make supplementary use of them are analyzed separately, which has not been done previously.
Four categories of foreign stock exchange listing are considered because of the possible effect of stock exchange requirements on financial reporting. The categories are:
NYSE: Listed on the NYSE or NASDAQ and subject to US GAAP accounting requirements (US GAAP financial statements or reconciliation to US GAAP prepared).
NON-US: Listed on a non-US foreign stock exchange. DOM: Listed only on one or more domestic stock exchanges.
Ashbaugh (2001) found that 62% of her sample firms that were required to file Form 20F provided US GAAP information in their annual report while 18% gave IAS information. Consistent with these findings it is expected that foreign listed companies subject to US GAAP accounting requirements are more likely to use US GAAP than IAS. When a NYSE foreign listed company adopts US GAAP, it avoids the cost of restating financial information. A NYSE foreign listed company that makes supplementary use of ‘‘international’’ standards is predicted to use US GAAP because of SEC requirements. Foreign companies traded in the US OTC market or on NASDAQ (and not subject to US GAAP reporting requirements) that use ‘‘international’’ standards are expected to use US GAAP to achieve comparability with other companies in the US market. However, these companies are not subject to the SEC’s US GAAP accounting requirements so their incentives to use US GAAP are not as strong as for NYSE foreign listed firms. Companies with non-US foreign listings are not traded in the US and therefore US GAAP accounting requirements do not apply to them. In fact, they may have chosen a non-US foreign listing to avoid non-US GAAP reconciliation (Choi and Levich, 1990). If that is the case, then selection of US GAAP is not expected. US GAAP are considered the most onerous reporting standards (Saudagaran, 2001, p. 18), providing another reason for the choice of IAS. Ashbaugh (2001) suggested that firms use IAS to benefit from providing more standardized information without incurring the cost of implementing US GAAP.
Hypotheses to test the impact of stock exchange listing on choice of ‘‘international’’ standards by companies domiciled outside the US can be formally stated (in alternate form) as:
H3: Foreign companies listed or traded in the US are more likely than domestic-only listed companies to use US GAAP.
H4: Companies with non-US foreign stock exchange listings are more likely than domestic-only listed companies to use IAS.
5. Sample Design and Data Collection
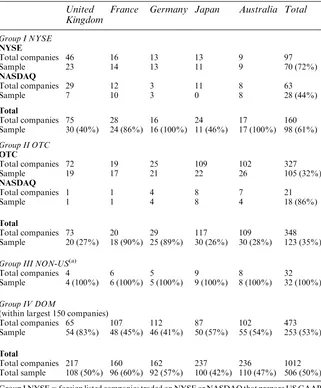
the use of IAS and US GAAP. An English language annual report for the 1999–2000 financial year was requested from the largest 150 companies (by market capitalization) in each country based on the Datastream (2000) database. The use of English language reports means that the companies in the study are more international. It is not a bias since the study aims to include international companies. Companies not included in the largest 150 but named on foreign company lists obtained from stock exchanges in the five countries were also contacted. In most foreign listing categories, all the annual reports received were included. Where more than 30 reports were received (for the NYSE group in the UK, and for the OTC group in the UK, Japan and Australia) a random selection of reports was made. For domestic-only listed companies, a random selection (by country) was made from the reports received so that the number of domestic-only listed companies was the same as the number of foreign listed companies for each country. The total number of companies in each country’s sample varies because each country has a different number of foreign listed companies. Table 3 shows the number of sample companies as a proportion of the number of listed companies for each country and stock exchange listing category.
Each company’s use of accounting standards was recorded as national or ‘‘international’’ according to information in its consolidated financial statements provided to the public. Users of ‘‘international’’ standards were classified as adopters or supplementary users. Adopters were firms that stated in their accounting policy note or audit report that they used US GAAP or IAS instead of national GAAP. (No assessment was made as to whether they followed all applicable standards of their nominated regime.) Supplementary use was determined by examining each policy disclosed in the statement of accounting policies and in the notes to the accounts to determine if any US GAAP or IAS had been followed. Firms classified as supplementary users could follow one or several ‘‘international’’ standards within their consolidated financial statements prepared according to national GAAP. Companies that provided a reconciliation statement to ‘‘international’’ standards were classified as supplementary users. Firms that presented a second set of financial statements according to ‘‘international’’ standards, that appeared after the primary consolidated financial statements, were also identified as supplementary users. For all users of ‘‘international’’ standards, and then for adopters and supplemen-tary users, the choice of IAS or US GAAP was recorded.
Table 3. Sample Companies, by Country and Stock Exchange Listing United
Kingdom
France Germany Japan Australia Total
Group I NYSE
NYSE
Total companies 46 16 13 13 9 97
Sample 23 14 13 11 9 70 (72%)
NASDAQ
Total companies 29 12 3 11 8 63
Sample 7 10 3 0 8 28 (44%)
Total
Total companies 75 28 16 24 17 160
Sample 30 (40%) 24 (86%) 16 (100%) 11 (46%) 17 (100%) 98 (61%)
Group II OTC
OTC
Total companies 72 19 25 109 102 327
Sample 19 17 21 22 26 105 (32%)
NASDAQ
Total companies 1 1 4 8 7 21
Sample 1 1 4 8 4 18 (86%)
Total
Total companies 73 20 29 117 109 348
Sample 20 (27%) 18 (90%) 25 (89%) 30 (26%) 30 (28%) 123 (35%)
Group III NON-US(a)
Total companies 4 6 5 9 8 32
Sample 4 (100%) 6 (100%) 5 (100%) 9 (100%) 8 (100%) 32 (100%)
Group IV DOM
(within largest 150 companies)
Total companies 65 107 112 87 102 473
Sample 54 (83%) 48 (45%) 46 (41%) 50 (57%) 55 (54%) 253 (53%)
Total
Total companies 217 160 162 237 236 1012
Total sample 108 (50%) 96 (60%) 92 (57%) 100 (42%) 110 (47%) 506 (50%)
Group I NYSE5foreign listed companies traded on NYSE or NASDAQ that prepare US GAAP accounts or file a Form 20F reconciliation. Group II OTC5foreign listed companies traded on NASDAQ or the OTC market that do not prepare US GAAP accounts or file a Form 20F reconciliation. Group III NON-US5foreign listed companies traded on a non-US stock exchange. Group IV DOM5domestic-only listed companies traded on one or more domestic stock exchanges.
Total companies5number of companies in each stock exchange group, based on foreign company lists from stock exchanges in London, Paris, Frankfurt, Tokyo and Australia and from the Bank of New York and JP Morgan.
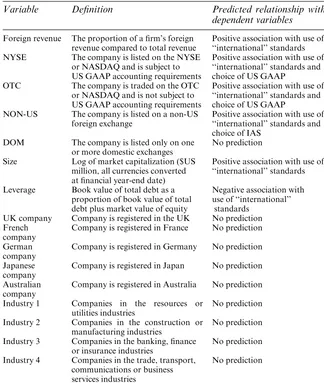
attributes. The regression models are nested, as shown in Figure 1. Table 4 lists the independent variables, namely proportion of foreign revenue, size, leverage and dummy variables for stock exchange listing, country and industry group. Regression equations include three dummy variables for stock exchange listing, four for country and three for industry group. The results for the omitted dummy variables are captured in the constant term in the regressions. Predictions of the relationships between the dependent and independent variables are provided in Table 4.
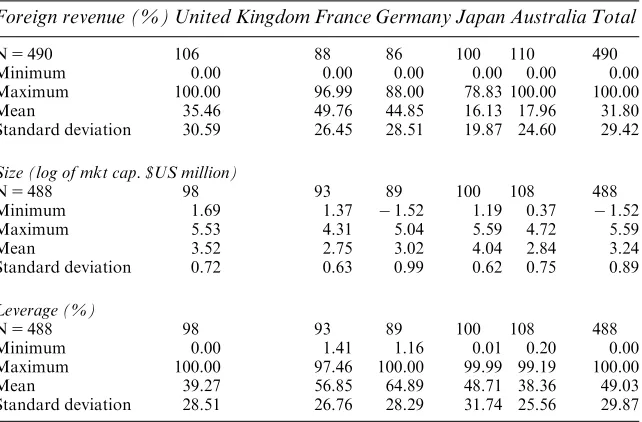
Descriptive statistics for the continuous variables are shown in Table 5. The proportion of foreign revenue ranges from 0 to 100% for the whole sample and the mean foreign revenue is 31.80%. It is highest in France (49.76%) and Germany (44.85%), moderate in the UK (35.46%) and low in Japan (16.13%) and Australia (17.96%). Japanese firms are the largest in the sample (log of market capitalization, mean 4.04) followed by companies from the UK (3.52), Germany (3.02), Australia (2.84) and France (2.75). Mean leverage (total debt as a proportion of total debt plus market value of equity) ranges from 0 to 100%. The figure of 100% for leverage implies that the firm has negligible equity, and occurs because the market value of the firm is very low compared to the book value of debt. The low market value firms include technology companies that experi-enced large share price falls following the collapse of the technology stock boom in March 2000. German firms have the highest mean leverage
Regression 1
Regression 2
Regression 3
Regression 4
Regression 5
Choice of standards
Use national standards
Use “international” standards
Adopt Supplementary use
IAS US GAAP
US GAAP IAS US GAAP IAS
(64.89%) followed by France (56.85%), Japan (48.71%), the UK (39.27%) and Australia (38.36%).
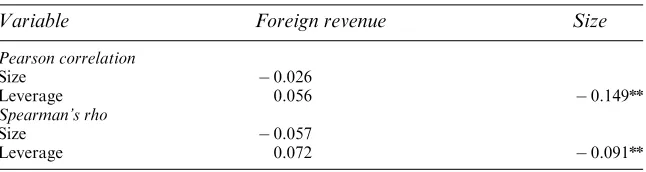
Parametric and non-parametric correlation tests reported in Table 6 show that foreign revenue is not significantly correlated with size or leverage. There is a small but significant correlation between size and leverage, which is not sufficient to impair the results. The negative correlation between size and leverage indicates that larger firms are less
Table 4. Definitions of the Independent Variables and Expected Relationships with the Dependent Variables
Variable Definition Predicted relationship with dependent variables Foreign revenue The proportion of a firm’s foreign
revenue compared to total revenue
Positive association with use of ‘‘international’’ standards NYSE The company is listed on the NYSE
or NASDAQ and is subject to US GAAP accounting requirements
Positive association with use of ‘‘international’’ standards and choice of US GAAP
OTC The company is traded on the OTC or NASDAQ and is not subject to US GAAP accounting requirements
Positive association with use of ‘‘international’’ standards and choice of US GAAP
NON-US The company is listed on a non-US foreign exchange
Positive association with use of ‘‘international’’ standards and choice of IAS
DOM The company is listed only on one or more domestic exchanges
No prediction Size Log of market capitalization ($US
million, all currencies converted at financial year-end date)
Positive association with use of ‘‘international’’ standards Leverage Book value of total debt as a
proportion of book value of total debt plus market value of equity
Negative association with use of ‘‘international’’
standards UK company Company is registered in the UK No prediction French
company
Company is registered in France No prediction German
company
Company is registered in Germany No prediction Japanese
company
Company is registered in Japan No prediction Australian
company
Company is registered in Australia No prediction Industry 1 Companies in the resources or
utilities industries
No prediction Industry 2 Companies in the construction or
manufacturing industries
No prediction Industry 3 Companies in the banking, finance
or insurance industries
No prediction Industry 4 Companies in the trade, transport,
communications or business services industries
highly geared. This could reflect smaller firms that are more likely to be growth firms, and make greater use of leverage to facilitate their growth. The negative correlation also reflects the use of market capitalization as the size measure and in the denominator of the leverage measure.
6. Empirical Results
Use of ‘‘International’’ Standards
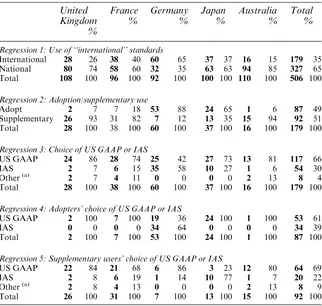
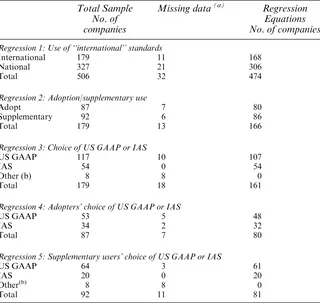
The study finds that ‘‘international’’ standards are used by 35% of companies, including firms from all five countries and each category of stock exchange listing (Tables 7 and 8, Regression 1. Table 9 reconciles the number of companies included in Tables 7 and 8 and the number of companies in each regression equation in Tables 10–13). ‘‘International’’ standards are used by larger firms with foreign stock exchange listings and more foreign revenue (Size, NYSE, OTC, NON-US and Foreign revenue are positive and significant,po0.05, Table 10).3Hypotheses H1 and H2 are supported. The model is significant overall (w25213.57,po0.001) with R250.499 and classification accuracy of 80.0% (Table 10).
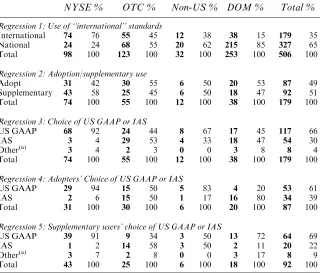
Mandatory reconciliation requirements promote the use of ‘‘interna-tional’’ standards. Table 8 shows that 76% of NYSE firms use
Table 5. Descriptive Statistics for the Continuous Variables
Foreign revenue (%) United Kingdom France Germany Japan Australia Total
N5490 106 88 86 100 110 490
Minimum 0.00 0.00 0.00 0.00 0.00 0.00
Maximum 100.00 96.99 88.00 78.83 100.00 100.00
Mean 35.46 49.76 44.85 16.13 17.96 31.80
Standard deviation 30.59 26.45 28.51 19.87 24.60 29.42
Size (log of mkt cap. $US million)
N5488 98 93 89 100 108 488
Minimum 1.69 1.37 1.52 1.19 0.37 1.52
Maximum 5.53 4.31 5.04 5.59 4.72 5.59
Mean 3.52 2.75 3.02 4.04 2.84 3.24
Standard deviation 0.72 0.63 0.99 0.62 0.75 0.89
Leverage (%)
N5488 98 93 89 100 108 488
Minimum 0.00 1.41 1.16 0.01 0.20 0.00
Maximum 100.00 97.46 100.00 99.99 99.19 100.00
Mean 39.27 56.85 64.89 48.71 38.36 49.03
‘‘international’’ standards. There is voluntary use of ‘‘international’’ standards by 45% of OTC firms, 38% of non-US foreign listed firms and 15% of domestic-only listed firms (Table 8). The findings demonstrate considerable support for ‘‘international’’ standards and indicate that for some firms the benefits of their use outweigh the costs. As expected, there is greater use of ‘‘international’’ standards in Germany, France and Japan than in the UK and Australia (Table 7, Regression 1). There is little use of ‘‘international’’ standards that is inconsistent with each company’s institutional framework. Regulatory initiatives, such as the legal changes in Germany allowing the use of ‘‘international’’ standards, are key factors enabling companies to pursue their harmonization objectives. There is greater use of ‘‘international’’ standards in Germany than France, presumably reflecting different legal requirements relating to their use. Firms in Germany using ‘‘international’’ standards are more likely to be foreign listed (NYSE, OTC), have lower leverage and to be from the manufacturing, construction, or banking, finance and insurance industry groups. In Japan, larger firms and those with foreign listings (NYSE, OTC and NON-US) are more likely to use ‘‘international’’ standards. Firms from the UK that use ‘‘international’’ standards are more likely to be foreign listed (NYSE) and have more foreign revenue and lower leverage. Among French and Australian firms, the only explanatory variable for use of ‘‘international’’ standards is foreign listing (NYSE and OTC) (Table 10).4
Adoption or Supplementary Use of ‘‘International’’ Standards
Table 7 (Regression 2) shows that among firms that use ‘‘international’’ standards, 49% adopt and 51% make supplementary use of them.
Table 6. Correlation Coefficients for the Continuous Variables
Variable Foreign revenue Size
Pearson correlation
Size 0.026
Leverage 0.056 0.149nn
Spearman’s rho
Size 0.057
Leverage 0.072 0.091nn
nnSignificant atpo0.05 two tailed test.
Foreign revenue5Proportion of foreign revenue. Size5Log of market capitalization.
Adoption of ‘‘international’’ standards is positively associated with foreign revenue and NYSE listing, and supplementary use is associated with larger size and being a firm from Industry 1 (mining and utilities) group. Foreign revenue and NYSE are positive and significant; while Size and Industry 1 are negative and significant (po0.05, Table 11).5 SEC requirements appear to promote the adoption (as distinct from supple-mentary use) of ‘‘international’’ standards. The model is significant (w25135.664, po0.001) with R250.745 and classification accuracy of 86.7% (Table 11).
Table 7. Frequency of Use and Choice of ‘‘International’’ Standards by Country United
Regression 1: Use of ‘‘international’’ standards
International 28 26 38 40 60 65 37 37 16 15 179 35
National 80 74 58 60 32 35 63 63 94 85 327 65
Total 108 100 96 100 92 100 100 100 110 100 506 100
Regression 2: Adoption/supplementary use
Adopt 2 7 7 18 53 88 24 65 1 6 87 49
Supplementary 26 93 31 82 7 12 13 35 15 94 92 51 Total 28 100 38 100 60 100 37 100 16 100 179 100
Regression 3: Choice of US GAAP or IAS
US GAAP 24 86 28 74 25 42 27 73 13 81 117 66
IAS 2 7 6 15 35 58 10 27 1 6 54 30
Other(a) 2 7 4 11 0 0 0 0 2 13 8 4
Total 28 100 38 100 60 100 37 100 16 100 179 100
Regression 4: Adopters’ choice of US GAAP or IAS
US GAAP 2 100 7 100 19 36 24 100 1 100 53 61
IAS 0 0 0 0 34 64 0 0 0 0 34 39
Total 2 100 7 100 53 100 24 100 1 100 87 100
Regression 5: Supplementary users’ choice of US GAAP or IAS
US GAAP 22 84 21 68 6 86 3 23 12 80 64 69
IAS 2 8 6 19 1 14 10 77 1 7 20 22
Other(a) 2 8 4 13 0 0 0 0 2 13 8 9
Total 26 100 31 100 7 100 13 100 15 100 92 100
Use of ‘‘international’’ standards5adoption and supplementary use. Adoption5use of ‘‘international’’ standards instead of national standards in financial statements provided to the public. Supplementary use5national standards and some ‘‘international’’ standards used in financial statements provided to the public.
(a)Other
The pattern of adoption and supplementary use in each country reflects the institutional requirements governing financial reporting. Companies from Germany and Japan are most likely to adopt ‘‘international’’ standards (German company and Japanese company are significant variables, po0.05, Table 11).6 In Germany, most firms that use ‘‘international’’ standards adopt rather than make supplementary use of
Table 8. Frequency of Use and Choice of ‘‘International’’ Standards by Stock Exchange Listing
NYSE % OTC % Non-US % DOM % Total %
Regression 1: Use of ‘‘international’’ standards
International 74 76 55 45 12 38 38 15 179 35
National 24 24 68 55 20 62 215 85 327 65
Total 98 100 123 100 32 100 253 100 506 100
Regression 2: Adoption/supplementary use
Adopt 31 42 30 55 6 50 20 53 87 49
Supplementary 43 58 25 45 6 50 18 47 92 51
Total 74 100 55 100 12 100 38 100 179 100
Regression 3: Choice of US GAAP or IAS
US GAAP 68 92 24 44 8 67 17 45 117 66
IAS 3 4 29 53 4 33 18 47 54 30
Other(a) 3 4 2 3 0 0 3 8 8 4
Total 74 100 55 100 12 100 38 100 179 100
Regression 4: Adopters’ Choice of US GAAP or IAS
US GAAP 29 94 15 50 5 83 4 20 53 61
IAS 2 6 15 50 1 17 16 80 34 39
Total 31 100 30 100 6 100 20 100 87 100
Regression 5: Supplementary users’ choice of US GAAP or IAS
US GAAP 39 91 9 34 3 50 13 72 64 69
IAS 1 2 14 58 3 50 2 11 20 22
Other(a) 3 7 2 8 0 0 3 17 8 9
Total 43 100 25 100 6 100 18 100 92 100
Group I NYSE5foreign listed companies traded on NYSE or NASDAQ that prepare US GAAP accounts or file a Form 20F reconciliation. Group II OTC5foreign listed companies traded on NASDAQ or the OTC market that do not prepare US GAAP accounts or file a Form 20F reconciliation. Group III NON-US5foreign listed companies traded on a non-US stock exchange. Group IV DOM5domestic-only listed companies traded on one or more domestic stock exchanges.
Use of ‘‘international’’ standards5adoption and supplementary use. Adoption5use of ‘‘international’’ standards instead of national standards in financial statements provided to the public. Supplementary use5national standards and some ‘‘international’’ standards used in financial statements provided to the public.
(a)Other
them (88% compared to 12%, Table 7, Regression 2). The country regression for Germany provides no explanatory variables for adoption of ‘‘international’’ standards but it shows that firms that do not adopt but instead make supplementary use tend to be larger firms and from Industry 1 (Size and Industry 1 are negative and significant,po0.05, Table 11). For Japanese firms, adoption is associated with more foreign revenue (Foreign revenue is positive and significant,po0.10, Table 11). The majority of French firms using ‘‘international’’ standards make supplementary use of them (82%, Table 7, Regression 2) by following French GAAP and some
Table 9. Number of Companies in Frequency Tables and Regression Equations Total Sample
No. of companies
Missing data(a) Regression Equations No. of companies
Regression 1: Use of ‘‘international’’ standards
International 179 11 168
National 327 21 306
Total 506 32 474
Regression 2: Adoption/supplementary use
Adopt 87 7 80
Supplementary 92 6 86
Total 179 13 166
Regression 3: Choice of US GAAP or IAS
US GAAP 117 10 107
IAS 54 0 54
Other (b) 8 8 0
Total 179 18 161
Regression 4: Adopters’ choice of US GAAP or IAS
US GAAP 53 5 48
IAS 34 2 32
Total 87 7 80
Regression 5: Supplementary users’ choice of US GAAP or IAS
US GAAP 64 3 61
IAS 20 0 20
Other(b) 8 8 0
Total 92 11 81
Reconciliation of the number of companies reported in Tables 7 and 8 with the number included in Regression equations 1–5, Tables 10–13.
(a)
Companies are omitted from regressions because of missing data (market value, or proportion of foreign revenue).
Ann
Tarca
Independent variables
Full Sample United Kingdom France Germany Japan Australia
(expected sign) Coeffic.Wald Coeffic. Wald Coeffic.Wald Coeffic.Wald Coeffic. Wald Coeffic.Wald
Foreign revenue % (1) 0.010 3.564++ 0.026 4.312++ 0.090 0.574 0.018 1.510 0.001 0.005 0.007 0.251 NYSE foreign listed (1) 3.570 84.400++ 4.512 21.840++ 2.361 11.201++ 3.165 6.580++ 4.889 12.246++ 3.802 13.909++ OTC foreign listed (1) 1.689 27.412++ 0.914 0.598 1.352 3.130++ 2.715 8.396++ 3.410 14.688++ 1.602 2.536+
Non-US foreign listed (1) 1.380 8.297++ 6.140 0.035 1.074 1.140 0.458 0.113 4.764 15.191++ 6.406 0.36
Size (log of mkt cap.) (1) 0.339 4.169++ 0.296 0.398 0.425 0.846 0.201 0.296 1.601 5.785++ 0.514 1.535 Leverage (debt/debt
1mkt cap.) ( )
0.000 0.001 0.021 1.936+ 0.014 1.358 0.053 6.859++ 0.029 3.586(a) 0.029 2.883(a)
UK company 0.027 0.003 NA NA NA NA NA
French company 1.372 8.644nn NA NA NA NA NA
German company 2.933 38.392nn
NA NA NA NA NA
Japanese company 1.420 9.070nn
NA NA NA NA NA
Industry 1 0.775 2.464 0.434 0.143 0.404 0.135 2.351 2.096 6.636 0.032 1.893 2.550 Industry 2 0.049 0.026 1.555 2.549 0.150 0.057 2.062 4.735nn
0.592 0.561 1.073 1.130 Industry 3 0.206 0.204 2.328 1.962 1.915 2.516 5.014 8.960nn 1.391 1.519 0.631 0.181
Constant 4.550 45.214nn
2.334 1.396 3.575 4.153nn
0.041 0.001 11.016 10.668nn
5.563 12.012nn
Nagelkerke R2 0.499 0.650 0.284 0.509 0.680 0.497
% Correctly predicted (based on 50% cut-off)
80.0 88.5 70.9 77.4 86.0 90.7
Model chi-square 213.570 56.247 20.224 38.380 68.875 35.836
Modelp5 0.000 0.000 0.017 0.000 0.000 0.000
Number of companies 474 96 86 84 100 108
15use ‘‘international’’ 168 25 34 56 37 16
05use national 306 71 52 28 63 92
++Significant atp
o0.05 one-tailed test. +
Significant atpo0.10 one-tailed test.
nnSignificant atp
o0.05 two-tailed test.
NA5not applicable. Coeffic.5coefficient in the regression equation. Wald5the Wald statistic is the square of the ratio of the coefficient to its standard error.
(a)Coefficient is significant but has the opposite sign. Industry 1
5resources and utilities; Industry 25manufacturing and construction; Industry 35banking, finance and insurance.
Blackwell
Publishing
Ltd.
US GAAP and/or IAS. In the UK and Australia, most firms make supplementary use and there are few firms that adopt (UK: 93% compared to 7%; Australia: 94% compared to 6%, Table 7, Regression 2). It would appear that requirements to lodge national GAAP accounts with regulators mean that these are the financial statements usually provided to the public.
Use of ‘‘International’’ Standards – Choice of US GAAP or IAS
The majority of companies using ‘‘international’’ standards choose US GAAP (66%, Table 7, Regression 3), while 30% choose IAS and 4%
Table 11. Regression 2 Results: Choice of Adoption or Supplementary Use by Companies that Use ‘‘International’’ Standards
Independent variables Full Sample Germany Japan (expected sign)
Coeffic. Wald Coeffic. Wald Coeffic. Wald Foreign revenue % 0.045 9.419nn 0.020 0.687 0.088 3.221n NYSE foreign listed 2.756 6.784nn
1.249 0.437 21.552 0.039 OTC foreign listed 1.071 1.441 0.717 0.207 12.612 0.016 Non-US foreign listed 0.564 0.263 7.176 0.031 11.996 0.015 Size (log of mkt cap.) 1.368 8.322nn
2.616 4.189nn
0.159 0.019 Leverage (debt/debt
1mkt cap.)
0.015 1.674 0.037 1.238 0.016 0.540
UK company 1.579 0.800 NA NA
French company 0.358 0.057 NA NA
German company 7.468 17.772nn
NA NA
Japanese company 7.182 13.851nn NA NA
Industry 1 5.175 8.777nn 5.909 4.618nn NA Industry 2 0.457 0.443 0.582 0.172 0.699 0.347 Industry 3 0.331 0.121 0.820 0.099 1.591 0.871
Constant 1.908 1.093 8.652 4.558nn
12.679 0.016
Nagelkerke R2 0.745 0.481 0.634
% correctly predicted (based on 50% cut-off)
86.7 92.9 86.5
Model chi-square 135.664 16.473 22.859
Modelp5 0.000 0.058 0.004
Number of companies 166 56 37
15adopt 80 49 24
05supplementary use 86 7 13
nnSignificant at p
o0.05 two-tailed test. nSignificant at po0.10 two-tailed test. NA5not applicable.
choose other national standards, or do not state a preference for US GAAP or IAS. The only significant explanatory factor for the use of US GAAP is NYSE listing (NYSE is positive and significant,po0.05, Table 12). The model is significant overall (w2570.546, po0.001) with R250.485 and classification accuracy of 79.8% (Table 12). H3 is supported for NYSE foreign listed firms, but not for OTC firms (OTC is not significant, Table 12). The result indicates that despite their presence in the US OTC market, some firms do not choose US GAAP as their ‘‘international’’ standards. It implies that there is a cost incurred by the use
Table 12. Regression 3 Results: Choice of US GAAP or IAS by Companies that Use ‘‘International’’ Standards
Independent variables Full sample Germany Japan (expected sign)
Coeffic. Wald Coeffic. Wald Coeffic. Wald Foreign revenue % 0.016 2.348 0.043 2.738n 0.095 3.251n NYSE foreign listed (1) 2.515 12.819++ 4.978 9.162++ 1.694 0.000 OTC foreign listed (1) 0.164 0.075 0.946 0.757 10.895 0.012 Non-US foreign listed ( ) 0.562 0.387 3.372 3.037(a) 9.882 0.010 Size (log of mkt cap.) 0.197 0.558 0.130 0.108 1.094 0.671 Leverage (debt/debt
1mkt cap.)
0.013 2.174 0.010 0.200 0.017 0.318
UK company 1.767 1.809 NA NA
French company 0.718 0.331 NA NA
German company 2.534 4.730nn
NA NA
Japanese company 1.150 0.870 NA NA
Industry 1 0.527 0.321 2.539 1.701 NA
Industry 2 0.190 0.128 0.549 0.259 1.892 1.533 Industry 3 0.477 0.353 0.701 0.133 3.839 2.750n
Constant 3.806 6.252nn
1.453 0.800 5.881 0.004
Nagelkerke R2 0.485 0.545 0.629
% correctly predicted (based on 50% cut-off)
79.8 82.1 86.5
Model chi-square 70.546 28.619 21.000
Modelp5 0.000 0.001 0.007
Number of companies 161 56 37
15US GAAP 107 21 27
05IAS 54 35 10
++
Significant atpo0.05 one-tailed test.nnSignificant atpo0.05 two-tailed test.nSignificant at
po0.10 two-tailed test.
NA5not applicable. Coeffic.5coefficient in the regression equation. Wald5the Wald statistic is the square of the ratio of the coefficient to its standard error.
(a)
Coefficient is significant but has the opposite sign.
of US GAAP, or conversely there is something about IAS that makes them preferable to US GAAP, which is more important than achieving comparability with other firms using US GAAP. H4 is not supported, as
Table 13. Regression 4 and 5 Results: Choice of US GAAP or IAS by Companies that Adopt and Make Supplementary Use of ‘‘International’’ Standards
Foreign revenue % 0.038 1.802 0.038 1.802 0.044 4.418nn NYSE foreign
listed (1)
5.898 8.214++ 5.898 8.214++ 0.845 0.457 OTC foreign
listed (1)
1.644 1.577 1.644 1.577 2.782 5.352(a)
Non-US foreign listed ( )
5.111 4.964(a) 5.111 4.963(a) -1.543 1.107 Size (log of mkt cap.) 1.315 3.328n
1.315 3.328n
0.865 2.429 Leverage (debt/debt
1mkt cap.)
0.031 1.234 0.031 1.234 0.016 0.839
UK company 5.993 0.000 NA 1.853 1.279
French company 1.637 0.000 NA 1.262 0.645
German company 5.761 0.000 NA 1.380 0.355
Japanese company 5.881 0.000 NA 3.868 5.069nn
Industry 1 17.648 0.013 14.591 0.185 1.859 1.561 Industry 2 0.407 0.083 0.407 0.083 0.739 0.626 Industry 3 0.727 0.092 0.727 0.092 0.008 0.000 Constant 10.753 0.002 4.991 3.738n
8.941 8.667nn
Nagelkerke R2 0.817 0.627 0.577
% correctly predicted (based on 50% cut-off)
93.8 89.8 86.6
Model chi-square 74.106 29.666 41.435
Modelp5 0.000 0.000 0.000
Number of
o0.05 one-tailed test.nnSignificant atpo0.05 two-tailed test.nSignificant at
po0.10 two-tailed test. NA5not applicable.
(a)Significant but opposite sign. ADOPT: Individual country regressions are not calculated where all firms use US GAAP (UK: 2 out of 2; France: 7 out of 7; Japan 24 out of 24; Australia 1 out of 1, see Table 7).
non-US foreign listing is not associated with choice of either US GAAP or IAS (Table 12). Arguments that IAS are a more attractive regime than US GAAP for companies with non-US foreign listings are not supported by the evidence.7 An explanation for the unexpected result could be that companies with non-US listings have been foreign listed for some years, and their original choice of ‘‘international’’ standards was US GAAP. IAS have emerged as acceptable ‘‘international’’ standards only in recent years. Another possible reason for use of US GAAP is that the firm is preparing for a future US stock exchange listing.
German firms make greater use of IAS than firms in other countries (German company is negative and significant in the full sample,po0.05, Table 12).8Table 7 (Regression 3) shows that 58% of firms choose IAS and 42% US GAAP, indicating an overall preference for IAS in Germany. However, if a firm is NYSE listed, use of US GAAP is more likely (NYSE is positive and significant, po0.05, Table 12). Firms with more foreign revenue are more likely to use IAS (Foreign revenue is negative and significant,po0.10, Table 12). It was predicted that French firms would also prefer IAS, but this is not confirmed by the results. US GAAP is used by 74% of French companies, while 15% use IAS. The remaining 11% use both US GAAP and IAS, or state that ‘‘international’’ standards are used, without naming US GAAP or IAS (Table 7, Regression 3). The preference for US GAAP among French firms emphasizes that each country’s response to harmonization pressures is different. Despite institutional similarities between France and Germany (noted in Table 2), French companies make greater use of US GAAP than German firms.
Choice of US GAAP or IAS by Companies Adopting ‘‘International’’ Standards
US GAAP is used by 61% of companies adopting ‘‘international’’ standards, while 39% choose IAS (Table 7, Regression 4). NYSE listed firms are more likely to choose US GAAP, and larger firms are more likely to adopt IAS9(NYSE is positive and significant,po0.05; Size is negative and significant,po0.10, Table 13). The non-US foreign listing variable is significant but it has the opposite sign. It is associated with the use of US GAAP not IAS, as predicted. The model is significant (w2574.106,
po0.001) with R250.817 and classification accuracy of 93.8% (Table 13). Since most adopting firms are from Germany, the results for the full sample are mirrored in the country regression for Germany (Table 13).
Choice of US GAAP or IAS by Supplementary Users of ‘‘International’’ Standards
Most companies making supplementary use of ‘‘international’’ standards select US GAAP (69%, Table 7, Regression 5), while 22% choose IAS and 9% use other national standards or both US GAAP and IAS. The model is significant (w2541.435, po0.001) with R250.577 and classification accuracy of 86.6% (Table 13). However, it provides no explanatory variables for the choice of US GAAP. The choice of IAS is associated with more foreign revenue (Foreign revenue is positive and significant,po0.05, Table 13).10The choice of US GAAP or IAS by NYSE and non-US foreign listed firms is not significantly different from the choice made by firms in the domestic-only listed group. Being an OTC traded company is associated with supplementary use of IAS, not US GAAP as predicted. Some OTC companies voluntarily use ‘‘international’’ standards, with 58% selecting IAS and 34% US GAAP (Table 8). Thus, some firms make supplementary use of IAS rather than US GAAP, despite their presence in the US market. Other firms select US GAAP, even though they are more onerous than IAS.
7. Conclusions
standards and activity in product markets supports Zarzeski’s (1996) suggestion that more international firms seek a global reporting culture. Firms using ‘‘international’’ standards were more likely to have a foreign stock exchange listing, consistent with Ashbaugh (2001). The results revealed that there was some use of ‘‘international’’ standards in all countries, but the extent of use, and the way standard were used (that is, by adoption or supplementary use) was in accordance with the institutional framework in each country. The findings show that companies have voluntarily responded to pressure to produce more comparable financial information, and that standard setters and regulators have a key role to play in promoting the harmonization process.
Firms in Germany, France and Japan made greater use of ‘‘interna-tional’’ standards than firms from the UK and Australia. Companies from Germany and Japan were more likely to adopt, and firms from the UK, France and Australia were more likely to make supplementary use of, ‘‘international’’ standards. These findings reflect both country differences in the focus of national accounting systems, and the extent to which each institutional framework permitted the use of ‘‘international’’ standards.
The study found that overall there was greater use of US GAAP than IAS. This outcome was surprising, given that IAS are more politically neutral than US GAAP. However it shows the influence of US GAAP in the international business environment, and demonstrates the importance of US capital markets and the impact of the SEC’s US GAAP reconciliation requirements. There was considerable voluntary use of IAS in Germany, which is a positive signal for IAS adoption in 2005. In contrast, French firms were more likely to use US GAAP than IAS. The preference for US GAAP as a way to promote international comparability confirms the importance of the convergence activities of the IASB and US standards setters (see IASB, 2002e).
produce standards that are acceptable to US standard setters and regulators.
The relationship between firm attributes (such as proportion of foreign revenue, size and leverage) and the use of ‘‘international’’ standards was different between each of the five countries in the study. Future research could seek further insights into the reasons for these differences. It could also consider other countries with a history of using ‘‘international’’ standards, such as the Netherlands and Switzerland, and countries from the Asia Pacific region that have used non-national standards, such as the Philippines and Malaysia. An overview of the way companies use ‘‘international’’ standards has been provided, and it relates specifically to 1999–2000. The situation will evolve as regulatory changes allow or require greater use of ‘‘international’’ standards, providing further research opportunities. Investigating the level of acceptance of IAS by market participants, and assessing the quality of IAS reporting, will be possible as more companies adopt IAS. The cross-border enforcement of ‘‘international’’ standards, an issue of concern for regulators and standards setters, raises additional research questions.
Notes
1. The International Accounting Standards Committee. From 2001 the IASC was restructured to create an independent standard setting board, the International Accounting Standards Board (IASB). Standards issued by the IASB will be called International Financial Reporting Standards (IFRS) (IASC, 2000a; IASB, 2002a).
2. Ballet al. (2000) describe the different role of accounting in common law and code law countries.
3. Robustness tests (not reported) show that size remains significant when the alternative size proxy total revenue is used. Size is not significant when total assets is used. If proportion of foreign assets or foreign subsidiaries is used instead of foreign revenue, the variables are not significant.
4. In Japan and Australia, the leverage variable is significant but positive, not negative as predicted. An explanation could be that firms with higher leverage may seek equity rather than debt capital in the future and consequently use ‘‘international’’ standards to communicate with potential investors.
5. Robustness tests (not reported) show that size remains significant when the alternative size proxy total assets is used. Size is not significant if total revenue is used. If proportion of foreign assets is used instead of foreign revenue it is significant. If proportion of foreign subsidiaries is used it is not significant.
7. An alternative composition of the NON-US group was investigated in robustness tests (not reported). All firms with non-US foreign listings, irrespective of whether or not they traded in the OTC market, were included in the NON-US group. The change in group composition produced little change in results and did not change the conclusions drawn in this article.
8. Regression 3 shows that German companies are significantly different from Australian companies (Australia is the omitted dummy variable). Robustness tests (not reported) confirm significant differences between Germany and France and Japan in choice of US GAAP or IAS.
9. Robustness tests (not reported) show that size remains significant when the alternative size proxy total revenue is used. Size is not significant when proportion of total assets is used. 10. Robustness tests (not reported) show that if proportion of foreign assets is used instead of foreign revenue it is significant. If proportion of foreign subsidiaries is used it is not significant.
References
Ackerlof, G., ‘‘The Market for Lemons: Quality Uncertainty and the Market Mechanism,’’
Quarterly Journal of Economics(August 1970), pp. 488–500.
Ashbaugh, H., ‘‘Non-US Firms’ Accounting Standard Choices,’’Journal of Accounting and Public Policyvol. 20 (2001), pp. 129–153.
ASX, ‘‘ASX Pushes Support for New Accounting Standards,’’ASX News Release(28 August, 1996).
Australian Stock Exchange. (2000), http://www.asx.co.au.
Ball, R., S. Kothari and A. Robin, ‘‘The Effect of International Institutional Factors on Properties of Accounting Earnings,’’Journal of Accounting and Economicsvol. 9 (2000), pp. 1–51.
Bank of New York, ‘‘Bank of New York Depositary Receipts Services,’’ (2000) http:// www.bankofny.com.
Botosan, C., ‘‘Disclosure Level and the Cost of Capital,’’Accounting Reviewvol. 72 (1997), pp. 323–349.
Botosan, C. and C. Frost, ‘‘Regulation Disclosure and Market Liquidity,’’ Working paper (Washington University, 1998).
Bradbury, M., ‘‘Voluntary Disclosure of Financial Segment Data: New Zealand Evidence,’’
Accounting and Finance(May, 1992), pp. 15–26.
Buzby, S., ‘‘Company Size, Listed Versus Unlisted Stocks and The Extent of Financial Disclosure,’’Journal of Accounting Researchvol. 13 (1975), pp. 16–37.
Cheung, C. and J. Lee, ‘‘Disclosure Environment and Listing on Foreign Stock Exchanges,’’
Journal of Banking and Financevol. 19 (1995), pp. 347–362.
Choi, F., ‘‘Financial Disclosure in Relation to a Firm’s Capital Costs,’’Accounting and Business Research(Autumn, 1973), pp. 159–175.
Choi, F. and R. Levich,The Capital Market Effects of International Accounting Diversity
(Homewood: Dow Jones, 1990).
Cooke, T., ‘‘Voluntary Corporate Disclosure by Swedish Companies,’’ Journal of International Financial Management and Accounting(Summer, 1989), pp. 171–195. Cooke, T., ‘‘An Assessment of Voluntary Disclosure in the Annual Reports of Japanese
Corporations,’’International Journal of Accountingvol. 26 (1991), pp. 174–189. Datastream (London: Datastream International, 2000).
Doupnik, T. and S. Salter, ‘‘External Environment, Culture, and Accounting Practice: a Preliminary Test of a General Model of International Accounting Development,’’
International Journal of Accountingvol. 30 (1995), pp. 189–207.
Dumontier, P. and B. Raffournier, ‘‘Why Firms Comply Voluntarily with IAS: an Empirical Analysis with Swiss Data,’’ Journal of International Financial Management and Accountingvol. 9 (1998), pp. 216–245.
Dye, R. and S. Sunder, ‘‘Why not Allow FASB and IASB Standards to Compete in the US?’’
Accounting Horizonsvol. 15 (2001), pp. 257–271.
Emenyonu, E. and A. Adhikari, ‘‘Measuring the Degree of International Harmony in Selected Accounting Measurement Practices,’’ Australian Accounting Review vol. 8 (1998), pp. 24–32.
Emenyonu, E. and S. Gray, ‘‘EC Accounting Harmonization: an Empirical Study of Measurement Practices in France, Germany and the UK,’’Accounting and Business Researchvol. 23 (1992), pp. 49–58.
Financial Reporting Council (FRC), ‘‘Adoption of International Accounting Standards by 2005,’’ (2002) www.frc.gov.au, News bulletin 2002/4 3 July.
Firth, M., ‘‘The Impact of Size, Stock Market Listing And Auditors on Voluntary Disclosure in Corporate Annual Reports,’’Accounting and Business Research(Autumn, 1979), pp. 273–280.
Frost, C. and K. Ramin, ‘‘Corporate Financial Disclosure: A Global Assessment,’’ in
Handbook of International Accounting and Finance, F. Choi, ed. (New York: John Wiley, 1997).
Gernon, H. and G. Meek,Accounting: an International Perspective(Boston: Irwin McGraw-Hill, 2001).
Gray, S., ‘‘Towards a Theory of Cultural Influence on the Development of Accounting Systems Internationally,’’Abacusvol. 3 (1988), pp. 1–15.
Gray, S., G. Meek and C. Roberts, ‘‘International Capital Market Pressures and Voluntary Annual Report Disclosures by US and UK Multinationals,’’Journal of International Financial Management and Accountingvol. 6 (1995), pp. 43–68.
Haskins, M., K. Ferris and T. Selling,International Financial Reporting and Analysis: a Contextual Emphasis(Boston: Irwin McGraw Hill, 2000).
Healy, P. and K. Palepu, ‘‘Information Asymmetry, Corporate Disclosure, and Capital Markets: a Review of the Empirical Disclosure Literature,’’Journal of Accounting and Economicsvol. 31 (2001), pp. 405–440.
Herrmann, D. and W. Thomas, ‘‘Harmonization of Accounting and Measurement Practices in The European Community,’’ Accounting and Business Research vol. 25 (1995), pp. 253–265.
Hossain, M. and M. Adams, ‘‘Voluntary Financial Disclosure by Australian Listed Companies,’’Australian Accounting Reviewvol. 5 (1995), pp. 45–55.
Hunt, H., ‘‘Potential Determinants of Corporate Inventory Accounting Decisions,’’Journal of Accounting Research(Autumn, 1985), pp. 448–467.
IASC, ‘‘News – IASC Members Approve New Constitution,’’ (2000a) http://www.iasc.or-g.uk/news/cen8_096.htm. 24 May.
IASC, ‘‘News – IASC Welcomes European Commission Communication on Moves Towards Global Financial Reporting Based on IASC standards,’’ (2000b) http:// www.iasc.org.uk/news/cen8_097.htm. 14 June.
IASB, ‘‘News – IASB Chairman Welcomes the EU’s Decision to Adopt International Accounting Standards,’’ (2002a) http://www.iasb.org.uk/news. 7 June.
IASB, ‘‘IASB/IAS Around the World/Capital Markets and IFRS/National Regulators,’’ (2002b) http://www.iasb.org.uk.7 July.
IASB, ‘‘IASB/IAS Around the World/IFRS in Use,’’ (2002d) http://www.iasb.org.uk. 7 July.
IASB, ‘‘FASB and IASB Agree to Work Together Toward Convergence of Global Accounting Standards,’’ (2002e) http://www.iasc.org.uk/news. 29 October.
IOSCO, ‘‘IASC Standards,’’ (2000) http:/www.iosco.org/press/presscomm000517.html. 17 May.
Jensen, M. and W. Meckling, ‘‘Theory of the Firm: Managerial Behavior, Agency Costs and Ownership Structure,’’Journal of Financial Economicsvol. 3 (1976), pp. 305–360. JP Morgan, ‘‘JP Morgan ADR.com,’’ (2000) http://www.adr.com.
KPMG,Global Financial Reporting IAS or US GAAP?(London: KPMG, 2000).
Leuz, C. and R. Verrecchia, ‘‘The Economic Consequences of Increased Disclosure,’’
Journal of Accounting Researchvol. 38 (2001), pp. 91–125.
Levitt, A. ‘‘Letter from SEC to US Congress,’’ (1997) http://www.sec.gov. London Stock Exchange, (2000) http://www.londonstockexchange.uk.
Malone, D., C. Fries and T. Jones, ‘‘An Empirical Investigation of the Extent of Corporate Financial Disclosure in The Oil and Gas Industry,’’Journal of Accounting, Auditing and Financevol. 8 (1993), pp. 249–273.
McKinnon, J.,The Historical Development and Operational Form of Corporate Reporting Regulation in Japan(New York: Garland, 1986).
McKinnon, J. and L. Dalimunthe, ‘‘Voluntary Disclosure of Segment Information by Australian Diversified Companies,’’ Accounting and Finance vol. 33 (1993), pp. 33–50.
McNally, G., L. Eng, and C. Hasseldine, ‘‘Corporate Financial Reporting in New Zealand: an Analysis of User Preferences, Corporate Characteristics, and Disclosure Practices for Discretionary Information,’’ Accounting and Business Research (Winter, 1982), pp. 11–20.
Meek, G., C. Roberts, and S. Gray, ‘‘Factors Influencing Voluntary Annual Report Disclosures by US, UK and Continental European Multinational Corporations,’’
Journal of International Business Studiesvol. 2 (1995), pp. 555–572.
Mitchell, J., W. Chia, and A. Loh, ‘‘Voluntary Disclosure of Segment Information: Further Australian Evidence,’’Accounting and Financevol. 35 (1995), pp. 1–16.
Mueller, G.,International Accounting(London: Macmillan, 1967). NASDAQ, (2000) http://www.nasdaq.com.
New York Stock Exchange, (2000) http://www.nyse.com.
Nobes, C., ‘‘A Judgmental International Classification of Financial Reporting Practices,’’
Journal of Business Finance and Accounting(Spring, 1983).
Nobes, C. and R. Parker,Comparative International Accounting, 5th ed. (London: Prentice Hall, 1998).
Nobes, C., ‘‘Towards a General Model of the Reasons for International Differences in Financial Reporting,’’Abacusvol. 34 (1998), pp. 162–187.
Paris Stock Exchange, (2000) http://www.paris-bourse.com.
Price Waterhouse,Accounting Principles and Reporting Practices: a Survey in 38 Countries
(London: ICAEW, 1973).
Price Waterhouse,Accounting Principles and Reporting Practices: a Survey in 46 Countries
(London: ICAEW, 1975).
Price Waterhouse,International Survey of Accounting Principles and Reporting Practices
(London: Butterworth, 1979).
Radebaugh, L. and S. Gray,International Accounting and Multinational Enterprises, 4th ed. (New York: John Wiley, 1997).
Saudagaran, S.,International Accounting: a User Perspective(Ohio: South Western College Publishing, 2001).
Saudagaran, S. and G. Biddle, ‘‘Financial Disclosure Levels and Foreign Stock Exchange Listing Decisions,’’Journal of International Financial Management and Accountingvol. 4 (1992), pp. 106–148.
Saudagaran, S. and G. Biddle, ‘‘Foreign Listing Location: a Study of MNCs and Stock Exchanges in Eight Countries,’’Journal of International Business Studiesvol. 26 (1995), pp. 319–341.
Saudagaran, S. and G. Meek, ‘‘A Review of the Research on the Relationship between International Capital Markets and Financial Reporting by Multinational Firms,’’
Journal of Accounting Literaturevol. 16 (1997), pp. 127–159.
SEC, ‘‘The Concept Release on International Accounting Standards,’’ (2002) http:// www.sec.gov/rules/concept/34-42430.htm. 7 July.
Singhvi, S. and H. Desai, ‘‘An Empirical Analysis of the Quality of Corporate Financial Disclosure,’’Accounting Reviewvol. 46 (1971), pp. 129–138.
Spence, M., ‘‘Job Market Signaling,’’Journal of Economics(August, 1973), pp. 355–374. Tokyo Stock Exchange, (2000) http://www.tse.or.jp.
Zarzeski, M., ‘‘Spontaneous Harmonization Effects of Culture and Market Forces on Accounting Disclosure Practices,’’Accounting Horizonsvol. 10 (1996), pp. 18–37. Zeff, S.,Forging Accounting Principles in Five Countries(Illinois: Stripes Publishing, 1972). Zeff, S., ‘‘The Coming Confrontation on International Accounting Standards,’’The Irish