Multi-Responses Optimization Of Edm
Sinkingprocess of Aisi D2 Tool Steel using
Taguchi Grey
–
Fuzzy Method
Bobby O.P Soepangkat
1,Arif Wahyudi
1, Bambang Pramujati
1Abstract Rough machining with Electro Discharge Machining (EDM) process gives a large Material Removal Rate
(MRR) and high Surface Roughness (SR), while finish machining gives low SR and very slow MRR. In this study, Taguchi method coupled with Grey Relational Analysis (GRA) and fuzzy logic has been applied for optimization of multiple performance characteristics. The EDM machining parameters (gap voltage, pulse current, on time and duty factor) are optimized with considerations of multiple performance characteristics, i.e., MRR and SR. The quality characteristic of MRR is larger-is-better, while the quality characteristic of SR is smaller-is-better. Based on Taguchi method, an L18
mixed-orthogonal array is selected for the experiments. By using the combination of GRA and fuzzy logic, the optimization of complicated multiple performance characteristics was transformed into the optimization of a single response performance index. The most significant machining parameters which affect the multiple performance characteristics were gapvoltage and pulse current. Experimental results have also shown that machining performance characteristics of EDM process can be improved effectively through the combination of Taguchi method, GRA and fuzzy logic.
Keywords Taguchi, Grey relational analysis, Fuzzy logic, EDM, AISI D2
AbstrakRough Machiningyang menggunakan proses Electro Discharge Machining (EDM) menghasilkan Material Removal Rate (MRR) yang sangat rendah. Dalam penelitian ini, metode Taguchi bersamaan dengan Grey Relational Analysis (GRA) dan fuzzy logic telah diaplikasikan untuk mengoptimalkan karakteristik performansi multiple. Parameter dari EDM Machining (gap voltage, pulse current, on time dan duty factor) dioptimalkan dengan pertimbangan dari karakteristik performansi multiple, seperti MRR dan SR. Semakin besar kualitas karakteristik MRR maka akan semakin baik, sedangkan semakin kecil kualitas karakteristik SR maka akan semakin baik. Sesuai dengan metode Taguchi, sebuah L18 mixed-orthogonal
array telah dipilih untuk digunakan dalam penelitian ini, dengan menggunakan kombinasi dari GRA dan fuzzy logic, optimalisasi performance single response. Parameter yang terpenting dari
Keywordsprobe spektrofotometer,analysis real time, fiber optik, rhodamine B, in-situ
I. INTRODUCTION1
lectric Discharge Machining (EDM) is one of the most popular modern non-conventional machining methods. The removal of material in EDM is based upon the erosion effect of electric sparks occuring between an electrode (the cutting tool) and the workpiece in the presence of a dielectric fluid. Minute the particles of metal or chips, generally in the form of hollow spheres, are removed by melting and vaporization, and are washed from the gap by dielectric fluid which is continuously flushed between the tool and workpiece. Nowdays, EDM technology is widely used in tool, die and mould making industries, for machining of heat treated tool steels and many advanced materials which require high precision, complex shapes and high surface finish. Heat treated tool steels are very difficult to machine using conventional processes, due to rapid tool wear, inability to generate complex shapes and imparting better surface finish [1].
Based on the types of processes, EDM can be classified as rough cutting and finishing cutting. The main issue of rough cutting is to remove the material as quickly as possible so that both processing time and production cost can be reduced.
1Bobby O.P Soepangkat,Arif Wahyudi, Bambang Pramujati are with
Department of Mechanical Engineering, Institut Teknologi Sepuluh Nopember, Surabaya, Indonesia. E-mail: [email protected]
Generally, the performance of the rough cutting processes can be evaluated based on Material Removal Rate (MRR), Surface Roughness (SR) and Electrode Wear Ratio (EWR), which are correlated with the machining parameters such as on time, off time, discharge current, servo voltage, etc.
The machining parameters are usually selected based on either the experience or the proposed guidelines of the manufacturers [2]. However, this selection procedure does not lead to the optimal and economically effective use of the machines. Taguchi method has been used extensively for optimization of a single performance characteristic. Solving the more complex and demanding multiple performance characteristics is still an interesting and challenging research problems [3-4].
The grey system theory developed by Deng [5] in 1982 has been proven to be useful for dealing with unclear, uncertain and incomplete information. The grey relational analysis based on the grey system theory can be used to solve the complicated interrelationships among multiple performance characteristics or responses effectively. A grey relational grade is obtained from the average of the grey relational coefficient to analyze the relational degree of the multiple responses [6].
Therefore, optimization of the performance characteristics with fuzzy logics has been considered in this study. In this case, a fuzzy reasoning of the multiple performance characteristics has been developed based on fuzzy logics. As a result, optimization of the complicated multiple performance characteristics can be transformed into optimization of a single grey-fuzzy reasoning grade. The purpose of this paper is to demonstrate an application of grey relational analysis and the fuzzy-based Taguchi method to identify the optimum MRR and surface roughness with a particular combination of machining parameters in EDM sinking process of AISI D2 tool steel.
II. METHOD
A. Materials and Equipment
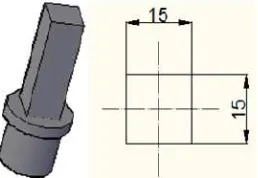
The experimental studies were performed on a EDM sinking Aristech LS-550machine tool. The schematic diagram of the experimental set-up isshown in Fig. 1. As work piece material, AISI D2 tool steel with 40 mm x 15 mm x 10 mm size was used. Fig. 2 shows the geometric of workpiece. A rectangular copper was used as electrode in the experiments, and its geometric is shown in Fig. 3. The shape of workpiece after machining is shown in Fig. 4. Different setting of gap voltage,pulse current, on time andduty factor were used in the experiments as shown in Table 1. The surface roughness measurements were performed by using a Mitutoyo seven. L18 orthogonal array that used for the experiment
is shown in Table 2 and led to a total 18 tests. The L18
orthogonal array is generated by using statistical software. A random order was also determined for running the tests.
C. Taguchi Grey Fuzzy Optimization
Taguchi’s loss function is estimates the deviation
between the experimental value and the desired value. The value of the loss function is further transformed into a signal-to-noise (S/N)ratio. Basically, there are three categories of the process response in the analysis of the S/N ratio, i.e., the lower-the-better, the higher-the-better, and the nominal-the-better. The S/N ratio for each level of process parameters is computed based on the S/N analysis. Regardless of the category of the process response, a larger S/N ratio corresponds to a better process response. Therefore, the optimal level of the process parameters is the level with the highest S/N ratio. This is true for the optimization of a single process response. However, optimization of multiple responses cannot be as straight forward as the optimization of a single process response. A higher S/N ratio for one process response may correspond to a lower S/N ratio for
another process response. As a result, an overall evaluation of the S/N ratios is required for the optimization of a multi-response process.
The steps of Taguchi grey fuzzy optimization are:
1. Calculation of S/N ratio for each response
The signal-to-noise (S/N) ratio is a measure of the data set relative to the standard deviation. If the S/N is large, the magnitude of the signal is large relative to the noise, as measured with the standard deviation. There are three S/N ratios available, depending on the type of the performance characteristics; the LB, HB, and NB. In EDM process lower surface finish, cutting force, feed force and higher tool life are indications of better
performance. Therefore, for obtaining optimum
machining performance, the “LB” and “HB” ratios were selected for surface finish, cutting force, feed force and tool life respectively. The S/N ratios for each type of characteristic can be calculated as follows:
a. Low is better (minimize):
[∑ ] (1)
b. High is better (maximize):
[∑ ] (2)
Where n is the number of measurements, and is the measured characteristic value. Regardless the category of performance characteristics, the greater S/N ratio corresponds to the better performance characteristics.
2. Normalization of S/N ratio
In the grey relational analysis, experimental data (material removal rate and surface roughness) are first normalized in the range between 0 and 1, which is also called the grey relational generating. The normalization of S/N ratio was conducted by using the following
3. Calculation of grey relational coefficient (GRC)
The grey relational coefficient is calculated from the normalized experimental data to express the relationship between the desired and actual experimental data. All ( ) then converted into ( ) or Grey Relational Coefficient (GRC) by using the following equation [5]:
defuzzifier. The implementation of fuzzy logic includes the following steps. First, the fuzzifier uses membership function to fuzzify the grey relational coefficient. The inference engine then performs a fuzzy inference on fuzzy rules in order to generate a fuzzy value. Finally, the defuzzifier converts the fuzzy value into a grey fuzzy reasoning grade or GFRG.
In the following, the concept of fuzzy reasoning is described briefly based on the two-input (material removal rate and surface roughness)-one output fuzzy logic unit. The fuzzy rule base consists of a group of if-then control rules with two inputs or two grey relational coefficient x1 and x2, and one multi-response output y, µCi.Various degrees of membership of the fuzzy sets are
calculated based on the values of x1, x2and y. Nine fuzzy
rules are directly derived based on the fact that the larger grey relational coefficient is, the better is the process response. By taking the max–min compositional operation [10], the fuzzy reasoning of these rules yields a fuzzy output. Supposing that x1 and x2 are the two input
values of the fuzzy logic unit, the membership function of the output of fuzzy reasoning can be expressed as
μD0(y) = (μA1(x1) ∧ μB1(x2)
∧ μC1(x2) ∧ μD1(y))Λ_ ∨ (μAn(x1) ∧ μBn(x2) ∧ μCn(x3) ∧ μDn(y))(5)
where is the minimum operation and is the maximum operation. Finally, a defuzzification method, called the center-of-gravity method [7], is adopted here to transform the fuzzy inference output µD0 into a
non-fuzzy value y0, i.e.,
∑ ∑ ( )( ) (6)
In this paper, the non-fuzzy value y0 is called grey fuzzy
reasoning grade or GFRG (Lin et al., 2002). It can be summarized that the larger is the GFRG, the better is the performance characteristic.
III.RESULT & DISCUSSION
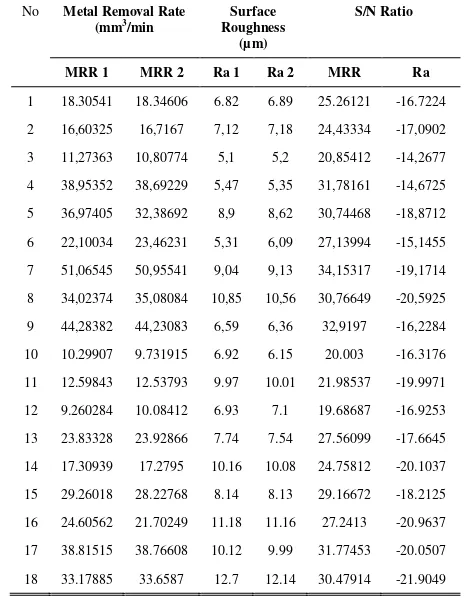
Table 3 shows the experimental results and S/N ratio for the MRR and surface roughnes based on the experimental parameter combinations (Table 2). Fuzzy rules which are applied in fuzzification is shown in Table 4. T is tiny, VS is very small, S is small, SM is smaller middle, M is middle, LM is larger middle, L is large, VL is very large and H is huge.
Table 5 shows the sequences after the grey relational generating. An ideal sequence ( ( ) = 1, k = 1, 2, . . . ,
18) for MRR and surface roughness Table 6 shows the grey relational coefficient for each experiment using the L18 orthogonal array.Table 7 shows the experimental
results for the grey-fuzzy reasoning grade using the experimental layout (Table 2). In this paper, three (3) fuzzy subsets are assigned in the grey relational coefficient of the material removal rate and surface roughness (Fig. 5). For both input, i.e., material removal rate and surface roughness, the interval is between 0 and
1. Nine (9) fuzzy subsets are assigned in the multi-response output in the interval between 0 and 1 (Fig 6.)
Since the experimental design is orthogonal, it is then possible to separate out the effect of each process parameter at different levels. The mean of the grey-fuzzy reasoning grade for each level of the process parameters is calculated (Table 8). Basically, the larger the mean of the grey-fuzzy reasoning grade, the better is the multiple process responses.
The analysis of variance (ANOVA) investigates those process parameters which significantly affect the performance characteristics. This is accomplished by separating the total variability of the multi-response performance from the total mean of the GFRG, into contributions by each of the process parameter and the error. First, the total sum of the squared deviations (SST)
from the total mean of the GFRG m can be calculated as ∑ ( ) (7)
where n is the number of experiments in the orthogonal array and µ is the mean of the GFRG for the ith
contribution by each of the process parameter in the total sum of the squared deviations SST can be used to evaluate the importance of the process parameter change on the performance characteristics. In addition, the F-test can also be used to determine which process parameters have a significant effect on the performance characteristic. Usually, the change of the process parameter has a significant effect on the performance characteristic when the F-value is large. Results of ANOVA (Table 9) indicate that gap voltage and on time are the most significant processparameters for affecting the multiple process responses.
Hence, based on the GFRG graph (Fig. 7) and the results of ANOVA (Table 8), the optimal machining condition for EDM sinking process of AISI D2 tool steel are gap voltage (A) at level 1, pulse current (B) at level 2, on time (C) at level 3 and duty factor (D) at level 1.
After selecting the optimal level of parameters setting, the final step is to predict and verify the improvement of the performance characteristics by using the optimal level of the EDM parameters. The estimated GFRG ̂ using the optimal level of the process parameters can be calculated by using the following equation [3]:
̂ ∑ ( ̅ ) (8) where αm is the total mean of the GFRG, αi is the mean of
the GFRG at the optimal level and q is the number of the machining parameters that significantly affects the multiple response characteristics.
IV.CONCLUSION
In this study, the Taguchi-Grey-Fuzzy method has been implemented for the optimization of the EDM process of AISI D2 tool steel with multiple performance characteristics. The combination of grey relational and fuzzy logic analysis of material removal rate and surface roughness obtained from the Taguchi method reduced from the multiple performance characteristics to a single performance characteristic which is called the grey fuzzy reasoning grade. Hence, the optimization of the complicated multiple performance characteristics of the EDM process can be significantly simplified by using Taguchi-grey-fuzzy method. It is also shown that the performance characteristics of EDM process such as material removal rate and surface roughness are also greatly improved by implementing this method.
REFERENCES
[1] Shankar Singh , S Maheswari, and P C Pandey, "Some Investigation into The Electric Discharge Machining of Hardened Tool Steel using Different Electrode Material," Journal of Material Processing Technology, vol. 149, no. 1-3, pp. 272-277, JUne 2004.
[2] Y S Liao, J T Huang, and H C Su, "A Study on The
Machining-Parametersoptimization of Wire
Electrical Discharge Machining," Journal of Material Processing Technology, vol. 71, no. 3, pp. 487–493, November 1997.
[3] J L Lin, K S Wang, B H Yan, and Y S Tarng, "Optimization of The Electrical Discharge Machining Process Based on The Taguchi Method With Fuzzy Logics," Journal of Materials Processing Technology, vol. 102, no. 1-3, pp. 48– 55, May 2000.
[4] J Antony, "Simultaneous Optimization of The Multiple Quality Characteristics in Manufacturing
Processes using Taguchi’s Quality Loss Function,"
The International Journal of ADvanced Manufacturing Technology, vol. 17, no. 2, pp. 134– 138, January 2001.
[5] J Deng, "Introduction to Grey System," The Journal of Grey System, vol. 1, no. 1, pp. 1–24, 1989. [6] J L Lin and C L Lin, "The use of Grey-Fuzzy Logic
for The Optimization of The Manufacturing Process," Journal of Material Processing Technology, vol. 160, no. 1, pp. 9 -14, March 2005. [7] L A Zadeh, "Fuzzy Sets," Information and Control,
vol. 8, no. 3, pp. 338–353, June 1965.
[8] Sung H Park, Robust Design and Analysis for Quality Engineering, 1st ed. London: Chapman & Hall, 1996.
[9] Saurav Datta and Siba S Mahapatra, "Modeling, Simulation and Parametric Optimization of Wire EDM Process using Response Surface Methodology
Coupled with Grey-Taguchi Technique,"
International Journal of Engineering, Science and Technology, vol. 2, no. 5, pp. 162-183, 2010.
[10] H J Zimmerman, Fuzzy Set Theory and
Applications, 1st ed. London: Kluwer Academic Publishers, 1985.
Figure 1. Schematic diagram of the EDM process. Figure 2.Geometric of workpiece.
Figure 5. Membership functions for material removal rate and surface roughness.
Figure 6. Membership functions for multi-response output.
Figure 7. Grey Fuzzy Reasoning Grade (GFRG) Graph. TABLE1.
Machining parameters and their levels
Machining Parameters Unit Level 1 Level 2 Level 3
Gap Voltage (GV) Volt 30 60 - Pulse current (PC) Ampere 10 15 20 On time (ON) s
Duty Factor (DF) -
180 0.4
250 0.5
300 0.6
TABLE 2. ORTHOGONAL ARRAY L18
No. GV PC ON DF
1 30 10 180 0.4
2 30 10 250 0.5
3 30 10 300 0.6
4 30 15 180 0.4
5 30 15 250 0.5
6 30 15 300 0.6
7 30 20 180 0.5
8 30 20 250 0.6
9 30 20 300 0.4
10 60 10 180 0.6
11 60 10 250 0.4
12 60 10 300 0.5
13 60 15 180 0.5
14 60 15 250 0.6
15 60 15 300 0.4
16 60 20 180 0.6
17 60 20 250 0.4
18 60 20 300 0.5
TABLE 3.
EXPERIMENTAL RESULTS FOR MRR AND SR AND THEIR S/NRATIO
No Metal Removal Rate
(mm3/min
Surface Roughness
(µm)
S/N Ratio
MRR 1 MRR 2 Ra 1 Ra 2 MRR Ra
TABLE 4.
THE DATA PREPROCESSING OF EACH INDIVIDUAL QUALITY CHARACTERISTICS
No removal rateMaterial RoughnessSurface
Ideal sequence 1 1
TABLE 10.
RESULTS OF CONFIMATION EXPERIMENT
Initial
Optimal Process Condition
Improvement Prediction Experiment
Level of process
parameters GV1PC2ON2DF2 GV1PC2ON2DF2 GV1PC2ON3DF1 Material Removal
Rate (mm3/min) 34.68048 39.52387 increased 13.97%
Surface
Roughness (µm) 8.78 5.37 decreased 38.84%