Social Science
298
The effect of industrial diversification and geographic diversification
on the practice of earnings management (An Empirical Study On
Manufacturing Companies Listed On Indonesian Stock Exchange
Year 2011-2014)
1Dahlia, 2*Hasan Basri
1,2 Department of Accounting, Faculty of Economic, University of Syiah Kuala, Darussalam, Banda Aceh 23111, Indonesia
*Corresponding Author: [email protected]
Abstract
This research is conducted to address the prevalent issues regarding the effect of industrial diversification and geographic diversification either partially or simultaneously on the practice of earnings management. By utilizing purposive sampling techniques on the secondary data, the total of 80 sample studies are drawn from manufacturing companies listed on Indonesian Stock Exchange for the period of 2011-2014. Multiple linear regression analysis provided by SPSS 21.0 is also employed to test the hypothesis constructed within this research. The result of the multiple linear regression analysis presents evidence that industrial diversification and geographic diversification simultaneously have a significant effect on the practice of earnings management. Alongside, it also affirms that partially, industrial diversification and geographic diversification respectively has a significance effect on the practice of earnings management. These findings help to provide scholarly evidence on the implication of diversification strategies on the practice of earnings management to help financial statement users (investor, creditor, stakeholder, etc.), accounting standard setter, and regulators to assess the pervasiveness of earnings management within the company.
Key words: Industrial Diversification, Geographic Diversification, Earnings Management
Introduction
Global volatility of economic condition that often triggers economic crisis indeed shakes up the existence of particular business in a country, either directly or indirectly. The 1998 and 2008 economic crisis for instance substantially exhibit an adverse impact of business climate in Indonesia, paralyzing most of economic activities due to a large number of companies that eventually gone to bankruptcy (Kartono, 2010). Undoubtedly, this impact has drawn the attention of managers to think of strategies on how to remain sustain and continuously develop in the middle of this unpredicted economic condition as well as emerging business competition. One of the prevalence strategies is that by doing diversification, either industrially or geographically as they are both believed to reduce the business risk of the company (Harto, 2005).
Rash of literatures argue that diversification strategies can improve the performance of companies’ profitability (Farooqi, 2014; Satoto, 2009). However, this diversification, despite its ability to create multi-sources of revenue by expanding the business line, segment, and market share, demands a higher degree of organizational complexity which may create another unfavorable condition (El Mehdi and
Sebuoi, 2011). Agency conflicts hypothesis argues that the company’s degree of organizational
complexity influences the ability of managers to alter and modify information as well as manipulate the earnings. Admittedly, this argument is reinforced by unveiling earnings management cases by
industrially and geographically diversified companies, such as world class’ company, Enron and
Indonesian company, PT Kimia Farma (Arfan, 2006). Then, one might ask, does diversification create a favorable condition for the earnings management?
Social Science
299
standard setter, and regulators to assess the pervasiveness of earnings management within the company.
The remainder of this paper is organized as follows. Section 2 reviews the selected previous studies and formulates the hypothesis. Section 3 presents methodological framework for the basic of analysis. Section 4 discusses the empirical findings and their implications and finally section 5 provides the closing remarks of this paper.
Literature Review
According to the agency conflicts hypothesis, the ability of managers to distort information and
manipulate earnings depends on the company’s degree of organizational complexity. Empirical research
shows that diversified company is generally larger that they have more complex organizational structures, have less transparent operations and that their analysis poses difficulties to investors and analyst alike (Chang and Yu, 2004; Kim and Patzalis, 2003; Liu and Qi, 2007). There is, therefore, a company that is industrially and geographically diversified is supposed to have complex organizational structure as it deals with many business segments and divisions. With this regard, the detailed operation of each segment then is only known by the management and is hardly depicted to the shareholder.
There have been several studies conducted to examine the effects of industrially and geographically diversification on the practice of earnings management. Rodriguez and Hemmen (2010), who conducted a study in Europe, find that for less diversified companies, earnings management measured by discretionary accruals is less pronounced, whereas in relatively more diversified companies, discretionary accruals appears to be more pronounced. Lim et al. (2007), conducted a research in seasoned equity offering setting, also suggest that diversified companies are more aggressive in managing earnings than non-diversified companies. Farooqi et al. (2014) also confirm this view in their research on American companies.
Merits of literatures also suggest that there is a significant effect of geographic diversification to the practice of earnings management. In this regard, El Mehdi and Sebuoi (2011) who conduct a research on U.S companies find that earnings management increases with the level of geographic diversification. They provide evidence that for multinational companies, regardless of whether they operate in one or more business segments, they find income-increasing accruals. This finding is consistent with the view that the costs of geographic diversification outweigh its benefit. They also suggest that the aggressive manipulation in global diversified companies is motivated by high operating cash-flow volatility, high information asymmetry, and amplified operating risk.
Other similar research conducted by Chin et al. (2009) on Taiwanese company. They also agree that greater corporate internationalization is associated with a higher level of earnings management by way of greater asymmetry information and transparency decrement. However on the other hand, a number of studies provide different finding which is inconsistent with the above mentioned. The work of Jiraporn et al. (2008) provides empirical evidence that geographical diversification alone does not appear to impacts earnings management. Some other researchers even reveal that geographic diversification can help in mitigating the practice of earnings management (Farooqi et al., 2014)
Taking the literature review and previous findings as the point of departure, the researcher hypothesizes:
Ha1: Industrial diversification and geographic diversification influence the practice of earnings management.
Ha2: Industrial diversification positively influences the practice of earnings management. Ha3: Geographic diversification positively influences the practice of earnings management.
Research Method
Social Science
300
Variable of industrial diversification and geographic diversification are treated as the independent variable. Variable industrial diversification (IHERF) is translated to the number of industrial segments or business segment owned and reported by company in the financial statement and specifically shown
in the notes to the company’s financial statement. We use the sales-based Herfindahl index as an alternative proxy for industrial diversification (Farooqi et.al, 2014). The Herfindahl index for the ith company in year t is computed as:
IHERFi, t = ∑ [I_SALESFSALES]
where I_SALES denotes the industrial segment sales for i company in year t and FSALES
denotes the company’s total sales across all reported industrial segments in that year.Variable geographical diversification (GHEFR) is translated to the number of geographical segments owned and reported by the company in financial statements that are specifically shown in the notes to the company's financial statements. We also use the sales-based Herfindahl index as an alternative proxy for geographic diversification (Farooqi et.al, 2014). The Herfindahl index for the ith company in year t is computed as:
GHERFi, t = ∑ [G_SALESFSALES ]
where G_SALES denotes the respective geographical sales for the company in year t and
FSALES is the company’s total sales across all reported geographical segments in that year.
Further, to investigate the impacts of industrial diversification and geographic diversification on earnings management, this study employs multiple regression models of the panel data, as follows:
DA= a + b1IHERF + b2 GHERF+ ɛ
where DA is earnings management, a is constant term, b1 and b2 are the estimated parameters for industrial diversification (X1), geographic diversification (X2), and ɛ is the
error term.
Results and Discussion
Descriptive Statistics and Hypothesis Testing Results
N Minimum Maximum Mean Std. Deviation
IHERF 80 0.0000 1.0000 0.6434 0.2559
GHERF 80 0.1684 1.0000 0.5807 0.2515
DA 80 -0.0207 1.2648 0.3953 0.2554
Valid N (listwise) 80
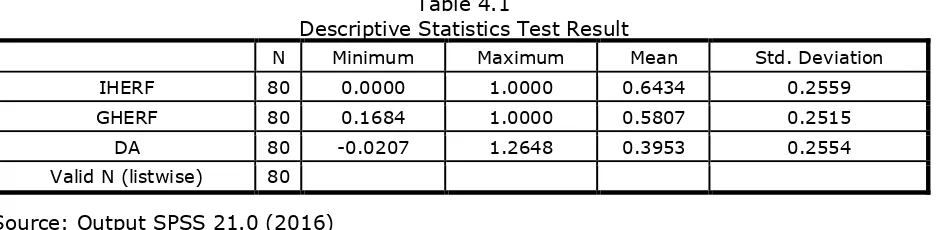
Table 4.1 displays the descriptive statistics for the variable of industrial diversification (IHERF), geographic diversification (GHERF) and earnings management (EM) of the total 80 sample studies. The maximum values of both diversifications, either IHERF or GHERF is 1,0000, which means that there are companies that do not diversified at all or only have one single segment, either industrially or geographically. The minimum value of IHERF is 0.000 while GHERF is 0.1684. On average, the value of IHERF and GHERF is 0.6434 and 0.5807 with standard deviation of 0.2559 and 0.2515, respectively. In regards to earnings management, the maximum value is 1.2648 while the minimum is -0.0207. On average, the value of EM is 0.3953 with standard deviation of 0.2554.
Table 4.2
Source: Output SPSS 21.0 (2016)
Table 4.1
F-Statistical Test
Descriptive Statistics Test Result
Social Science
301
Based on F-Statistical test result displayed on table 4.2 above, it is revealed that the level of significance is 0.000 which is obviously less than 0.05 (5%). It infers that all the independent variables affect the dependent variable simultaneously. Thus, it can be concluded that the first hypothesis (Ha1) stated that industrial diversification and geographic diversification simultaneously affect the practice of earnings management is accepted.
Model
Unstandardized Coefficients Standardized Coefficients
T Sig.
B Std. Error Beta
1 (Constant) -0.01 0.086 -0.117 -0.907
IHERF 0.203 0.097 0.204 2.091 0.040
GHERF 0.474 0.099 0.466 4.786 0.000
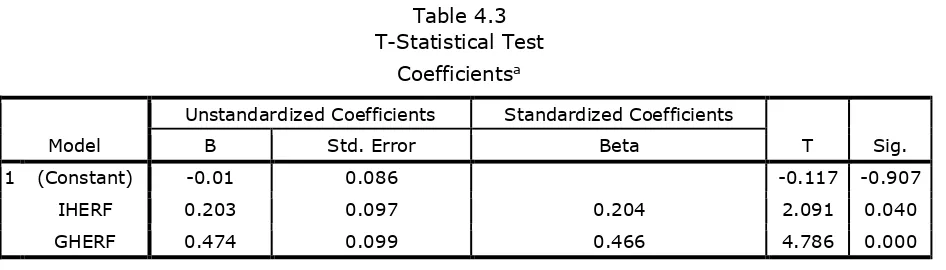
Based on table 4.3, it is obvious that industrial diversification variable (X1) has a significance level of 0.040. As the level of significance is less than 0.05, thus it infers that (X1) has a significance influence on the dependent variable. Therefore, it can be concluded that the second hypothesis (Ha2) stated that industrial diversification has a significance influence on earnings management is accepted.
Geographic diversification variable (X2) has a significance level of 0.000. As the level of significance is less than 0.05, so it means that (X2) has a significance influence on the dependent variable. Hence, it can be concluded that the third hypothesis (Ha3) stated that geographic diversification has a significance influence on earnings management is accepted.
Table 4.4
Model R R Square Adjusted R Square Std. Error of the Estimate
1 .601a .272 .253 0.2207
Table 4.4 displays the result of R Square, i.e. 0.253. It means that 25.3% of the variance of earnings management can be explained by the independent variables of industrial diversification and geographic diversification. However the rest (100%-25.3% =74.7%) is explained by another variables which are not included within this research.
Model Sum of Squares Df Mean Square F Sig.
1 Regression 1.400 2 0.700 14.367 .000a
Residual 3.751 77 0.049
Total 5.151 79
a. Predictors: (Constant): GHERF, IHERF
Table 4.3
Model Summary
bSource: Output SPSS 21.0 (2016)
Source: Output SPSS 21.0 (2016)
T-Statistical Test
Coefficient of Determination Test
Source: Output SPSS 21.0 (2016)
b. Dependent Variable: DA
Coefficients
aa. Predictors: (Constant), GHERF,
Social Science
302
The Effect of Industrial Diversification on the Practice of Earnings Management
The level of significance of industrial diversification variable (X1) is 0.04 and its regression coefficient is 0.203 as shown in table 4.3. As the level of significance is less than 0.05 (5%), and the regression coefficient is positive, it infers that industrial diversification has a positive significant influence on the dependent variable of earnings management. This result is contradictive with the work of Lupitasari and Marsono (2014) which stated that industrial diversification does not have a significant effect on the practice of earnings management. This contradiction might be caused by different objects and proxy used in the study. Lupitasari and Marsono (2014) conducted a study on mining and banking companies and measured the industrial segment by how many segments the company reported, while this current research is focus on the manufacturing companies and uses helfindahl index to measure the industrial diversification. On the other hand, the result of this research is supported by the work of Rodriguez and Hemmen (2010), Lim et al. (2007) and Farooqi et al. (2014). They all found that for less diversified companies, discretionary accruals is less pronounced, whereas in relatively more diversified companies, discretionary accruals appears to be more pronounced.
Finally, the result of this research also confirms the agency conflicts hypothesis which stated that the
ability of managers to distort information and manipulate earnings depends on the company’s degree
of organizational complexity as caused by industrial diversification (Chang and Yu, 2004; Kim and Patzalis, 2003; Liu and Qi, 2007). Thus, the higher the level of industrial diversification carried by the company, the more likely the company to experience earnings management problem. To sum up, multiple regressions analysis of this study reveals that industrial diversification has a positive significant influence on earnings management. Within this regards, it means that Ha2 is accepted while H02 is rejected.
The Effect of Geographic Diversification on the Practice of Earnings Management
Geographic diversification variable (X2) has regression coefficient value of 0.474 at the significance level of 0.000 as shown in table 4.3. As the level of significance is less than 0.05 (5%), and the regression coefficient is positive, it infers that geographic diversification has a positive significance influence on the dependent variable of earnings management. This result is conflicted with the study conducted by Jiraporn et al. (2008) who provide empirical evidence that geographical diversification alone does not appear to impact earnings management practices. This conflicted result might be raised because of the difference of sample studies and year of observation between the two. Jiraporn et al. (2008) conducted a study on American companies for the period of 1994-1998, while this current research is conducted on companies listed on Indonesian Stock Exchange for the period of 2011-2014.
On the other hand, the output of this research is line with the research conducted by El Mehdi and Sebuoi (2011) who finds that earnings management increases with the level of geographic diversification. This finding is also consistent with the work of Chin et al. (2009) who agree that greater corporate internationalization is associated with a higher level of earnings management. Thus, it is inferred that again this current research agrees to accept the information asymmetry problem under
agency conflict hypothesis proposed. Deployment of company’s asset and operations across different
geographical region increases the level of organizational complexity. This organizational complexity then increases the level of information asymmetry between the managers and the shareholders (Lupitasari and Marsono, 2014) and at the same time this also leads to transparency decrement (Chin et. al, 2009) which opens the door to the practice of earnings management. There is, therefore, multiple regressions analysis of this study agrees that geographic diversification has a positive significant influence on earnings management. Within this contention, it means that H3 is accepted while H03 is rejected.
Conclusions
This study is aimed at seeking the empirical evidence of the effect of industrial diversification and geographic diversification on the practice of earnings management in manufacturing companies in Indonesia. The results suggest that industrial diversification and geographic diversification simultaneously and partially have a significant positive effect on the practice of earnings management on manufacturing companies in Indonesia. This evidence provides a new insights for the financial statement users, such as stockholders, potential investors and creditors in their decision making process. In determining the performance of the company, they should take into account the more risk of earnings management practice that bears from an industrially and geographically diversified companies.
Social Science
303
management. In this regards, the future research shall expand the independent variables that might have a stonger effects on the practice of earnings management, such as the ownership structure of the company or the legal protection of the country where the company is located. Further, the future research could also be conducted by expanding the number of sampled companies into other sectors or in other countries. The assosiation between diversification and earnings management may not hold in other sectors and countries. Different behaviors in different sectors and countries may reflect different pressure towards the practice of earnings management. In this regards, there is a need to examine again this effects to other sectors or countries.
References
Arfan, Muhammad. 2006. Pengaruh Arus Kas Bebas, Set Kesempatan Investasi, dan Financial Leverage terhadap Manajemen Laba. Unpublished Disertation. Bandung: Doctoral Degree of Padjajaran University.
Chin, C.L, Y.J. Chen, & T.J. Hsieh. 2009. International Diversification, Ownership Structure, Legal Origin and Earning Management: Evidence from Taiwan. Journal of Accounting, Auditing And Finance, 2: 223-362.
Chang, C. and Yu, X. 2004. Investment Opportunities, Liquidity Premium and Conglomerate Mergers, Journal of Business, 77, 1: 45-75.
Dechow, P. M., R. G. Sloan, A.P Sweeney. 1995. Detecting Earnings Management, The Accounting Review, 70, 2, 193-225.
El Mehdi, I.M. & S. Sebuoi. 2011. Corporate Diversification and Earnings Management. Review Of Accounting And Finance, 10, 2: 176- 196.
Farooqi, J., O. Harris, & T. Ngo. 2014. Corporate Diversification, Real Activities Manipulation, and Firm Value. Journal of Multinational Financial Management, 27: 130-151.
Harto, Puji. 2005. Kebijakan Diversifikasi Perusahaan dan Pengaruhnya terhadap Kinerja : Studi Empiris Pada Perusahaan Publik di Indonesia. Simposium Nasional Akuntansi (SNA) VIII. Solo.
Jiraporn, P., Y.S Kim, & I. Marthur. 2008. Does Corporate Diversification exacerbate or Mitigate Earnings Management? An Empirical Analysis. International Review of Financial Analysis. 17, 5: 1087-1109.
Kartono, Salim. 2010. Crisis To Win. Jakarta Selatan: Transmedia.
Kim, C. & C. Pantzalis. 2003. Global/Industrial Diversification and Analyst Herding, Financial Analysts Journal, 59, 2: 69-80.
Liu, Q. and R.Qi. 2007. Stock Trading and Diversification Discount, Economics Letters, 98, 1: 35-40. Lim, C.Y., David K.D, & Tiong Y.T. 2008. Firm Diversification and Earnings Management: Evidence from
Seasoned Equity Offerings. Review of Quantitative Finance and Accounting, 30,1: 1-27.
Lupitasari, D & Marsono. 2014. Diversifikasi Perusahaan dan Management Laba. Diponegoro Journal of Accounting, 1, 1: 1-12.
Rodriguez P, Gonzalo & S.V. Hemmen. 2010. Debt, Diversification, and Earning Management. Journal of Accounting and Public Policy. 29: 138-159.