1617
AJCS 11(12):1617-1625 (2017) ISSN:1835-2707
doi: 10.21475/ajcs.17.11.12.pne800
Relative leaf expansion rate and other leaf-related indicators for detection of drought stress in
chili pepper (
Capsicum annuum
L.).
Laily Ilman Widuri
1, Benyamin Lakitan
2,3*, Mery Hasmeda
2, Erizal Sodikin
2, Andi Wijaya
2, Mei
Meihana
1,4, Kartika Kartika
1, Erna Siaga
11
Graduate School, Universitas Sriwijaya, Palembang 30139, Indonesia
2College of Agriculture, Universitas Sriwijaya, Inderalaya 30662, Indonesia
3Research Center for Sub-optimal Lands (PUR-PLSO), Universitas Sriwijaya, Palembang 30139, Indonesia
4STIPER Sriwigama, Palembang 30137, Indonesia
*Corresponding author: [email protected]
Abstract
Leaf is a sensitive plant organ in responding to abiotic stresses, especially drought stress. Objective of this research was to evaluate changes of relative leaf expansion rate (RLER) and other leaf-related indicators as affected by gradual drought stress. The stress was
induced by withholding water supply to chili pepper (Capsicum annum L.) for up to 12 days. Afterward, the crops were allowed to
recover. The research was conducted in two stages. The first stage was for finding a reliable leaf area (LA) estimation model. The second stage was for evaluating relevance of RLER, specific leaf fresh weight (SLFW), specific leaf water content (SLWC), and total leaf area (TLA) as indicators for drought stress in chili pepper. Combinations of five regression models (linear, zero-intercept linear, quadratic, zero-intercept quadratic, and power) and three predictors, i.e. leaf length (L), leaf width (W), and LW were evaluated as
candidates of LA estimation model. Selection of the models was based on coefficient of determination (R2) and geometrical
principles. The selected model was used for calculating RLER, SLFW, SLWC and TLA. Results of this study indicated that dynamic changes of RLER were mainly driven by daily day-night cycle rather than long-term gradual drought stress. SLFW and SLWC did not significantly decrease during drought stress period. However, drought stress significantly inhibited TLA in chili pepper. Chili pepper was able to recover from short-term (4 days) exposure to drought stress; yet, this crop was unable to recover after 8 days exposure to drought stress or longer.
Keywords: climate change; dry season; estimation model; growth analysis; riparian wetland; stress indicator; stress recovery; total leaf area; tropical vegetable; water deficit.
Abbreviations: DAT_days after treatment initiation; DBT_days before treatment; L_leaf length; LA_leaf area; LDW_leaf dry
weight; LER_leaf expansion rate; LFW_leaf fresh weight; LW_length x width; R2_coefficient of determination; RLER_relative leaf
expansion rate; SLA_specific leaf area; SLFW_specific leaf fresh weight; SLW_specific leaf weight; SLWC_specific leaf water
content; TLA_total leaf area; W_leaf width.
Introduction
Drought stress in plants is occurred once soil water availability decreased while atmospheric conditions enhanced water loss through transpiration and evaporation processes (Sankar et al., 2014). However, each plant exhibits different sensitivity and mechanism to cope drought condition during their life cycle. Jovanonic and Stikic (2012) found that flowering and fruiting were the most sensitive developmental stages of plant exposed to drought stress, including in chili pepper.
Morphological (shape and size) and physiological (metabolism) alterations of leaf were strongly associated with
plant respond to drought condition (Simova-Stoilova et al.,
2016). However, different plants might have different
mechanisms in coping drought stress, including decline of stomatal conductance, increase in abscisic acid production (Sankar et al., 2016), and enhancement of prolin accumulation (Ammar et al., 2015). Abiotic stress factor related to water availability most often caused abnormality of plant growth and, furthermore, affected yield (Singh and Bainsla, 2014).
Amongst plant organs, leaf exhibits the most sensitive response to drought stress. Therefore, it could be used as an indicator in analyzing plant growth and development during limited water availability (Liu et al., 2010; Tomás et al., 2012). Leaf sensitivity to water shortage condition was due to its direct association and interaction with the surrounding environment, i.e., light capture, gas exchange, and thermoregulation (Chitwood and Sinha, 2016). Leaf played important role in transpiration process for maintaining cell
turgidity, temperature, and controlling mechanistic
movements, including opening and closing of stomata and leaf folding as initial symptoms of stress (Riboldi et al., 2016)
Response of sensitive leaf to soil drying condition is expressed in deceleration of its expansion rate. This can be a very useful indicator in evaluating impact of drought stress on plant growth and development. Limited water availability in a long term severely decreased leaf area (LA), which in turn, restrained plant growth and reduced yield (Manandhar
1618
et al., 2017). Total leaf area per plant (TLA) can be used as an indicator of plant growth.Continuous measurement of LA is necessary for monitor leaf development during drought condition. Procedure for continuous and non-destructive LA estimation based on allometric measurements had been developed (Lakitan et al., 2017). Most of LA estimation models were purely empirical, adopting many kinds of regression models and using direct measurements of leaf length (L), leaf width (W), and any possible combinations of L and W as predictors (Khan et al., 2015; Ogoke et al., 2015). The pure empirical approach is
completely depend on coefficient of determination (R2) for
their recommended LA estimation model. Regression models commonly used in LA estimation are linear, polynomial, and power. Leaf growth is actually three dimensional, but increase in thickness is insignificant for most of species, except for succulent plants, compared to increases in L and W. Therefore, for LA estimation, leaf growth is treated as two-dimensional growth. Based on this two-dimensional leaf growth and to incorporate geometrical principle, Lakitan (1989) recommended zero-intercept linear regression using LW as predictor for LA estimation.
LA was considered as one of the most frequently used parameter in plant growth analysis due to its direct association with photosynthesis, respiration, and transpiration processes (Cho et al., 2007; Breure, 2010; Mokhtarpour et al., 2010; Pandey and Singh, 2011; Keramatlou et al., 2015).
Moreover, the continuous LA measurement on daily basis can be used for calculating RLER in monitoring intensity and dynamic of stress during drought period. RLER measurement requires use of the same leaves during a specified period without detaching the leaves off the plant. It was more appropriate to apply indirect method using allometric measurements of L and/or W than direct method which was depending on instrument availability and requiring detachment of all measured leaves (Peksen, 2007). Moreover, L and W were easy to measure in the field, green house, and pot experiment (Fascella et al., 2013).
Significance of LA data in plant growth analysis is very clear. LA data are required for many significant and frequently used parameters in growth analysis, i.e. specific leaf weight (SLW), net assimilation rate (NAR), and specific leaf area (SLA) (Hossain et al., 2014; Guendouz et al., 2016), in addition to RLER, SLFW, SLWC, and TLA.
Even though SLW in plant growth analysis is mostly calculated based on dry weight, it can also be calculated based on fresh weight (SLFW) or at maximum leaf turgidity level. The SLFW is useful in comparing severity of drought stress among plants subjected to different treatments, among different crops, or for monitoring stress progression over time.
In long term exposure to drought stress, decrease in SLA was reported in vegetable amaranth (Liu and Stützel, 2004); thus, specific leaf weight SLW increased. Moreover, drought induced a more conservative balance between water-losing (leaves) and water-obtaining organs (roots). However, in short term, dynamics of SLFW on a daily basis would be predominantly due to changes in leaf water content. Therefore, we can use changes in SLFW for detecting early symptom of drought stress in plants.
The main objective of this research was to evaluate changes of RLER and other leaf-related indicators (SLFW, SLWC, and TLA) as affected by gradual drought stress, induced by
withholding water supply in chili pepper (Capsicum annuum
L) for up to 12 days. Additionally, ability of the crops to recover after experiencing 4, 8, and 12 days of drought stress was also assessed.
Results
Reliable model for non-destructively estimating leaf area
Combinations of five regression models (linear, zero-intercept linear, quadratic, zero-zero-intercept quadratic, and power regressions) and three predictors (L, W, and LW) were
evaluated for estimating LA in chili pepper (Capsicum
annuum L.). Each of 15 combinations was highly reliable
(R2 > 0.95), except for four combinations of linear and
zero-intercept linear models with L or W as predictor (Table 1). In case of only single linear measurement of either L or W was used as predictor, quadratic and power regression models
showed better R2 values than linear regression models did
(Table 1). Forcing intercept to zero in the linear model worsened reliability in estimating LA if L or W was
individually used as predictor. The R2 values decreased from
0.9336 to 0.7743 or from 0.9430 to 0.8267, if the intercept was forced to zero for L or W was used as predictor, respectively.
The R2 values were higher for each model if LW was used
as predictor, instead of L or W. Nonetheless, if LW was used
as predictor, the 𝛿 values of quadratic and zero-intercept
quadratic model were insignificant, i.e. 0.0003 and 0.0004, respectively (Table 1). These findings indicate that contribution of quadratic factors in both models were immaterial. Therefore, if LW was used as predictor, linear regression model was appropriate for estimating LA, i.e., the
R2 values were 0.9830 and 0.9827 for linear and
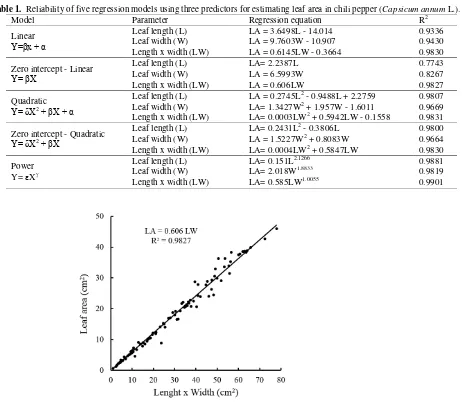
zero-intercept linear regression models, respectively. Figure 1 visualizes that LW is a very reliable LA predictor using zero-intercept linear regression model for the full range of leaf size in chili pepper. More than 98 percent of variation in LA is associated with LW.
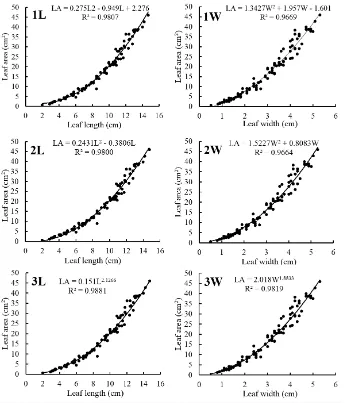
As expected, if single leaf linear measurement of L or W
was used as predictor, non-linear models showed higher R2
value than linear models did. Each of quadratic, zero intercept quadratic and power regression models was reliable for LA estimation (Figure 2).
RLER during drought stress and recovery period
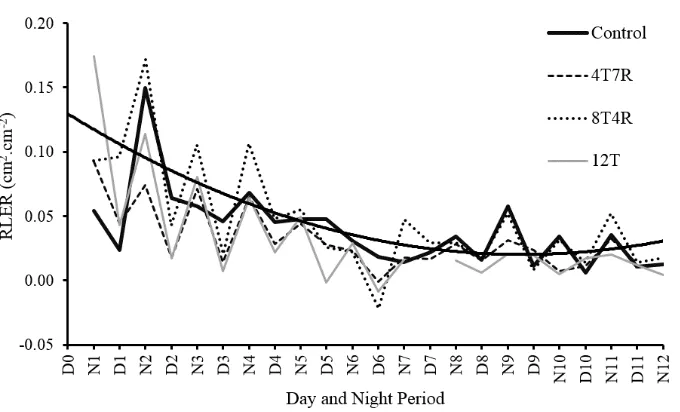
Continuous and non-destructive RLER measurements based on the same set of leaves were made possible due to availability of reliable LA estimation model. Knowing that leaf of chili pepper almost completely stop expanding after 2 weeks, the RLER study was designed within a 12-day time interval. For every 24-hour cycles, RLER was divided into day (diurnal) and night (nocturnal) period. Result of RLER calculations for night and day period, during the 12-day time interval, and for each water stress treatment was presented in Figure 3.
Further analysis indicated that there were declining trend of RLER thru time for the period of 12-day observation, significantly different between diurnal and nocturnal RLER, and variability of RLER as affected by water stress treatments (Table 2). Based on daily measurements, the RLER can be divided into two phases: (1) dynamic change of diurnal-nocturnal RLER during the first 5 days, and (2) followed by relatively smooth declining of RLER.
SLFW, SLWC, and TLA as stress indicators
1619
Table 1. Reliability of five regression models using three predictors for estimating leaf area in chili pepper (Capsicum annum L.).
Model Parameter Regression equation R2
Linear
Y=βx + α
Leaf length (L) LA = 3.6498L - 14.014 0.9336
Leaf width (W) LA = 9.7603W - 10.907 0.9430
Length x width (LW) LA = 0.6145LW - 0.3664 0.9830
Zero intercept - Linear
Y= βX
Leaf length (L) LA= 2.2387L 0.7743
Leaf width (W) LA = 6.5993W 0.8267
Length x width (LW) LA = 0.606LW 0.9827
Quadratic
Y= δX2+ βX + α
Leaf length (L) LA = 0.2745L2 - 0.9488L + 2.2759 0.9807
Leaf width (W) LA= 1.3427W2 + 1.957W - 1.6011 0.9669
Length x width (LW) LA= 0.0003LW2 + 0.5942LW - 0.1558 0.9831
Zero intercept - Quadratic
Y= δX2+ βX
Leaf length (L) LA= 0.2431L2 - 0.3806L 0.9800
Leaf width (W) LA = 1.5227W2 + 0.8083W 0.9664
Length x width (LW) LA= 0.0004LW2 + 0.5847LW 0.9830
Power
Y= X
Leaf length (L) LA= 0.151L2.1266 0.9881
Leaf width (W) LA= 2.018W1.8833 0.9819
Length x width (LW) LA= 0.585LW1.0055 0.9901
Fig 1. Reliability of LW as predictor of LA at a full range leaf size variation using zero-intercept linear regression model in chili pepper
Table 2. RLER monitored during 11 days of treatment, compared between day and night time, and as affected by duration of water stress treatments in chili pepper.
Day after
treatment
RLER
(mm2.cm-2) Daily Cycle RLER (mm2.cm-2) Water treatment stress RLER (mm2.cm-2)
1 10.016 a Nocturnal 5.068 a Control 4.403 b
2 4.766 cd Diurnal 2.682 b 4T7R 3.080 c
3 5.469 bc 8T4R 5.386 a
4 6.219 b 12T 2.631 c
5 3.891 de
6 1.188 h
7 2.266 fgh
8 1.844 fgh
9 3.020 ef
10 1.422 gh
11 2.532 fg
ANOVA : F-value
Day after treatment 30.34**
Daily cycle 68.83**
Water stress treatment 19.12**
1620
Fig 2. Quadratic (1), zero-intercept quadratic (2), and power (3) regression models were reliable for estimating LA in chili pepper (Capsicum annum L.) using single measurement of leaf length (L) or leaf width (W) as predictor.
Table 3. SLFW, SLWC, and TLA prior to, during, and after drought stress for treated and control plant in chili pepper. Time of
measurement*
Drought stress related parameter
SLFW (mg/cm2) SLWC (mg/cm2) TLA (cm2/plant)
5 DBT 21.82 ± 2.92 17.76 ± 2.71 89.30 ± 1.94
D0 26.41 ± 3.74 23.12 ± 3.50 161. 59 ± 3.51
Control at 4DAT 29.08 ± 2.78 24.98 ± 2.57 587.27 ± 5.57
4DAT 23.35 ± 3.52 20.18 ± 3.13 408.52 ± 4.03
4DAT+7R 27.74 ± 3.01 23.32 ± 2.50 1605.52 ± 7.33
Control at 8DAT 26.32 ± 3.54 22.49 ± 3.25 989.39 ± 12.89
8DAT 31.76 ± 12.64 26.34 ± 10.33 510.27 ± 11.73
8DAT+7R 34.54 ± 15.91 29.38 ± 13.92 371.19 ± 6.55
Control at 12DAT 26.74 ± 2.52 22.82 ± 2.29 4030.00 ± 8.48
12DAT 26.29 ± 2.11 22.74 ± 1.83 531.18 ± 6.11
12DAT+7R 29.72 ± 2.89 24.82 ± 2.74 450.37 ± 5.80
1621
Fig 3. Relative Leaf Expansion Rate (RLER) under drought stress in chili pepper. Control = without drought stress treatment; 4T7R = 4 days of treatment + 7 days of recovery; 8T4R = 8 days of treatment + 4 days of recovery; 12T = 12 days of treatment. N = nocturnal RLER and D = diurnal RLER. Curvy solid thick line is trend line of RLER during the 12-day period.
Fig 4. Map of total leaf area (TLA) showing that chili peppers were able to recover after 4 days of drought stress (4DAT+7R) but those experienced 8 days (8DAT+7R) or longer (12DAT+7R) were not.
than 80 percent of leaf fresh weight is contributed by water; therefore, dynamics of leaf water content should be closely related to leaf fresh weight. At whole plant level, TLA is commonly associated with soil water condition. SLFW, SLWC, and TLA prior to, during stress treatment, and recovery period are presented in Table 3.
Discussion
Selection for the most reliable LA estimation model
Leaf is sensitive to changes in water content for most of non-succulent plants, and to certain degree, it can be morphologically recognizable, i.e. varying from fully turgid leaves to extremely wilt, crippled, or rolling leaves. Turgid leaf is due to high internal hydraulic pressure. This pressure
will drive cells to enlarge (Kalve et al., 2014). Collective enlargement of the leaf cells causes leaf expansion. For measuring leaf expansion rate, it requires at least two consecutive LA measurements on the same leaf. Therefore, procedure of LA measurement shall not be destructive.
LA estimation models can be developed based on allometric measurements of L, W, or calculated LW. Reliability of the LA estimation models is higher for single and regular shape leaves, such as lanceolate leaf of chili pepper with flat surface and smooth edge, than irregular and more complicated shape and/or compound leaf. This was confirmed by Machado et al. (2014) who experiencing difficulty in obtaining accurate linear measurements of L and W in melon leaf due to the cordiform shape and jagged edge
1622
were significantly high (R2 > 0.95) in each of LA estimation
models applied to chili pepper leaves.
As expected, non-linear models (quadratic and power
regression) showed higher R2 value than linear models did
(Table 1), especially if single allometric measurement of L or W was used as predictor (Figure 2). These results were in accordance with works of Souza et al. (2015) and Pompelli et al. (2012). Based on their research in estimating LA of
Vernonia ferruginea, Souza et al. (2015) concluded that single measurement of L and W were less suitable for estimating LA. Pompelli et al. (2012) found that the best
model (with the highest R2 value) for estimation of LA in
Jatropha curcas was non-linear power regression.
Non-linear relationship between single allometric measurement (L or W individually) and LA is explainable, since leaf growth is two dimentional, i.e. elongating L concurrently progressed with widening W. This concurrent two-dimensional growth retains leaves at a relatively fixed shape (Misle et al., 2013). In case of our studied chili pepper, the leaf shape is lanceolate regardless of their sizes. Actually, the leaf growth is three dimensional. Moon and Hake (2011) explained that as the leaf grew, its shape was
determined by growth in three axes, i.e. proximal–distal (for
L), abaxial–adaxial (for thickness) and medial–lateral (for measurements using linear regression for estimating LA in
African eggplant (Solanum macrocarpon). The predictors
comprised of L, W, L2, W2, L×W, L2×W2, 1/L, 1/W, 1/L2,
1/W2, and 1/LW. Based on purely empirical (based on the R2
value) and practicality (single allometric measurement is more practical than two measurements), they recommended
the L2 as predictor for estimating LA in the African eggplant.
Nnebue et al. (2015) made the same recommendation for
roselle (Hibiscus sabdariffa). Based on similar empirical
approach, Khan et al. (2015) recommended LLxLW as predictor for LA estimation using linear or power regression
model in jojoba (Simmondsia chinensis). These purely
empirical models, however, are hard to relate with leaf growth behavior.
The R2 value is generally higher if LW is used as predictor
than L or W individually. For five regression models evaluated, all consistently support the presumption, including the linear models. Linear regression model is reliable for estimating LA of chili pepper if LW is used as predictor as shown in Figure 1. Similar results were reported by Serdar and Demirsoy (2006) in chestnut, Rouphael et al. (2010) in watermelon, Gao et al. (2012) in rose, Córcoles et al. (2015)
in onion, Aminifard et al. (2016) in coneflower, Padrón et al.
(2016) in bell pepper, and Küçükönder et al. (2016) in tomato.
In our study, differences of the R2 value among linear and
non-linear models were relatively tolerable if LW was used as predictor, i.e. 0.9830, 0.9827, 0.9831, 0.9830, and 0.9901 for linear, zero-intercept linear, quadratic, zero-intercept quadratic, and power models, respectively (Table 1); therefore, it provides scientific base for a strong argument to recommend zero-intercept linear regression model of LA=0.606 LW as the simplest, accurate, and geometrically-sound model for estimating LA in chili pepper.
Indicators for diagnosis of drought stress
If a plant is experiencing drought stress, its leaf water content declines, internal hydraulic pressure decreases, cell enlargement gradually decelerates, and at the end, leaf expansion ceases. In most cases, decline in leaf expansion rate as an earlier symptom of drought stress is not visually noticeable. Further increase in level of stress causes leaf to wilt and, at this point, impact of water stress starts to be visible and LA may slightly reduce. Droopy leaf as later symptom of drought stress is clearly visible.
Although, early symptom of drought stress may not be visible, it can be detected by measuring L and W. Based on series of L and W data, RLER can be calculated and used as an early indicator of drought stress in plant. In this study, RLER was measured daily and differentiated between night and daytime period as described in Material and Method section.
RLER was high at early phase (the first five-day period) of leaf development, then gradually decreased, and eventually approached zero (RLER = 0) at end of the 12-day period. Closer look at daily RLER measurements revealed that there were two distinct phases, i.e. (1) very dynamic RLER values
from 10.016 mm2.cm-2 declined to 3.891 mm2.cm-2 during
period of day 1 to 5; and (2) low and more stable RLER
values from 3.020 mm2.cm-2 declined to 1.188 mm2.cm-2
during period of day 6 to 11 (Figure 3).
There were significant differences between nocturnal and diurnal RLER. Nocturnal RLER was almost double the diurnal RLER measured during each daily cycle (Table 2). Kalve et al. (2014) explained that maximum turgidity of leaf at night was due to minimum water loss associated with limited transpiration activity. In contrast, during daytime, water loss will be much higher, induced by environmental factors such as high intensity of solar radiation, high air temperature, and low relative humidity. Öztürk et al. (2015) argued that higher water loss during daytime decreased ability of leaves to maintain turgidity, thus halting leaf expansion. RLER of untreated control was significantly higher than those treated with drought stress for 4 and 12 days; however, it was unclear why RLER of chili pepper treated with 8 days of drought stress was better than that of untreated control (Table 2).
SLW is commonly calculated based on dry weight per unit leaf area. However, specific leaf weight based on fresh weight (SLFW) can be used as indicator for assessing short term drought stress, since variation in SLFW was directly reflect variation in water content of the leaf. Leaf dry weight fraction is not dynamically change in short term period. However, in long term, Guendouz et al. (2016) measured SLW of ten durum wheat cultivars under stressed and non-stressed conditions and found that stress condition lead to reduction of SLW value.
Further, SLWC can also be calculated based on difference between the leaf fresh and dried weight. Both of SLFW and SLWC can be used as indicators for drought stress. In this study, however, SLFW and SLWC did not significantly changed after treated with gradual decrease in soil water content after 4 to 12 days.
1623
plants, respectively (Table 3). Moreover, after each treated plant was allowed to recover, only those treated with 4 days drought stress were able to recover (Figure 4) with significant (293.01 percent) increase in their TLA; while those treated for 8 and 12 days exhibited further decrease in their TLA by 27.26 percent and 15.21 percent for 8 and 12 days treated plants, respectively.For compensating imbalance between water uptake and loss during drought stress period, chili pepper let most of their older and larger leaves fallen. Instead, their maintained smaller young leaves and produced some smaller new leaves. This explained the reduction in TLA. This strategy; however, only worked for overcoming short period (4 days) of drought stress.
Materials and methods
This research was conducted in two stages. The first stage was for developing a reliable LA estimation model. The second stage was for continuously measuring RLER during drought stress treatments and for evaluating SLFW, SLWC, and TLA as indicators for drought stress in chili pepper. LA for calculating RLER, SLFW, SLWC, and TLA was estimated based on recommended LA estimation model.
Developing and screening of LA estimation models.
Chili pepper plants were cultivated at the Integrated Research
Laboratory at the Graduate School (104o43’48”E;
2o59’27”S), Universitas Sriwijaya, Palembang, Indonesia
from June to August 2016. Hybrid variety of CK9856 was used in this study. Seeds were soaked overnight in tap water. Overly-dried, damaged, or wrinkled seeds were discarded. Potentially viable seeds were placed on and covered with wet clothes for inducing seed germination. Two germinated (with visible emerging radicle) seeds were sown in each cell of seedling trays. Seedlings were raised in nursery for four weeks before transplanted into black polyethylene bags, filled with mixed growing media of soil: manure: compost (1:1:1, v/v/v). The formula of growing substrate was similar to that used in seedling preparation. NPK fertilizers were applied as recommended for chili pepper and pesticides were used when early symptom of disease was visible and/or insect pest presence was detected.
Regular-shape leaves were purposively sampled from 3-month old chili pepper plants in order to collect leaves with range of L from smallest unfolded leaf to the largest available leaf. Fresh leaves were immediately scanned after being excised off the plant, then L and W were measured based on the full scale leaf images produced. L was measured along midrib of leaf blade (lamina), from base to tip. W was measured at the widest point of leaf blade, measured in direction perpendicular to the midrib. This protocol was repeated one by one for all sampled leaves.
Type of leaf shape of the studied chili pepper was lanceolate. Leaf surface was flat and leaf edge was smooth. Therefore, an accurate allometric measurement was not difficult to achieve. Two hundred leaves were sampled, orderly listed based on L, and then systematically divided (to ensure equal distribution of leaf length) into two groups, i.e. for developing and for validating the models.
Procedure for model development and validation was according to Lakitan et al. (2017). Regression models evaluated were linear, polynomial, and power; combined with or without enforcing intercept to zero for linear and predictor has stronger geometrical arguments, i.e. (1) if L = 0 or W = 0 then LA must also be zero, and (2) the slope () variation among studied leaf population (Lakitan, 1989).
RLER, SLFW, SLWC, and TLA calculations.
The second stage was conducted at an off-campus research
facility in Jakabaring (104o46’44”E; 3o01’35”S), Palembang,
Sumatera Selatan from January to March 2017. Chili pepper cultivation practices were similar to those for developing LA estimation model, except for drought stress treatments.
Drought treatments were applied at four levels during 12-day period: [1] with no stress treatment, plants were daily watered, and placed outside plastic house so they also received rain water during the 12-day period (Control); [2] the plants were treated for 4 days without watering and placed inside a transparent plastic house, and then allowed to recover for 7 days (4T7R) by treating the plants similar to control plants ; [3] plants were treated for 8 days without watering in the plastic house, then allowed to recover for 7 days (8T7R); and [4] plants were treated for 12 days without watering, then allowed to recover for 7 days (12T7R).
SLFW, SLWC, and TLA were measured at end of recovery period for each treated plants. For comparison, SLFW, SLWC, and TLA of control plants were measured at 0, 4, 8, and 12 DAT. Since leaf growth in chili pepper occurred in less than two week period, therefore, RLER continuous measurements were terminated at 12 DAT.
It was impossible to start measuring L and W for all plants at the same leaf development stage (newly unfolded young leaf) or exactly at similar size; then, the second best option was taken by selecting the smallest unfolded young leaves available on each sampled plant. Measurements of L and W were done on the same set of leaves over the 12-day period, started on the day stress treatment was commenced and terminated at 12 DAT. The 12-day period was chosen since individual chili leaf reached its > 95 percent of maximum size within two weeks after the lamina was unfolded.
Continuous and non-destructive LA data were collected twice daily, i.e. within first half hour after sunrise and last half hour prior to sunset. Availability of these early morning and late afternoon LA data enabled us to calculate diurnal and nocturnal RLER during the 12-day period. LA estimation was calculated using linear zero intercept regression model of LA= LW.
RLER was calculated based on additional LA after a
specified period of time relative to initial leaf area (LAi), i.e.
RLER = (LAi+1 – LAi) / LAi. SLFW is a ratio of leaf fresh
weight (LFW) to LA at specified point of measurement, i.e. SLFW = LFW / LA. SLWC is ratio of absolute water content (WC) to LA at specified point of measurement; and WC is calculated based on difference between LFW and leaf
dry weight (LDW), therefore, SLWC = (LFW – LDW) / LA.
TLA is cumulative total of LA per plant at specified point of measurement.
1624
weight, each of sampled leaves was dried in oven at 80oC for
24 hours for LDW measurement. SLFW, SLWC, and TLA were measured at 5 days before treatment (5DBT); on day the treatment was started (D0); at the end of 4, 8, and 12 days of treatment (4DAT, 8DAT, and 12DAT, respectively); and after 7 days of recovery in each treatments (4DAT+7R, 8DAT+7R, and 12DAT+7R). Map of these measurement points was presented in Figure 4.
Statistical analysis
Regression analysis was used in developing and validating LA estimation model. Five types of regression were selected, i.e. simple linear, intercept linear, quadratic, zero-intercept quadratic, and power regression. Leaves were purposively and systematically selected for covering full spectrum of available leaf size and creating relatively even distribution of leaf size. Average of RLER data at all point of observation were directly plotted in order to present the dynamic of night and day fluctuation of the RLER. For comparing RLER based on day to day observation, between night and day observation, and among water stress treatments, an analysis of variance based on split-split plot design was conducted, followed by mean comparisons based on LSD at p < 0.05. SLFW, SLWC, and TLA data were presented in average and standard of deviation.
Conclusion
Zero-intercept linear regression model using LW as predictor
has strong empirical (R2 = 0.9827) justification, logical
geometrical argument, and obvious practicality for estimating LA in chili pepper. The recommended model is LA=0.606 LW. RLER was appropriate as indicator of drought stress only during the first 5-day period of chili leaf development. TLA was a better indicator for drought stress compared to SLFW, SLWC, or RLER.
Acknowledgement
We would like to express our gratitude to editors of this journal and all anonymous reviewers for their comments and suggestions. We also appreciated our colleagues who had given us constructive notes during internal discussion at the LPPM Universitas Sriwijaya. This work was supported by
the Program PMDSU 2016 (SK
No.326/SP2H/LT/DRPM/IX/2016) and the Program
Penelitian Unggulan Profesi 2017 Universitas Sriwijaya (SK No.0570/UN9/PP/2017).
References
Ammar MH, Anwar F, El‐Harty EH, Migdadi HM, Abdel‐
Khalik SM, Al‐Faifi SA, Alghamdi SS (2015)
Physiological and yield responses of faba bean (Vicia faba
L.) to drought stress in managed and open field environments. Aust J Crop Sci. 201(4): 280-287.
Aminifard MH, Khayyat M, Bayat H (2016) Estimation of
leaf area in coneflower (Echinacea purpurea L.) using
independent variables. J Ornam Plant. 6(4): 245-251.
Breure CJ (2010) Rate of leaf expansion: A criterion for
identifying oil palm (Elaeis guineensis Jacq.) types suitable
for planting at high densities. NJAS Wagen J Life Sc. 57(2): 141-147.
Chitwood DH, Sinha NR (2016) Evolutionary and
environmental forces sculpting leaf development. Curr
Biol. 26(7): R297-R306.
Cho YY, Oh S, Oh MM, Son JE (2007) Estimation of individual leaf area, fresh weight, and dry weight of
hydroponically grown cucumbers (Cucumis sativus L.)
using leaf length, width, and SPAD value. Sci Hortic.111: 330-334.
Córcoles JI, Domínguez A, Moreno MA, Ortega JF, de Juan JA (2015) A non-destructive method for estimating onion leaf area. Irish J Agr Food Res. 54(1): 17-30.
Fascella G, Darwich S, Rouphael Y (2013) Validation of a leaf area prediction model proposed for rose. Chil J Agr Res. 73(1): 73-76.
Gao M, Van der Heijden GWAM, Vos J, Eveleens BA, Marcelis LFM (2012) Estimation of leaf area for large scale phenotyping and modeling of rose genotypes. Sci Hortic. 138: 227-234.
Guendouz A, Semcheddine N, Moumeni L, Hafsi M (2016) The effect of supplementary irrigation on leaf area, specific leaf weight, grain yield and water use efficiency in durum
wheat (Triticum durum Desf.) cultivars. Ekin J.2(1):
82-89.
Hossain, MM, Liu X, Qi X, Lam H, Zhang J (2014) Differences between soybean genotypes in physiological
response to sequential soil drying and rewetting. Crop J.
2(6): 66-380.
Jovanovic Z, Stikic R (2012) Strategies for improving water productivity and quality of agricultural crops in an era of climate change. In: Lee TS (ed) Irrigation system and practices in challenging environments, pp. 77-102. InTech, Croatie.
Kalve S, Fotschki J, Beeckman T, Vissenberg K, Beemster GT (2014) Three-dimensional patterns of cell division and
expansion throughout the development of Arabidopsis
thaliana leaves. J Exp Bot. 65(22): 6385-6397.
Keramatlou I, Sharifani M, Sabouri H, Alizadeh M, Kamkar B (2015) A simple linear model for leaf area estimation in
Persian walnut (Juglans regia L.). Sci Hortic.184: 36-39.
Khan D, Zaki MJ, Abbas SM (2015) Leaf area estimation in
Jojoba (Simmondsia chinensis (Link.) CE Schneider)
seedlings. Int J Biol Biotech. 12(4): 667-674.
Küçükönder H, Boyaci S, Akyüz A (2016) A modeling study with an artificial neural network: developing estimation models for the tomato plant leaf area. Turkish J Agric. 40(2): 203-212.
Lakitan, B (1989) Empirical model for estimating leaf area in
bean (Phaseolus vulgaris L.). Annu Rep Bean Improv
Coop. 32: 19-21.
Lakitan B, Widuri LI, Meihana M (2017). Simplifying procedure for a non-destructive, inexpensive, yet accurate
leaf area estimation in snap bean (Phaseolus vulgaris). J
Appl Hort. 19(1): 15-21.
Liu F, Stützel H (2004) Biomass partitioning, specific leaf area, and water use efficiency of vegetable amaranth (Amaranthus spp.) in response to drought stress. Sci Hortic.
102(1): 15-27.
Liu M, Liu X, Li M, Fang M, Chi W (2010) Neural-network model for estimating leaf chlorophyll concentration in rice under stress from heavy metals using four spectral indices. Biosyst Eng. 106(3): 223-233.
Machado RAF, Zanuzo MR, Vieira CV, Boeno RS (2014) Mathematical models to estimate leaf area of melon plant
cultivar Hale’s Best Jumbo at different phenological stages
using linear measurements. Sci Electron Arch. 7(2): 32-38. Manandhar A, Sinclair T.R, Rufty TW, Ghanem ME (2017).
1625
Misle E, Kahlaoui B, Hachicha M, Alvarado P (2013) Leafarea estimation in muskmelon by allometry.
Photosynthetica. 51(4): 613-620.
Mokhtarpour H, The CB, Saleh G, Selamat AB, Asadi ME, Kamkar B (2010) Non-destructive estimation of maize leaf area, fresh weight, and dry weight using leaf length and leaf width. Commun Biometry Crop Sci. 5(1):19-26 . Moon J, Hake S (2011) How a leaf gets its shape. Curr Opin
Plant Biol. 14(1): 24-30.
Nnebue OM, Ogoke IJ, Obilo OP (2015) Leaf area
determination in Roselle (Hibiscus sabdariffa L.) using
linear measurements. Int J Sci Environ Tech. 4(2): 407-413.
Ogoke IJ, Ike GA, Echereobia CO, Ngwuta AA (2015) Non–
destructive leaf area determination in African eggplant (Solanum macrocarpon). Agrosearch. 15(2): 13-20.
Öztürk M, Bolat I, Ergün A (2015) Influence of air–soil
temperature on leaf expansion and LAI of Carpinus betulus
trees in a temperate urban forest patch. Agr ForestMeteorol. 200: 185-191.
Padrón RAR, Lopes SJ, Swarowsky A, Cerquera RR, Nogueira CU, Maffei M (2016) Non-destructive models to estimate leaf area on bell pepper crop. Ciência Rural. 46(11): 1938-1944.
Pandey SK, Singh H (2011) A simple, cost-effective method for leaf area estimation. J Bot. 2011: 1-6.
Peksen E (2007) Non-destructive leaf area estimation model
for faba bean (Vicia faba L.). Sci Hortic. 113(4): 322-328.
Pompelli MF, Antunes WC, Ferreira DTRG, Cavalcante PGS, Wanderley-Filho HCL, Endres L (2012) Allometric
models for non-destructive leaf area estimation of Jatropha
curcas. Biomass Bioenerg. 36: 77-85.
Riboldi LB, Oliveira RF, Angelocci LR (2016). Leaf turgor pressure in maize plants under water stress. Aust J Crop Sci. 10(6): 878.
Rouphael Y, Mouneimne AH, Rivera CM, Cardarelli M, Marucci A, Colla G (2010) Allometric models for non-destructive leaf area estimation in grafted and ungrafted
watermelon (Citrullus lanatus Thunb.) J Food Agric
Environ. 8(1): 161-165.
Sankar B, Gopinathan P, Karthishwaran K, Somasundaram R (2016) Variation in growth of peanut plants under drought stress condition and in combination with paclobutrazol and ABA. Curr Bot. 5: 14-21.
Simova-Stoilova L, Vassileva V, Feller U (2016) Selection and breeding of suitable crop genotypes for drought and heat periods in a changing climate: Which morphological and physiological properties should be considered? Agriculture. 6(2):26.
Singh S, Bainsla NK (2014) Breeding strategies for climate resilient vegetable production in tropical islands conditions. Curr Opin Agric. 3(1):14-21.
Serdar Ü, Demirsoy H (2006) Non-destructive leaf area estimation in chestnut. Sci Hortic. 108(2): 227-230. Souza MC, do Amaral CL, Habermann G, Alves PLDCA, da
Costa FB (2015) Non-destructive linear model for leaf area
estimation in Vernonia ferruginea L.
Braz J Biol. 38(4): 903-909.
Tomás M, Medrano H, Pou A, Escalona JM, Martorell S,
Ribas‐Carbó M, Flexas J (2012) Water‐use efficiency in
grapevine cultivars grown under controlled conditions:
effects of water stress at the leaf and whole‐plant level.