Getting Analytics Right
Answering Business Questions with More Data in Less TimeGetting Analytics Right
by Nidhi Aggarwal, Byron Berk, Gideon Goldin, Matt Holzapfel, and Eliot Knudsen
Copyright © 2016 Tamr, Inc. All rights reserved. Printed in the United States of America.
Published by O’Reilly Media, Inc., 1005 Gravenstein Highway North, Sebastopol, CA 95472.
O’Reilly books may be purchased for educational, business, or sales promotional use. Online editions are also available for most titles (http://safaribooksonline.com). For more information, contact our corporate/institutional sales department: 800-998-9938 or
[email protected]. Editor: Shannon Cutt
Interior Designer: David Futato
Revision History for the First Edition
2016-03-16: First Release
2016-04-15: Second Release
The O’Reilly logo is a registered trademark of O’Reilly Media, Inc. Getting Analytics Right and related trade dress are trademarks of O’Reilly Media, Inc. While the publisher and the authors have used good faith efforts to ensure that the information and instructions contained in this work are accurate, the publisher and the authors disclaim all responsibility for errors or omissions, including without limitation responsibility for damages resulting from the use of or reliance on this work. Use of the information and instructions contained in this work is at your own risk. If any code samples or other technology this work contains or describes is subject to open source licenses or the
intellectual property rights of others, it is your responsibility to ensure that your use thereof complies with such licenses and/or rights.
Introduction
Nidhi Aggarwal
“Getting Analytics Right” is, admittedly, a big promise in the big data era. But given all of the opportunity and value at stake, how can we aspire to anything less? Getting analytics right is especially important considering the kinds of simple-to-ask yet difficult-to-answer questions that linger within today’s enterprises. On the one hand, there are customer data questions like: “Which customer segments have the highest loyalty rates?” or “Which of my sales prospects is most likely to convert to a customer?” On the other hand are sourcing questions like: “Are we getting the best possible price and terms for everything we buy?” and “What’s our total spend for each supplier
across all business units?”
With the kind of internal and external data now available to enterprises, these questions seem eminently answerable through a process as simple and logical as:
1. Ask the question
2. Define the analytic
3. Locate, organize, and analyze the data
4. Answer the question
5. Repeat
Except that the process rarely goes that way.
many urgent questions to answer with analytics every day, are so many companies still falling short of becoming truly data-driven?
Analytics Projects Often Start in the Wrong
Place
Many analytics projects often start with a look at some primary data sources and an inference about what kinds of insights they can provide. In other
words, they take the available sources as a constraint, and then go from there. As an example, let’s take the sourcing price and terms question mentioned earlier: “Are we getting the best possible price and terms for everything we buy?” A procurement analyst may only have easy access to audited data at the “head” of the tail — e.g., from the enterprise’s largest suppliers. The problem is, price/variance may in fact be driven by smaller suppliers in the long tail.
Running a spend analytics project like this skips a crucial step. Analysis must start with the business questions you’re trying to answer and then move into the data. Leading with your data necessarily limits the number and type of problems you can solve to the data you perceive to be available. Stepping back and leading with your questions, however, in this question first
Analytics Projects End Too Soon
Through software, services, or a combination of both — most analytics projects can arrive at answers to the questions your team is asking. The procurement analyst may indeed be able to gather and cobble together enough long-tail data to optimize spend in one category, but a successful analytics project shouldn’t stop with the delivery of its specific answers. A successful analytics project should build a framework for answering repeated questions — in this case, spend optimization across all categories. For all the software and services money they’re spending, businesses should expect every analytics project to arm them with the knowledge and infrastructure to ask, analyze, and answer future questions with more efficiency and
Analytics Projects Take Too Long…and Still
Fall Short
Despite improved methods and technologies, many analytics projects still get gummed up in complex data preparation, cleaning, and integration efforts. Conventional industry wisdom holds that 80% of analytics time is spent on preparing the data, and only 20% is actually spent analyzing data. In the big data era, wisdom’s hold feels tighter than ever. Massive reserves of enterprise data are scattered across variable formats and hundreds of disparate silos. Consider, in our spend analysis example, the many hundreds or thousands of supplier sources that could be scattered throughout a multinational
Human-Machine Analytics Solutions
So what can businesses do when they are awash in data and have the tools to analyze it, but are continuously frustrated by incomplete, late, or useless answers to critical business questions?
We can create human-machine analytics solutions designed specifically to get businesses more and better answers, faster, and continuously. Fortunately, a range of analytics solutions are emerging to give businesses some real
options. These solutions should feature:
1. Speed/Quantity — Get more answers faster, by spending less time preparing data and more time analyzing it.
2. Quality — Get better answers to questions, by finding and using more relevant data in analysis — not just what’s most obvious or familiar.
3. Repeatability — Answer questions continuously, by leaving customers with a reusable analytic infrastructure.
Data preparation platforms from the likes of Informatica, OpenRefine, and
Tamr have evolved over the last few years, becoming faster, nimbler, and more lightweight than traditional ETL and MDM solutions. These automated platforms help businesses embrace — not avoid — data variety, by quickly pulling data from many more sources than was historically possible. As a result, businesses get faster and better answers to their questions, since so much valuable information resides in “long-tail” data. To ensure both speed and quality of preparation and analysis, we need solutions that pair machine-driven platforms for discovering, organizing, and unifying long-tail data with the advice of business domain and data science experts.
challenge for enterprises in the big data era, as IDC estimates that 90% of big data is “dark data” — data that has been processed and stored but is hard to find and rarely used for analytics. This is an enormous opportunity for tech companies to build software that quickly and easily locates and inventories all data that exists in the enterprise, and is relevant for analysis — regardless of type, platform, or source.
Finally, we need to build persistent and reusable data engineering
infrastructures that allow businesses to answer questions continuously, even as new data sources are added, and as data changes. A business can do
everything right — from starting with the question, to identifying and
Question-First, Data-Second Approach
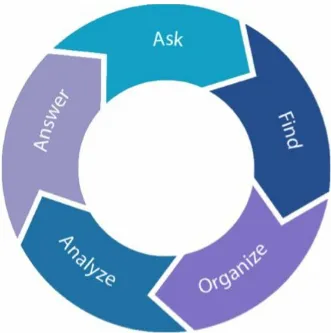
With the help of a question-first, data-second approach, fueled by cataloging and preparation software, businesses can create a “virtuous analytics cycle” that produces more and better answers faster and continuously (Figure P-1).
Figure P-1. The question-first, data-second approach (image credit: Jason Bailey)
In the question-first, data-second approach, users:
Ask the question to be answered and identify the analytics needed to answer it, e.g.,
Question: Am I getting the best price for every widget I buy?
Find all relevant data available to answer the question
Catalog data for thousands of widget suppliers across dozens of internal divisions/BUs.
Enrich with external sources like Dun & Bradstreet. Organize the data for analysis, with speed and accuracy
Use data preparation software to automate deduplication across all suppliers and unify schema.
Analyze the organized data through a combination of automation and expert guidance
Run the unified data through a tool like Tableau — in this case a visual analysis that identifies opportunities to bundle widget spend across BUs.
Identify suppliers for negotiation and negotiate potential savings. Answer questions continuously, through infrastructures that are reusable — even as the data changes
Run the same analytics for other widget categories–or even the same category as the data and sources change.
Chapter 1. Visualize Data
Analytics
Introduction
Let’s begin by imagining that you are an auto manufacturer, and you want to be sure you are getting a good deal when it comes to buying the parts you need to build your cars. Doing this means you need to run some analyses over the data you have about spend with your suppliers; this data includes
invoices, receipts, contracts, individual transactions, industry reports, etc. You may learn, for example, that you are purchasing the same steel from multiple suppliers, one of which happens to be both the least expensive and the most reliable. With this newfound knowledge, you engage in some negotiations around your supply chain, saving a substantial amount of money.
As appealing as this vignette might sound in theory, practitioners may be skeptical. How do you discover and explore, let alone unify, an array of heterogeneous datasets? How do you solicit dozens or hundreds of experts’ opinions to clean your data and inform your algorithms? How do you
visualize patterns that may change quarter-to-quarter, or even second-to-second? How do you foster communication and transparency around siloed research initiatives? Traditional data management systems, social processes, and the user interfaces that abstract them become less useful as you collect more and more data [21], while latent opportunity may grow exponentially. Organizations need better ways to reason about such data.
Many of these problems have motivated the field of Visual Analytics (VA) — the science of analytical reasoning facilitated by interactive visual
interfaces [1]. The objective of this chapter is to provide a brief review of VA’s underpinnings, including data management & analysis, visualization, and interaction, before highlighting the ways in which a data-centric
Defining Visual Analytics
Where humans reason slowly and effortfully, computers are quick; where computers lack intuition and creativity, humans are productive. Though this dichotomy is oversimplified, the details therein inspire the core of VA. Visual analytics employs a combination of technologies, some human, some human-made, to enable more powerful computation. As Keim et al. explain in
Mastering the information age-solving problems with visual analytics, VA integrates “the best of both sides.” Visual analytics integrates scientific disciplines to optimize the division of cognitive labor between human and machine [7].
The need for visual analytics is not entirely new; a decade has now passed since the U.S. solicited leaders from academia, industry, and government to set an initial agenda for the field. This effort, sponsored by the Department of Homeland Security and led by the newly chartered National Visualization and Analytics Center, was motivated in part by a growing need to better utilize the enormous and enormously disparate stores of data that
governments had been amassing for so long [1]. While the focus of this agenda was post-9/11 security,1 similar organizations (like the European VisMaster CA) share many of its goals [3]. Today, applications for VA abound, spanning beyond national security to quantified self [5], digital art
[2], and of course, business intelligence.
Keim et al. go on to expand on Thomas and Cook’s definition from Illuminating the path: The research and development agenda for visual analytics [1] — citing several goals in the process:
Synthesize information and derive insight from massive, dynamic, ambiguous, and often conflicting data
Detect the expected and discover the unexpected
Provide timely, defensible, and understandable assessments
These are broad goals that eventuate a particularly multidisciplinary
approach; the following are just some of the fields involved in the scope of visual analytics [11]:
Information analytics
Geospatial analytics
Scientific & statistical analytics
Knowledge discovery
Data management & knowledge representation
Presentation, production & dissemination
Cognitive & perceptual science
Role of Data Management and Analysis
While traditional database research has focused on homogeneous, structured data, today’s research looks to solve problems like unification across
disparate, heterogeneous sources (e.g., streaming sensors, HTML, log files, relational databases, etc.) [7].
Returning to our auto manufacturing example, this means our analyses need to integrate across a diverse set of sources — an effort that, as Michael Stonebraker [38] notes in Getting Data Right, is necessarily involved — requiring that we ingest the data, clean errors, transform attributes, match schemas, and remove duplicates.
Even with a small number of sources, doing this manually is slow, expensive, and prone to error. To scale, one must make use of statistics and machine learning to do as much of the work as possible, while keeping humans in the loop only for guidance (e.g., helping to align cryptic coding schemas).
Managing and analyzing these kinds of data cannot be done in isolation; the task is multifaceted and often requires collaboration and visualization;
meanwhile, visualization requires curated or prepared data. Ultimately, we need interactive systems with interfaces that support seamless data
Role of Data Visualization
Before elucidating the visual component of VA, it is helpful to define visualization. In information technology, visualization usually refers to something like that defined by Card et al. in Readings in information visualization: “the use of computer-supported, interactive visual representations of data to amplify cognition” [24].
Visualization is powerful because it fuels the human sense with the highest bandwidth: vision (300 Mb/s [28]). Roughly 20 billion of our brain’s neurons are devoted to visual analysis, more than any other sense [28], and cognitive science commonly refers to vision as a foundational representation in the human mind. Because of this, visualization is bound to play a critical role in any data-heavy context — in fact, the proliferation of data is what helped to popularize visualization.2
Today, data visualization (DataVis) serves two major categories of data: scientific measurements and abstract information.
Scientific Visualization
Scientific Visualization (SciVis) is typically concerned with the
representation of physical phenomena, often 3D geometries or fields that span space and time [7]. The purpose of these visualizations is often exploratory in nature, ranging across a wide variety of topics — whether investigating the complex relationships in a rat brain or a supernova
[27].
Information Visualization
Information Visualization (InfoVis), on the other hand, is useful when no explicit spatial references are provided [28]. These are often the bar graphs and scatter plots on the screens of visual analysts in finance, healthcare, media, etc. These diagrams offer numerous benefits, one of which is taking advantage of visual pattern recognition to aid in model finding during exploratory data analysis.
technologies. As datasets grow larger faster, the corporations that have augmented their database management systems with information
visualization have been better-enabled to utilize their increasingly valuable assets.3 It can be said that VA does for data analysis what InfoVis did for databases [7].
While InfoVis may lay the foundation for VA, its scope falls far outside this book. Worth noting, however, is the challenge of visualizing “big data.” Many of today’s visualizations are born of multidimensional datasets (with hundreds or thousands of variables with different scales of measurement), where traditional or static, out-of-the-box diagrams do not suffice [7]. Research here constitutes a relatively new field that is constantly extending existing visualizations (e.g., parallel coordinates [30], treemaps [29], etc.), inventing new ones, and devising methods for interactive querying over
Role of Interaction
Visual analytics is informed by technical achievements not just in data
management, analysis, and visualization, but also in interface design. If VA is to unlock the opportunity behind information overload, then thoughtful
interaction is key.
In addition to the DataVis vs. SciVis distinction, there is sometimes a line drawn between exploratory and explanatory (or expository) visualization, though it grows more blurred with time. Traditionally, exploratory DataVis is done by people that rely on vision to perform hypothesis generation and confirmation, while explanatory DataVis comprises summaries over such analyses. Though both exercises are conducted by individuals, only the latter has a fundamentally social component — it generates an artifact to be shared. VA is intimately tied with exploratory visualization, as it must facilitate
reasoning (which is greatly enhanced by interaction). Causal reasoning, for example, describes how we predict effects from causes (e.g., forecasting a burst from a financial bubble) or how we infer causes from effects (e.g., diagnosing an epidemic from shared symptomologies). By interacting, or intervening, we are able to observe not just the passive world, but also the consequences of our actions. If I observe the grass to be wet, I may raise my subjective probability that it has rained. As Pearl [33] notes, though,
observing that the grass is wet after I turn on the sprinklers would not allow me to draw the same inference.
The same is true in software; instead of manipulating the world, we
manipulate a simulation before changing data, models, views, or our minds. In the visual analytics process, data from heterogeneous and disparate sources must somehow be integrated before we can begin visual and automated
analysis methods [3].
Role of Collaboration
Within a business, the exploratory visualization an analyst uses is often the same as the visualization she will present to stakeholders. Explanatory
visualizations, on the other hand, such as those seen in infographics, are often reserved for marketing materials. In both cases, visualization helps people communicate, not just because graphics can be appealing, but because there is seldom a more efficient representation of the information (according to Larkin and Simon, this is “Why a diagram is (sometimes) worth ten thousand words” [25]). Despite the communicative power underpinning both
exploratory and explanatory visualizations, the collaboration in each is confined to activities before and after the production of the visualization. A more capable solution should allow teams of people to conduct visual
analyses together, regardless of spatiotemporal constraints, since modern analytical challenges are far beyond the scope of any single person.
Large and multiscreen environments, like those supported by Jigsaw [14], can help. But in the past decade, an ever-growing need has motivated people to look beyond the office for collaborators — in particular, many of us have turned to the crowd. A traditional view of VA poses the computer as an aid to the human; however, the reverse can sometimes ring more true. When
computer scientist Jim Gray went missing at sea, top scientists worked to point satellites over his presumed area. They then posted photos to Amazon’s crowdsourcing service, Mechanical Turk, in order to distribute visual
processing across more humans. A number of companies have since come to appreciate the power of such collaboration,5 while a number of academic projects, such as CommentSpace [39] and IBM’s pioneering ManyEyes [41], have demonstrated the benefits of asynchronous commenting, tagging, and linking within a VA environment. This is not surprising, as sensemaking is supported by work parallelization, communication, and social organization
Putting It All Together
Today’s most challenging VA applications require a combination of
technologies: high-performance computing and database applications (which sometimes including cloud services for data storage and management) and powerful interactions so analysts can tackle large (e.g., even exabyte) scale datasets [10] — but issues remain. While datasets grow, and while computing resources become more inexpensive, cognitive abilities remain constant. Because of this, it is anticipated that they will bottleneck VA without substantial innovation. For example, systems need to be more thoughtful about how they represent evidence and uncertainty.
Next-generation systems will need to do more. As stated by Kristi Morton in “Support the data enthusiast: Challenges for next-generation data-analysis systems”[22], VA must improve in terms of:
1. combining data visualization and cleaning
2. data enrichment
3. seamless data integration
4. a common formalism
For combining data visualization and cleaning, systems can represent
suggestions around what data is not clean, and what cleaning others may have done. If my software informs me of a suspiciously inexpensive unit-price for steel sheets, I should be able to report the data or fix it without concern of invalidating other analysts’ work.
In seamless data integration, systems should take note of the context of the VA, so they can better pull in related data at the right time; for example, zooming-in on a sub-category of transactions can trigger the system to query data about competing or similar categories, nudging me to contemplate my options.
Finally, a common formalism implies a common semantics — one that
enables data analysts and enthusiasts alike to visually interact with, clean, and augment underlying data.
References
[1] Cook, Kristin A., and James J. Thomas. Illuminating the path: The
research and development agenda for visual analytics. No. PNNL-SA-45230. Pacific Northwest National Laboratory (PNNL), Richland, WA (US), 2005. [2] Viégas, Fernanda B., and Martin Wattenberg. “Artistic data visualization: Beyond visual analytics.” Online Communities and Social Computing.
Springer Berlin Heidelberg, 2007. 182-191.
[3] Keim, Daniel A., et al., eds. Mastering the information age-solving problems with visual analytics. Florian Mansmann, 2010.
[5] Huang, Dandan, et al. “Personal visualization and personal visual
analytics.” Visualization and Computer Graphics, IEEE Transactions on 21.3 (2015): 420-433.
[7] Keim, Daniel, et al. Visual analytics: Definition, process, and challenges. Springer Berlin Heidelberg, 2008.
[10] Wong, Pak Chung, et al. “The top 10 challenges in extreme-scale visual analytics.” IEEE computer graphics and applications 32.4 (2012): 63.
[11] Keim, Daniel, et al. “Challenges in visual data analysis.” Information Visualization, 2006. IV 2006. Tenth International Conference on. IEEE, 2006.
[12] Zhang, Leishi, et al. “Visual analytics for the big data era — A
comparative review of state-of-the-art commercial systems.” Visual Analytics Science and Technology (VAST), 2012 IEEE Conference on. IEEE, 2012. [14] Stasko, John, Carsten Görg, and Zhicheng Liu. “Jigsaw: supporting investigative analysis through interactive visualization.” Information visualization7.2 (2008): 118-132.
[15] Fekete, Jean-Daniel, et al. “The value of information visualization.” Information visualization. Springer Berlin Heidelberg, 2008. 1-18.
[19] Liu, Zhicheng, Biye Jiang, and Jeffrey Heer. “imMens: Real‐time
Blackwell Publishing Ltd, 2013.
[21] Stonebraker, Michael, Sam Madden, and Pradeep Dubey. “Intel big data science and technology center vision and execution plan.” ACM SIGMOD Record 42.1 (2013): 44-49.
[22] Morton, Kristi, et al. “Support the data enthusiast: Challenges for next-generation data-analysis systems.” Proceedings of the VLDB Endowment7.6 (2014): 453-456.
[23] Liu, Zhicheng, and Jeffrey Heer. “The effects of interactive latency on exploratory visual analysis."Visualization and Computer Graphics, IEEE Transactions on 20.12 (2014): 2122-2131.
[24] Card, Stuart K., Jock D. Mackinlay, and Ben Shneiderman. Readings in information visualization: using vision to think. Morgan Kaufmann, 1999. [25] Larkin, Jill H., and Herbert A. Simon. “Why a diagram is (sometimes) worth ten thousand words.” Cognitive science 11.1 (1987): 65-100.
[27] Ma, Kwan-Liu, et al. “Scientific discovery through advanced
visualization.” Journal of Physics: Conference Series. Vol. 16. No. 1. IOP Publishing, 2005.
[28] Ware, Colin. Information visualization: perception for design. Elsevier, 2012.
[29] Shneiderman, Ben. “Tree visualization with tree-maps: 2-d space-filling approach.” ACM Transactions on graphics (TOG) 11.1 (1992): 92-99.
[30] Inselberg, Alfred, and Bernard Dimsdale. “Parallel coordinates: A tool for visualizing multivariate relations.” Human-Machine Interactive
Systems(1991): 199-233.
[31] Stolte, Chris, Diane Tang, and Pat Hanrahan. “Polaris: A system for query, analysis, and visualization of multidimensional relational databases.” Visualization and Computer Graphics, IEEE Transactions on 8.1 (2002): 52-65.
[33] Pearl, Judea. Causality. Cambridge university press, 2009. [34] Nielsen, Jakob. Usability engineering. Elsevier, 1994.
[35] Shneiderman, Ben. “Direct manipulation: A step beyond programming languages.” ACM SIGSOC Bulletin. Vol. 13. No. 2-3. ACM, 1981.
[36] Huber, Peter J. “Massive datasets workshop: Four years after.” Journal of Computational and Graphical Statistics 8.3 (1999): 635-652.
[37] Shneiderman, Ben. “The eyes have it: A task by data type taxonomy for information visualizations."Visual Languages, 1996. Proceedings., IEEE Symposium on. IEEE, 1996.
[38] Stonebraker, Michael. “The Solution: Data Curation at Scale.” Getting Data Right: Tackling the Challenges of Big Data Volume and Variety. Ed. Shannon Cutt. California, 2015. 5-12. Print.
[39] Willett, Wesley, et al. “CommentSpace: structured support for collaborative visual analysis."Proceedings of the SIGCHI conference on Human Factors in Computing Systems. ACM, 2011.
[40] Heer, Jeffrey, and Maneesh Agrawala. “Design considerations for collaborative visual analytics."Information visualization 7.1 (2008): 49-62. [41] Viegas, Fernanda B., et al. “Manyeyes: a site for visualization at internet scale.” Visualization and Computer Graphics, IEEE Transactions on 13.6 (2007): 1121-1128.
The date’s attacks required real-time response at an unprecedented scale.
Only a few decades ago, visualization was unrecognized as a mainstream academic discipline. John Tukey (inventor of the FFT algorithm, box plot, and more) played a key part in its broader
adoption, highlighting its role in data analysis.
During this time, several academic visualization projects set the groundwork for new visualization techniques and tools. One example is Stanford’s Polaris [31];, an extension of pivot tables that enabled interactive, visual exploration of large databases. In 2003, the project was spun into the commercially available Tableau software. A comparison of commercial systems is provided in [12]. Keim emphasizes VA in his modification: “Analyze first, show the important, zoom, filter and analyze further, details on demand” [7].
Tamr, for example, emphasizes collaboration within a VA framework, using machine learning to automate tedious tasks while keeping human experts in the loop for guidance.
1 2
3
4
Chapter 2. Choosing Your Own
Adventure in Analytics
Byron Berk
This book is different from other books.
You and YOU ALONE are in charge of what happens in this story.
There are dangers, choices, adventures, and consequences. YOU must use all of your numerous talents and much of your enormous intelligence. The wrong decision could end in disaster — even death. But, don’t despair. At anytime, YOU can go back and make another choice, alter the path of your story, and change its result.
Excerpt from The Abominable Snowman, by R.A. Montgomery
The quote above is from the first page of The Abominable Snowman, a “Choose Your Own Adventure” book written by R.A. Montgomery. For the uninitiated, after reading a few pages of one of these books, you are
confronted with a new dilemma and offered an opportunity to make a decision. With your decision made, you then turn to a new page
corresponding to your decision, with an adjusted plot line and consequence. After reading a few more pages of the story, you are prompted for another decision. Continue to read, make decisions, and turn to the corresponding page until you reach a unique conclusion to your reading of the book. Next to my Rubik’s Cube, “Choose Your Own Adventure” books remain among my fondest memories of my 3rd grade class in 1980. My classmates and I loved the flexibility of the books and the control our decisions exerted over the stories. Just think of the extra reading mileage these books got, with thousands of kids each reading a book multiple times to explore the impact of their decisions made throughout the story.
Don’t Wait Until the End of the Book to Adjust
Your Course
“Choose Your Own Adventure” plot lines were never set before you opened the cover and turned to the first page. Rather, with each unfolding event, there was a new opportunity to ask new questions, to gather additional data, to learn from mistakes, and to adjust. Stories were dynamic, and the decisions you made along the way influenced the outcome. In fact, you couldn’t simply read the book from cover to cover and let the story unfold. You had to make decisions at appropriate times and change the course of the story.
Similarly, analytics need to guide your business awareness and directly
Adjust Quickly After Making Bad Decisions
In a “Choose Your Own Adventure,” I’d use a finger to keep the place in the book where I made my last decision based on the information available. If the decision somehow ended in disaster, there was no need to start the book over from the beginning; instead, I’d just return to the point of the last decision and make a new decision. Perhaps this was cheating, but I preferred to view it as learning quickly from mistakes. The effects of the decisions were instantly evident, creating an opportunity to avoid similar mistakes as the story
continued.
Iterate to Improve Performance
A “Choose Your Own Adventure” book could have numerous possible story endings. It was easy to read and re-read the book multiple times to obtain a better (or the best) outcome. Competitive classmates could even create competitions to see who could achieve the most successful story outcome in the fewest number of readings.
Analytics are also iterative — we gather data, analyze, and evaluate. Based on the evaluation, we may take action or change a behavior. Then, we repeat the analysis and compare the results with the expected outcome. This
iteration and feedback loop is essential to improving performance.
Beyond just iteration, however, we need to continuously ask ourselves new questions. Toyota, for example, introduced the “5 Whys” interrogative technique. This method of problem solving involved an approach to
iteratively ask and answer questions. By asking 5 questions in succession, one pushes beyond just the symptoms of the problem and makes rapid
progress toward getting to the root cause of the issue. Often, the answer to the fifth question will point to the root cause or broken process that needs to be corrected.
Consider an example in the Procurement space to demonstrate how 5 Whys can work:
1. “Which categories of spending should we invest in managing more effectively”: An initial analysis of ERP systems produces a ranked list of categories with the highest spend for each of a company’s five business divisions. This helps with initial prioritization of efforts across thousands of spend categories.
2. “What are the largest categories of spend if we look across business units”: Several spend categories are rationalized
(combined) across divisions to improve understanding of spend. This helps to prioritize further analysis according to the remaining
3. “Are we receiving the same terms from suppliers across our business units?”: Several suppliers extend varying payment terms to different business divisions. Across several rationalized spend categories, opportunities are identified to negotiate most favorable payment terms.
4. “Do we have the right number of suppliers to support our spend?”: Further analysis uncovers opportunities to consolidate suppliers, increase purchasing power, and further reduce costs.
5. “Of the remaining suppliers, are we diversifying our risks sufficiently?”: Third-party data from Thomson Reuters enriches supplier data within the ERP systems. A risk assessment informs decision making to “right-size"” supplier count to appropriately balance risk and spend concentration across suppliers.
It’s valuable to be able to iterate on the questions, to continuously ask deeper questions about your business or an issue, and in so doing build a more
informed understanding of what processes are driving/influencing your business.
Good analytics infrastructure and tools can facilitate the iteration espoused by the 5 Whys technique. Rather than constructing a rigid, monolithic data
As the Story Progresses, the Data Driving
Your Decisions Will Change
In “Choose Your Own Adventure,” new data could be presented at any time, in any chapter. Ad hoc decisions/analysis would lead to new actionable insights.
In business, you obviously aren’t always confronted with the same questions or challenges. The economic environment will change, and competitors will surely come and go. It therefore behooves businesses to periodically gather more/new data to analyze. The faster you can access and exploit new data, the more competitive you can become in the marketplace.
For example, Custom Automated Prosthetics (CAP-US) is a manufacturer of dental prosthetics and supplier of digital dentistry manufacturing equipment. CAP-US reviewed CRM data to obtain an understanding of customer
interaction — from spend analysis reports across geographies, to comparative reports that can be used to evaluate sales rep performance. This information is useful, but it’s also limited. CAP-US wanted to enrich customer data with information from new sources, enabling deeper and broader analysis of their business data.
CAP-US achieved new insights by enriching their CRM data with data from a third-party provider such as Thomson Reuters or Hoovers. This enrichment enables CAP-US to estimate wallet share — the portion of total spend a
A Book with a Changing Story Gets Read
Multiple Times
With “Choose Your Own Adventure,” it was irresistible to read a book several times in order to see how different decisions impacted the story outcome. Today, more than 35 years after the first book was published, the “Choose Your Own Adventure” formula remains successful, with hundreds of published titles.
In order for businesses to remain successful, they must confront new challenges, competition, and world events that disrupt the economic environment every day. It’s imperative for businesses to continuously diagnose issues, predict business climate change, and exploit new
Chapter 3. Realizing ROI in
Analytics
Eliot Knudsen
“Fast Learners Win” Eric Schmidt
In the past decade, the amount of time and money spent on incorporating analytics into business processes has risen to unprecedented levels. Data-driven decisions that used to be a C-suite luxury (costing a small fortune in consulting) are now expected from every operating executive. Gut feelings and anecdotal cases are no longer acceptable. “In God we trust, everyone else bring data” has become the slogan of a generation.
Large organizations have hundreds of processes, strategic initiatives, and channels — all waiting to be optimized — and increasing business
complexity has only amplified the demand for analytic solutions. But despite the tremendous demand, supply, and investment, there is one major missing link: value. Do you really know whether your analytics are living up to their lofty expectations?
To unpack this, we first have to dive a little deeper into the different tiers of analytics: descriptive, predictive, and prescriptive. Descriptive analytics summarize historical data — these are reports and dashboards. Predictive analytics projects the most likely outcome given future or unlabeled data points — these are recommendations or classifications. Finally, the highest tier is prescriptive analytics, which combine predictions and feedback — measuring accuracy of predictions over time.
One great example of prescriptive analytics is the Amazon product page and shopping cart. At the bottom of each product page there are recommendations of commonly bundled items. These recommendations are predictions of
recommendations. Amazon is embedding prescriptive recommendations into the purchasing process.
That feedback mechanism is the cornerstone of what allows Amazon to measure the “realized ROI” of the predictions: a transaction-level data
The Lifecycle for a Feedback System
Analytics, just like software projects, have a lifecycle of development. You can split these into three categories: (1) data and requirement discovery, (2) feature engineering and modeling, and (3) online learning.
1. Data and Requirement Discovery. When first embarking on an analytics project, there is a period when the business value is known, but finding the associated data to drive insight is unknown.
2. Feature Engineering and Modeling. There is an art to applying the right model and transformations to the dataset and domain.
Generally, the more data, the less you have to rely on obscure concepts like bias/variance trade-off.
3. Feedback. Just completing feature engineering and modeling gives a predictive model, which can be applied to a set of problems.
The Measurements for a Feedback System
Before designing an analytic system, the most important task is to distill success and failure into a measure of accuracy. How will the value of the application be affected by your predictive application? In statistical lingo, the mathematical formula for accuracy is called your “loss function.”
For example, if you recommend a product on Amazon: what is the
implication if you recommend a bad product? How about not recommending the precisely correct product? How about when you recommend the correct product, whether that translates into a larger shopping cart? In this case, like most cases, it depends. Is Amazon trying to help customers save money? Increase their operating margin? Reduce inventory at a fulfillment center? Here success or failure is the business objective with a measurable outcome. The accuracy of the recommendation system should be based on this
objective. There are three common accuracy metrics that combine to make your “loss function”:
1. How many recommendations do you miss?
2. How many recommendations are incorrect?
3. How many recommendations are not acted upon? How many recommendations do you miss?
All predictive algorithms are just that: predictive. They have uncertainty and risk. Do you always want your algorithm to predict an event, even if it doesn’t have a high degree of confidence that your prediction will be correct? That depends on your applications. The loss is: the opportunity cost
associated with not making a recommendation. How many recommendations are incorrect?
many predictions does your algorithm have to get wrong before people to start ignoring it all together? The loss is: the cost associated with making an incorrect recommendation. How many recommendations are not acted upon?
What if you make a prediction and it’s correct. Does this turn into dollars? While at an outcome level, this has the same result as (1), it requires a very different solution. Making good
technology is one thing, but changing human behavior can be a different challenge entirely. The loss is: the opportunity cost associated with not making a recommendation.
One important note is that it’s much easier to get feedback on incorrect recommendations than missed recommendations. Users can find mistakes quickly, describe why they’re incorrect, and the algorithms can adjust accordingly. When algorithms aren’t able to determine a good
The Database for a Feedback System
While building analytical systems, starting from a solid set of components for data movement, storage and modeling can be the difference between a fast or slow iteration cycle. The last 20 years of data warehousing have been
dominated by the idea of a unilateral data flow — out of applications and into a central warehouse. In this model, enterprises have been focused on reducing the latency between when data is captured to movement, and supporting more users with richer queries in the data warehouse. In the new paradigm of a feedback system, the warehouse will have to become more dynamic and bidirectional.
The cost (read: time) of adding data variety (i.e., new attributes for analysis) is critical. Adjusting algorithms based on feedback and constant validation is often constrained by the number of data scientists available. If adding this feedback scales with your technical resources, as many data warehousing solutions do today, then sticking to predictive and historic analytics is the path of least resistance.
Equally critical is the bidirectional nature of information. Not only are you pulling data from systems in order to build predictive models, but you also have to supplement your workflow with predictions to capture the value. Most applications can’t be retrofitted to display predictions and don’t have the flexibility to add this in-app to the workflow, so frequently the warehouse will have to trace predictions to outcomes. Alternatively, application-specific data marts can be used to house and populate these predictions.
Regardless, the days of static and enterprise-wide data warehouses are coming to an end. The acceleration of analytics delivered by highly
The ROI of a Feedback System
Building analytical-driven systems is about more than just confirming the benefits of data-driven decisions. It’s a fundamental muscle of a
well-operated organization. It makes objectives more tangible and measurable, and connects process with observable behavior. The transparency and
Chapter 4. Procurement
Analytics
Matt Holzapfel
Procurement makes an excellent example of an analytics use case because, like so many analytics projects, the first step is simplifying the complexity and cutting through a vast quantity of data. Data-complexity problems are particularly large in procurement because procurement interacts with every function in an organization and must analyze internal and external
Defining Analytics for Procurement
“Are we going to be predicting commodity prices?”
That was the first thought that came to my mind when my manager told me he wanted my help to build the analytics capabilities of our sourcing team. I had a tough time understanding how we would use analytics when so much of my job involved negotiating with suppliers and debating internally which supplier should win an RFQ.
After a lengthy conversation with my manager, I realized he was struggling with an overwhelming amount of complex information being sent to him by suppliers and colleagues — from lead-time reports to technology roadmaps. He didn’t need someone to help him predict the price of copper. He needed help simplifying the information flow so that he could make decisions more quickly and confidently. In other words, analytics weren’t supposed to replace the need for judgment, they were an enabler for making better decisions.
Starting with Analytics
Mike Tyson famously said, “everyone has a plan until they get punched in the mouth.” In procurement, everyone has a plan until suppliers decide to raise prices.
Sourcing managers start the year with a good sense of how they’re going to achieve their savings goals. Unfortunately, things don’t always go as planned. One painfully memorable experience came when I ran an RFQ on one of my company’s highest-volume products. I expected the RFQ to follow its historic pattern — initial prices might be 5–10% above our target, but with some negotiation, final prices would reach our target. Instead, initial quotes came in 40–50% above our target. Despite our best efforts, we weren’t able to get close to our price target, threatening our ability to meet our annual savings goal.
We had to throw out our plan for the year and quickly devise a new plan for bringing down costs somewhere else to make up for the price increase. The number of options were overwhelming. Do we bundle spend on other product lines to get better pricing? Do we dual-source more components to put
pressure on suppliers?
Fortunately, we made significant investments in our analytics capabilities and could estimate the impact of each option before making a decision. This
saved us from chasing insignificant opportunities, and helped us identify opportunities that we had been neglecting. Further, it taught us the
Analytics Use Case 1
Estimate the impact of strategic sourcing initiatives and prioritize appropriately.
Procurement teams that start the year by analyzing a variety of cost savings opportunities, before making prioritization decisions, put themselves in a great position to achieve their goals. The number of possible initiatives a procurement team can prioritize is high; and this problem is exacerbated by a constant inflow of email from colleagues and executives with ideas on ways to improve.
Using Analytics to Do More with Less
A comprehensive study done by AT Kearney in late 2014 showed that 75% of procurement organizations have not improved their productivity since 2011. This seems hard to believe given procurement’s constant push for efficiency gains, declining commodity prices, and the rise of technology designed to make businesses more efficient. This is especially troubling with sales growth stagnating at the world’s largest companies.
One reason for this slump is that spend is becoming more difficult to analyze. Record levels of M&A and the growth of outsourcing have significantly increased the number of data sources and variety of data formats needed to gain full spend visibility. As a result, many organizations struggle to answer basic questions like, “how many suppliers do I have?,” and “what’s my spend per category?” — let alone answer more complex questions like “what’s the impact on my spend if the price of steel rises 10%?” If procurement teams are going to be able to do more with less, they need to be able to answer these questions quickly, so that they can spend less time debating decisions and more time acting on insight.
One of the biggest opportunities missed by sourcing teams without full spend visibility is cost savings in the long tail of spend. The average organization has only 55–60% of its spend under management, while best-in-class
performers manage close to 85%. If we assume a procurement organization can achieve 5–10% savings on spend that it brings under management, then bringing an additional 20% of spend under management can lead to an additional 1–2% of total annual savings on all spend.
Managing more of this long tail spend is often an analytics problem. Sourcing managers can’t manage this spend at the same level of depth as their top
Analytics Use Case 2
Reduce long tail spend by identifying categories and suppliers that can be removed, consolidated, or offloaded.
Getting a Voice at the Table, Through Analytics
The term “strategic sourcing” has permeated the procurement function for the past 20 years, but is often hard to describe and even harder to achieve. A survey of Chief Procurement Officers (CPOs) conducted by Deloitte in 2014 showed that 72% of CPOs rated their procurement functions as having mixed or poor effectiveness as strategic business partners. One reason for this
deficiency is that strategic sourcing requires managers to have a holistic view of their business, one that goes beyond procurement.
In addition to spend data, strategic sourcing managers need on-demand
access to information such as commodity trends, product quality data, supply data, and sales performance. On-demand access to this data is essential for procurement to serve as a trusted advisor to engineering and finance, and be viewed internally as an important strategic function.
A strong relationship between engineering and procurement for direct spend is essential to delivering a great customer experience. If engineering has too much clout, it can be impossible for procurement to maintain the respect of its suppliers. For example, the suppliers who recognize engineering’s power will spend their time catering to all of engineering’s needs, knowing they can charge whatever prices they want.
Procurement can mitigate this risk by serving as strong partners for
engineering. This includes engaging with engineering early in the product design cycle to inform them of key cost trends that could impact how they design the product. This also includes sharing detailed, fact-based supplier scorecards so that everyone has the same understanding of supplier
Analytics Use Case 3
Provide fact-based insight, such as cost trends, that can influence design decisions and position procurement as a trusted advisor for engineering. Procurement should also be looking for ways to enhance its relationship with finance. Procurement teams who successfully create value for their finance colleagues enjoy the benefits of seeing increased investment in the
procurement function and are given more input into strategic decisions. Two ways procurement can improve this relationship is by communicating cost forecasts, even if they are only directional estimates, and staying ahead of trends in technology and third-party services.
The idea of cost forecasting sounds intimidating when so much of a
company’s spend relies on a wide range of factors. For example, the amount a company spends on travel is influenced by the cost of travel as well as the amount employees need to travel. Both of these factors vary with the global economy, the health of the airline industry, commodity prices, and the
company’s priorities. The key to simplifying this exercise is classifying spend at a granular level. It’s extremely difficult to identify patterns in “travel and entertainment” costs. If spend is classified into more detailed categories, such as “air travel for a conference” and “air travel for a customer visit,” it
Analytics Use Case 4
Forecast costs using a granular level of spend classification.
Another way procurement can become a better partner for finance is by monitoring trends in technology and third-party services. This enables procurement to advise finance on how to budget for these products and services in coming years. It also helps procurement and finance have better conversations with colleagues about the impact of purchasing these products or services, so that money is used most effectively and colleagues begin to think of procurement as thought partners instead of red tape.
Procurement teams looking to improve their relationships with finance and engineering must make it a priority to think about their business holistically. This often requires behavior change, as lower importance procurement
initiatives must get deprioritized to make time for preparing information that is valuable to other functions. Fortunately, the reward for being a good
partner can be significant. Procurement teams who successfully establish themselves as strategic business partners to finance and engineering enjoy the benefits of being judged by more than just the savings numbers they report and get to take part in strategic discussions about the future of their
Procurement Analytics as a Starting Point
About the Authors
Nidhi Aggarwal leads strategy and marketing at Tamr. Prior to joining Tamr, Nidhi founded Cloud vLab, makers of qwikLAB, a software-learning
platform used to create and deploy on-demand lab environments. In the years before Cloud vLab, Nidhi worked at McKinsey & Company, advising
Fortune 150 companies on big data strategy. Nidhi holds a PhD in computer science from the University of Wisconsin-Madison.
With over 20 years of experience in consulting services and software, Byron Berk currently leads the Customer Success team at Tamr, Inc. Prior to
joining Tamr, Byron was the Director of Professional Services and Training for Hewlett-Packard’s software business unit, where he led the development of the services and education organization for HP Vertica. Byron is a
graduate of Dartmouth College and has an MBA from Babson F.W. Olin Graduate School of Business.
Gideon Goldin is User Experience Architect at Tamr, where he focuses on product research and design. Prior to Tamr, Gideon served as a university lecturer and cofounder of DataScale Consulting, a data science and user experience firm. He holds a Masters in Human-Computer Interaction and a PhD in Cognitive Science from Brown University.
Matt Holzapfel is a procurement analytics evangelist at Tamr, Inc. Prior to consulting with Tamr, Matt held positions in Strategy at Sears Holdings and Strategic Sourcing at Dell, where he led the implementation of new sourcing techniques to significantly lower procurement costs. Matt has a BS in
Mechanical Engineering from the University of Illinois at Urbana-Champaign and is a recent graduate of Harvard Business School.
Eliot Knudsen is a Field Architect at Tamr, where he works on technical implementation and deployment. He’s worked with Fortune 100 clients to dramatically reduce spend by unifying sourcing data and implementing
Introduction
Analytics Projects Often Start in the Wrong Place Analytics Projects End Too Soon
Analytics Projects Take Too Long…and Still Fall Short Human-Machine Analytics Solutions
Question-First, Data-Second Approach 1. Visualize Data Analytics
Introduction
Defining Visual Analytics
Role of Data Management and Analysis Role of Data Visualization
Role of Interaction Role of Collaboration Putting It All Together References
2. Choosing Your Own Adventure in Analytics
Don’t Wait Until the End of the Book to Adjust Your Course Adjust Quickly After Making Bad Decisions
Iterate to Improve Performance
As the Story Progresses, the Data Driving Your Decisions Will Change
3. Realizing ROI in Analytics
The Lifecycle for a Feedback System The Measurements for a Feedback System The Database for a Feedback System The ROI of a Feedback System
4. Procurement Analytics
Defining Analytics for Procurement Starting with Analytics
Analytics Use Case 1
Using Analytics to Do More with Less Analytics Use Case 2
Getting a Voice at the Table, Through Analytics Analytics Use Case 3
Analytics Use Case 4