Real User Measurements
Why the Last Mile is the Relevant Mile
Real User Measurements
by Pete Mastin
Copyright © 2016 O’Reilly Media, Inc. All rights reserved. Printed in the United States of America.
Published by O’Reilly Media, Inc., 1005 Gravenstein Highway North, Sebastopol, CA 95472. O’Reilly books may be purchased for educational, business, or sales promotional use. Online editions are also available for most titles (http://safaribooksonline.com). For more information, contact our corporate/institutional sales department: 800-998-9938 or [email protected].
Editor: Brian Anderson
The O’Reilly logo is a registered trademark of O’Reilly Media, Inc. Real User Measurements, the cover image, and related trade dress are trademarks of O’Reilly Media, Inc.
While the publisher and the author have used good faith efforts to ensure that the information and instructions contained in this work are accurate, the publisher and the author disclaim all
responsibility for errors or omissions, including without limitation responsibility for damages
resulting from the use of or reliance on this work. Use of the information and instructions contained in this work is at your own risk. If any code samples or other technology this work contains or describes is subject to open source licenses or the intellectual property rights of others, it is your responsibility to ensure that your use thereof complies with such licenses and/or rights.
Acknowledgments
Standing on the shoulders of giants is great: you don’t get your feet dirty. My work at Cedexis has led to many of the insights expressed in this book, so many thanks to everyone there.
I’d particularly like to thank and acknowledge the contributions (in many cases via just having great conversations) of Rob Malnati, Marty Kagan, Julien Coulon, Scott Grout, Eric Butler, Steve Lyons, Chris Haag, Josh Grey, Jason Turner, Anthony Leto, Tom Grise, Vic Bancroft and Brett Mertens, and Pete Schissel.
Chapter 1. Introduction to RUM
Man is the measure of all things.
—Protagoras
What are “Real User Measurements” or RUM? Simply put, RUM is measurements from end users. On the web, RUM metrics are generated from a page or an app that is being served to an actual user on the Internet. It is really just that. There are many things you can measure. One very common measure is how a site is performing from the perspective of different geolocations and subnet’s of the Internet. You can also measure how some server on the Internet is performing. You can measure how many people watch a certain video. Or you can measure the Round Trip Time (RTT) to Amazon Web Services (AWS) East versus AWS Oregon from wherever your page is being served. You can even measure the temperature of your mother’s chicken-noodle soup (if you have a thermometer stuck in a bowl of the stuff and it is hooked to the Internet with an appropriate API). Anything that can be
measured can be measured via RUM. We will discuss this in more detail later. In this book, we will attempt to do three things at once (a sometimes risky strategy):
Discuss RUM Broadly, not just web-related RUM, but real user measurements from a few different perspectives, as well. This will provide context and hopefully some entertaining diversion from what can be a dry topic otherwise.
Provide a reasonable overview of how RUM is being used on the Web today.
Discuss in some detail the use cases where the last mile is important—and what the complexities can be for those use cases.
Many pundits have conflated RUM with something specifically to do with monitoring user interaction or website performance. Although this is certainly one of the most prevalent uses, it is not the essence of RUM. Rather, it is the thing being measured. RUM is the source of the measurements—not the target. By this I mean that RUM refers to where the measurements come from, not what is being measured. RUM is user initiated. This book will explore RUM’s essence more than the targets. Of course, we will touch on the targets of RUM, whether they be Page Load Times (PLT), or latency to public Internet infrastructure, or Nielson Ratings.
generally speaking. But again, this is the target of the measurement, not its source. Synthetic measurements can generally be used to measure anything.
APM VERSUS EUM AND RUM
APM is a tool with which operations teams can have (hopefully) advanced notification of pending issues with an application. It does this by measuring the various elements that make up the application (database, web servers, etc.) and notifying the team of pending issues that can bring a service down.
End User Monitoring (EUM) is a tool with which companies can monitor how the end user is experiencing the application. These tools are also sometimes used by operations teams for troubleshooting, but User Experience (UX) experts also can use them to determine the best flow of an application or web property.
RUM is a type of measurement that is taken of something after an actual user visits a page. These are to be contrasted with synthetic measurements.
Active versus Passive Monitor
Another distinction worth mentioning here is between Passive and Active measurements. A passive measurement is a measurement that is taken from input into the site or app. It is passive because there is no action being taken to create the monitoring event; rather, it comes in and is just recorded. It has been described as an observational study of the traffic already on your site or network. Sometimes, Passive Monitoring is captured by a specialized device on the network that can, for instance, capture network packets for analysis. It can also be achieved with some of the built-in capabilities on
switches, load-balancers or other network devices.
An active measurement is a controlled experiment. There are near infinite experiments that can be made, but a good example might be to detect the latency between your data center and your users, or to generate some test traffic on a network and monitor how that affects a video stream running over that network.
Generally speaking:
The essence of RUM is that it is user initiated.
The essence of Synthetic is that it is computer generated.
The essence of Passive Monitoring is that it is an observational study of what is actually happening based on existing traffic.
The essence of Active Monitoring is that it is a controlled experiment.
the following way:
RUM/Active Monitoring makes it possible to test conditions that could lead to problems—before they happen—by running controlled experiments initiated by a real user.
With RUM/Passive Monitoring, you can detect problems in real time by showing what is actually happening on your site or your mobile app.
Synthetic/Active Monitoring accommodates regular systematic testing of something using an active outbound monitor.
Using Synthetic/Passive Monitoring, you can implement regular systematic testing of something using some human/environmental element as the trigger.
It’s also useful to understand that generally, although Synthetic Monitoring typically has fewer measurements, RUM typically has lots of measurements. Lots. We will get into this more later. RUM is sometimes conflated with “Passive” measurements. You can see why. However this is not exactly correct. A RUM measurement can be either active or passive.
RUM (user initiated) Synthetic (computer initiated)
Active (generates traffic)
A real user’s activity causes an active probe to be sent. Real user traffic generating a controlled experiment. Typified by companies like web-based Cedexis, NS1, SOASTA (in certain cases), and web load testing company Mercury (now HP).
Controlled experiment generated from a device typically sitting on multiple network points of presence. Typified by companies like Catchpoint, 1000 Eyes, New Relic, Rigor, Keynote, and Gomez. Internap’s Managed Internet Route Optimization (MIRO) or Noction’s IRP.
Passive (does not generate traffic)
Real user traffic is logged and tracked, including performance and other factors. Observational study used in usability studies, performance studies, malicious probe analysis and many other uses. Typified by companies like Pingdom, SOASTA, Cedexis, and New Relic that use this data to monitor website
performance.
Observational study of probes sent out from fixed locations at fixed intervals. For instance, Traffic testing tools that ingest and process these synthetic probes. A real-world example would be NOAA’s weather sensors in the ocean —used for detection of large weather events such as a Tsunami.
We will discuss this in much greater detail in Chapter 4. For now let’s just briefly state that on the Internet, RUM is typically deployed in one of the following ways:
Some type of “tag” on the web page. The “tag" is often a snippet of JavaScript. Some type of passive network monitor. Sometimes described as a packet sniffer. Some type of monitor on a load balancer.
A passive monitor on the web server itself
In this document, we will most often be referring to tags, as mentioned earlier. However, we will discuss the other three in passing (mostly in Chapter 4).
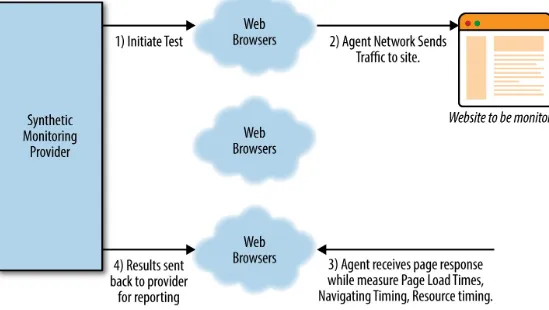
Figure 1-1. Typical flow of a Synthetic Monitor
As you can see, it’s a simple process of requesting a set of measurements to be run from a network of test agents that live in data centers or clouds around the globe.
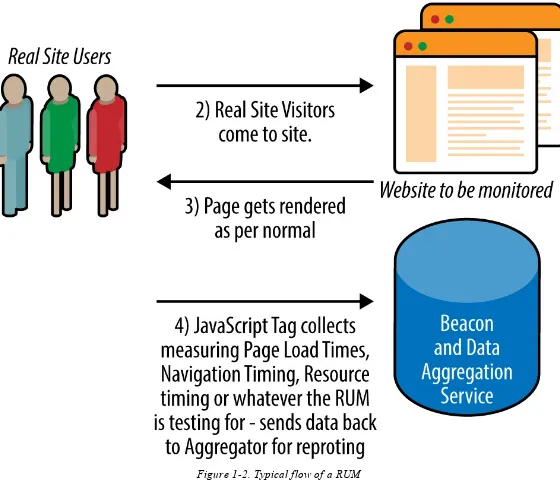
Figure 1-2. Typical flow of a RUM
In what follows, we will discuss the pros and cons of RUM, quantitative thresholds of RUM, aggregating community measurements, ingesting RUM measurements (there are typically a LOT of them), and general reporting. Toward the end, I will give some interesting examples of RUM usage.
The Last Mile
Finally in this introduction, I want to bring up the concept of the last mile. The last mile refers to the Internet Service Provider (ISP) or network that provides the connectivity to the end user. The term the “last mile” is sometimes used to refer to the delivery of the goods in ecommerce context, but here we use it in the sense of the last mile of fiber, copper, wireless, satellite, or coaxial cable that connects the end user to the Internet.
them are end-user net works (or eyeball networks) and many of them are middle mile and Tier 1 networks that specialize in long haul. How they are connected to one another is one of the most
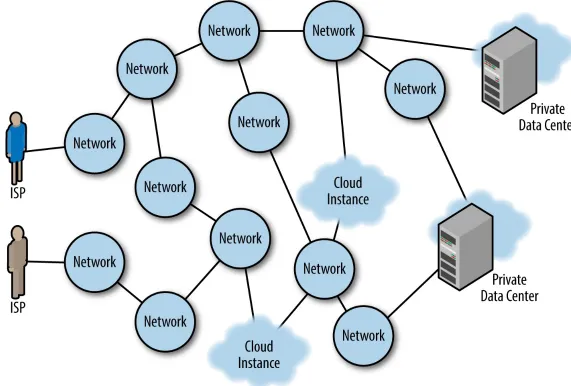
important things you should understand about the Internet. These are called peering relationships, and they can be paid or unpaid depending on the relationship between the two companies. (We go into more detail about this in Chapter 2.) The number of networks crossed to get to a destination is referred to as hops. These hops are the basic building blocks that Border Gateway Protocol (BGP) uses to select paths through the Internet. As you can see in Figure 1-3, if a user were trying to get to the upper cloud instance from the ISP in the upper left, it would entail four hops, whereas the getting there from the ISP in lower left would only make three hops. But that does not mean that the lower ISP has a faster route. Because of outages between networks, lack of deployed capacity or
congestion, the users of the lower ISP might actually find it faster to traverse the eight-hop path to get to the upper cloud because latency is lower via that route.
Figure 1-3. ISPs, middle-mile networks: the 50,000-plus subnets of the Internet
your sites performance. You can simulate this with synthetic measurements, but as we show in the chapters that follow, there are many problems with this type of simulation. The last mile is important for exactly these reasons.
References
1. Tom Huston, “What Is Real User Monitoring?”
2. Andrew McHugh, “Where RUM fits in.”
3. Thanks to Dan Sullivan for the very useful distinction between observational study and controlled experiment (“Active vs Passive Network Monitoring”).
Chapter 2. RUM: Making the Case for
Implementing a RUM Methodology
It turns out umpires and judges are not robots or traffic cameras, inertly monitoring deviations from a fixed zone of the permissible. They are humans.
—Eric Liu
As mentioned in the Chapter 1, Real User Measurements (RUM) are most reasonably and often contrasted with Synthetic Monitoring. Although my subtitle to this chapter is in jest, it is not a bad way to understand the differences between the measurement types. To understand the pros and cons of RUM, you must understand broadly how it works.
RUM versus Synthetic—A Shootout
So, where does RUM win? Where do synthetic measurements win? Let’s take a look. What is good about RUM?
Measurements are taken from point of consumption and are inclusive of the last mile. Measurements are typically taken from a very large set of points around the globe. Measurements are transparent and unobtrusive
Can provide real-time alerts of actual errors that users are experiencing. What is bad about RUM?
Does not help when testing new features prior to deployment (because the users cannot actually see the new feature yet).
Large volume of data can become a serious impediment. Lack of volume of data during nonpeak hours.
What is good about Synthetic Monitoring?
Synthetic Monitoring agents can be scaled to many locations.
Synthetic Monitoring agents can be located in major Internet junction points.
What is bad about Synthetic Monitoring?
Monitoring agents are located at too few locations to be representative of users experience.
Synthetic Monitoring agents are only located in major Internet junction points, so they miss the vast majority of networks on the Internet.
Synthetic Monitoring agents do not test every page from every browser.
Because synthetic monitors are in known locations and are not inclusive of the last mile, they can produce unrealistic results.
These are important, so let’s take them one at a time. We will begin with the pros and cons of RUM and then do the same for Synthetic Monitoring.
Advantages of RUM
Why use RUM?
Measurements are taken from point of consumption (or the last mile)
Why is this important? We touched upon the reason in the introduction. For many types of
Figure 2-1. One failed RUM strategy that is commonly used
Measurements are typically taken from a very large set of points around the globe
This is important to understand as you expand your web presence into new regions. Knowing how your real users in, for example, Brazil are experiencing your web property can be very important if you are targeting that nation as a growth area. If your servers are all in Chicago and you are trying to grow your business in South America, knowing how your users in Brazil are currently experiencing the site will help you to improve it prior to spending marketing dollars. The mix of service providers in every region is typically very different (with all the attendant varying peering arrangements) and this contributes to completely different performance metrics from various parts of the world—even more in many cases than the speed-of-light issues.
The other point here is that RUM measurements are not from a fixed number of data centers; rather, they are from everywhere your users are. This means that the number of cases you’re testing is much larger and thus provides a more accurate picture.
Measurements are transparent and unobtrusive
This is really more about the passive nature of much of RUM. Recall the distinction between Observational Study and Controlled Experiment? An observational study is passive and thus
unobtrusive. Because most RUM is passive and passive measurements are obviously far less likely to affect site performance, this advantage is often attributed to RUM. Because so much of RUM is
passive in nature, I list it here. Just realize that this is an advantage of any passive measurement, not just RUM, and that not all RUM is passive.
RUM can provide real-time alerts of actual errors that users are experiencing.
Of course not all RUM is real time and not all RUM is used for monitoring websites. But RUM does allow for this use case with the added benefit of reducing false negatives dramatically because a real user is actually running the test. Synthetic Monitors can certainly provide real-time error checking, but they can lead to misses. To quote the seminal work in Complete Web Monitoring (O’Reilly, 2009), authors Alistair Croll and Sean Power note, “When your synthetic tests prove that visitors were able to retrieve a page quickly and without errors, you can be sure it’s available. While you know it is working for your tests, however, there’s something you do not know: is it broken for anyone anywhere?”
The authors go on to state:
Just because a test was successful doesn’t mean users are not experiencing problems: The visitor may be on a different browser or client than the test system.
The visitor may be accessing a portion of the site that you’re not testing, or following a navigational path you haven’t anticipated.
reasons, including latency, packet loss, firewall issues, geographic distance, or the use of a proxy.
The outage may have been so brief that it occurred in the interval between two tests. The visitor’s data—such as what he put in his shopping cart, the length of his name, the length of a storage cookie, or the number of times he hit the Back button—may cause the site to behave erratically or to break.
Problems may be intermittent, with synthetic testing hitting a working component while some real users connect to a failed one. This is particularly true in a load balanced environment: if one-third of your servers are broken, a third of your visitors will have a problem, but there’s a two-thirds chance that a synthetic test will get a correct response to its HTTP request.”
Sorry for the long quote, but it was well stated and worth repeating. Because I have already stolen liberally I’ll add one more point they make in that section: “To find and fix problems that impact actual visitors, you need to watch those visitors as they interact with your website.” There is really no other way.
Disadvantages of RUM
Even though RUM is great at what it does, it does have some disadvantages. Let’s discuss those here.
It does not help when testing new features prior to deployment
RUM only works when real users can see the page or app. When it’s in a staging server, they typically cannot see it. Of course, many progressive companies have been opening up the beta versions of their software to users earlier and earlier, and in these cases, RUM can be used. That being said there are certainly times when running an automated set of test scripts synthetically is a better idea than opening up your alpha software to a large group of users.
Large volume of data can become a serious impediment
It can be an overwhelming amount of data to deal with. Large web properties can receive billions of RUM measurements each day. We discuss this in much more detail in later chapters, but it is a serious issue. Operational infrastructure must be allocated to retrieve and interpret this data. If real-time analysis is the goal, you’ll need even more infrastructure.
Insufficient volume of data during nonpeak hours
One example is a site that sees a lot of traffic during the day but that traffic drops off dramatically at night. This type of pattern is called a diurnal trend. When there are far fewer people using your application, it will cause a dramatic drop off in your RUM data, to the point that the user data
fixed had you been using synthetic measurements with their regularly timed monitoring.
Advantages of Synthetic Monitoring
Why do we use Synthetic Monitoring?
Synthetic Monitoring agents can be scaled to many locations
This is true. Most of the larger synthetic monitoring companies have hundreds of sites from which a client can choose to monitor. These sites are data centers that have multiple IP providers, so the test can even be inclusive of many networks from these locations. For instance, as I write this, Dyn advertises around 200 locations and 600 geographies paired with IP providers to get around 600 “Reachability Markets” from which you might test. This is significant and includes all of the major cities of the world.
You can locate Synthetic Monitoring agents in major Internet junction points
This is a related point to the first one. By locating monitoring agents at the major Internet junctions you can craft a solution that tests from a significant number of locations and networks.
Synthetic Monitoring agents can provide regular monitoring of a target, independent of a user base
This is perhaps the most important advantage depending on your perspective. As I mentioned just earlier, a RUM monitor of a site with few users might not get enough measurements to adequately monitor it for uptime 24/7. A Synthetic Monitor that runs every 30 minutes will catch problems even when users are not there.
Synthetic Monitoring can provide information about a site or app prior to deploying
Because it does not require users, this is the inverse of the first item on the list of RUM
disadvantages. As you add features there will be a time that you are not ready to roll it out to users, but you need some testing. Synthetic Monitoring is the answer.
Disadvantages of Synthetic Monitoring
Monitoring agents are located at too few locations to be representative of users experience
Even with hundreds of locations, a synthetic solution cannot simulate the real world where you can have millions of geographical/IP pairings. It is not feasible. From the perspective of cost, you simply cannot have servers in that many locations.
Synthetic Monitoring agents are only located in major Internet junction points and thus miss the vast majority of networks on the Internet
from those data centers, they are ignoring most of the 50,000 subnets on the Internet. If your problems happen to be coming from those networks, you won’t see them.
Synthetic Monitoring agents are typically not testing every page from every browser and every navigational path
This was mentioned in the fourth point in the list of advantages of RUM. Specifically: “The visitor may be on a different browser or client than the test system”
“The visitor may be accessing a portion of the site that you’re not testing, or following a navigational path you haven’t anticipated.”
Because Synthetic monitors are in known locations and not inclusive of the last mile, they can produce unrealistic results
A couple of years ago, the company I work for (Cedexis) ran an experiment. We took six global Content Delivery Networks (CDNs)—Akamai, Limelight, Level3, Edgecast, ChinaCache, and Bitgravity—and pointed synthetic monitoring agents at them. I am not going to list the CDNs results by name below, because it’s not really the point and we are not trying to call anyone out. Rather, I mention them here just so you know that I’m talking about true global CDNs. I am also not going to mention the Synthetic Monitoring company by name, but suffice it to say it is a major player in the space.
We pointed 88 synthetic agents, located all over the world, to a small test object on these six CDNs. Then, we compared the synthetic agent’s measurements to RUM measurements for the same network from the same country, each downloading the same object. The only difference is volume of
measurements and the location of the agent. The synthetic agent measures about every five minutes, whereas RUM measurements sometimes exceeded 100 measurements per second from a single subnet of the Internet. These subnets of the Internet are called autonomous systems (AS’s). There are more than 50,000 of them on the Internet today (and growing). More on these later.
Of course, the synthetic agents are sitting in big data centers, whereas the RUM measurements are running from real user’s browsers.
One more point on the methodology: because we are focused on HTTP response, we decided to take out DNS resolution time and TCP setup time and focus on pure wire time. That is, first byte plus connect time. DNS resolution and TCP setup time happen once for each domain or TCP stream, whereas response time is going to affect every object on the page.
Let’s look at a single network in the United States. The network is ASN 701: “UUNET – MCI Communications Services Inc., d/b/a Verizon Business.” This is a backbone network and captures major metropolitan areas all over the US. The RUM measurements are listed in the 95th percentile. Table 2-1. Measuring latency to multiple
CDN RUM measurement Synthetic measurement
Clearly, CDNs are much faster inside a big data center than they are in our homes! More interesting are the changes in Rank; Notice how CDN1 moves from number 5 to number 1 under RUM. Also, the scale changes dramatically: the synthetic agents data would have you believe CDN 6 is nearly 6 times slower than the fastest CDNs, yet when measured from the last mile, it is only about 20 percent
slower.
If you were using these measurements to choose which CDN to use, you might make the wrong
decision based on just the synthetic data. You might choose CDN 2, CDN 3 or CDN 4, when CDN 1 is the fastest actual network. RUM matters because that’s where the people are! The peering and geolocation of the Points of Presence (POPs) is a major element of what CDNs do to improve their performance. By measuring from the data center you obfuscate this important point.
Synthetic agents can do many wonderful things but measuring actual web performance (from actual real people) is not among them; performance isn’t about being the fastest on a specific backbone network from a data center, it is about being fastest on the networks which provide service to the subscribers of your service—the actual people.
RUM-based monitoring provides a much truer view of the actual performance of a web property than does synthetic, agent-based monitoring.
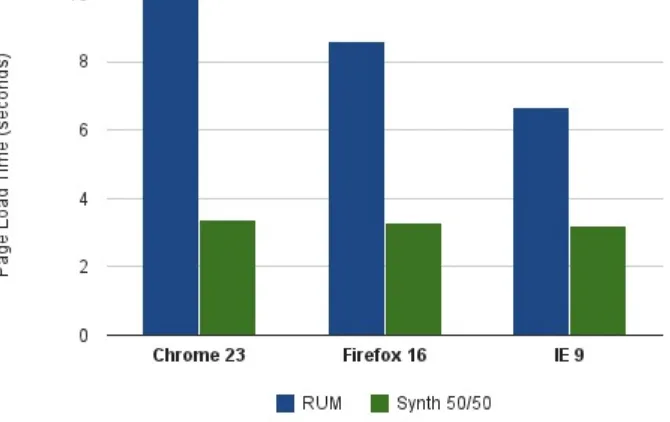
These observations seem to correspond with points made by Steve Souders in his piece on RUM and synthetic page load times (PLT). He notes:
The issue with only showing synthetic data is that it typically makes a website appear much faster than it actually is. This has been true since I first started tracking real user metrics back in 2004. My rule-of-thumb is that your real users are experiencing page load times that are twice as long as their corresponding synthetic measurements.
He ran a series of tests for PLT comparing the two methods of monitoring. You can see the results in
Figure 2-2. RUM versus synthetic PLT across different browsers (diagram courtesy of Steve Souders)
Note that while Mr. Souder’s “rule of thumb” ratio between PLT on synthetic tests and RUM test (twice as fast) is a very different ratio than the one we found in our experiments, there are reasons for this that are external to the actual test run. For example, PLT is a notoriously “noisy” combined metric and thus not an exact measurement. There are many factors that make up PLT and the latency
difference of 10 times might very well be compatible with a PLT of 2 times (RUM to synthetic). This would be an interesting area of further research.
References
1. Jon Fox, “RUM versus Synthetic.”
2. Thanks to my friend Chris Haag for setting up this experiment measuring the stark differences between CDNs measured by synthetic versus RUM measurements.
3. Tom Huston, “What Is Real User Monitoring?”
Chapter 3. RUM Never Sleeps
Those who speak most of progress measure it by quantity and not by quality. —George Santayana
Tammy Evert, a prolific writer in the area of performance optimization, donated the title to this section. She uses the term to signify the vast amounts of data you typically get in a RUM
implementation. I use it in the same vein, but it is worth noting a comment I received on a blog I wrote about this subject. The commenter noted that actually, synthetic monitors never sleep, and that a RUM implementation can (as mentioned earlier) be starved for data during the nighttime or if the app just does not have enough users. So how many users are “enough” users? How many measurements are sufficient? Well, if one of your objectives is to have a strong representative sample of the “last mile,” it turns out you need a pretty large number.
There are use cases for RUM that utilize it to capture the last mile information. We discussed in the introduction why this might be important, but let’s take a minute to review. The last mile is important for Internet businesses for four reasons:
By knowing the networks and geographies that its customers are currently coming from, a business can focus its marketing efforts more sharply.
By understanding what networks and geographies new customers are attempting to come from (emerging markets for its service), a company can invest in new infrastructure in those regions to create a better performing site for those new emerging markets.
When trying to understand the nature of an outage, the operations staff will find it very helpful to know where the site is working and where it is not. A site can be down from a particular
geography or from one or more networks and still be 100 percent available for consumers coming from other Geos and Networks. Real-time RUM monitoring can perform this vital function.
For sites where performance is of the utmost importance, Internet business can use Global Traffic Management (GTM) services from such companies as Cedexis, Dyn, Level3, Akamai,
CDNetworks and NS1 to route traffic in real time to the best performing infrastructure.
Top Down and Bottom Up
In this section, we will do a top-down analysis of what one might need to get full coverage. We will then turn it around and do a bottom-up analysis using actual data from actual websites that show what one can expect given a websites demographics and size.
50,000 networks (ASNs), to ensure that you are getting coverage for your retail website, your videos or your gaming downloads, you must have a large number of measurements. Let’s see why.
The Internet is a network of networks. As mentioned, there are around 51k networks established that make up what we call the Internet today. These networks are named, (or at least numbered) by a
designator called an ASN or Autonomous System Number. Each ASN is really a set of unified routing policies. As our friend Wikipedia states:
Within the Internet, an autonomous system (AS) is a collection of connected Internet Protocol (IP) routing prefixes under the control of one or more network operators on behalf of a single administrative entity or domain that presents a common, clearly defined routing policy to the Internet.
Every Internet Service Provider (ISP) has one or more ASNs; usually more. There are 51,468 ASNs in the world as of August 2015. How does that looks when you distribute it over whatever number of RUM measurements you can obtain? A perfect monitoring solution should tell you, for each network, whether your users are experiencing something bad; for instance, high latency. So how many
measurements should you have to be able to cover all these networks? 1 Million? 50 Million?
If you are able to spread the measurements out to cover each network evenly (which you cannot), you get something like the graph shown in Figure 3-1.
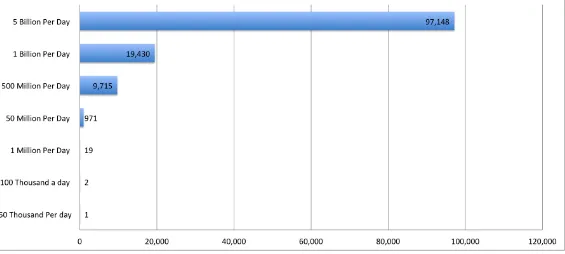
Figure 3-1. Number of measurements per ASN every day based on RUM traffic
The y-axis (vertical) shows the number of RUM measurements per day you receive. The labels on the bars indicate the number of measurements per network you can expect if you are getting measurements from 51,000 networks evenly distributed.
So, if you distributed your RUM measurements evenly over all the networks in the world, and you had only 100,000 page visits per day, you would get two measurements per network per day. This is
But surely of the 51,468 networks, you do not need to cover all of them to have a representative sample, right? No, you do not.
Suppose that you only care about networks that are peered with at least two networks. This is not an entirely risk-free assumption. This type of configuration is often called a stub. When the routing policies are identical to its up-line, it’s a waste. However, just because a network is only peered upward publicly, it does not mean it’s not privately peered. Nevertheless, we can make this
assumption and cut down on many of the lower traffic networks, so let’s go with it. There are about 855 networks with 11 or more peers, and 50,613 that are peered with 10 or less. There are 20,981 networks (as of August 2015) that only have one upstream peering partner. So, if you subtract those out you end up with 30,487 networks that have multiple upstream providers. That’s around three-fifths of the actual networks in existence but probably a fair share of the real users out in the world.
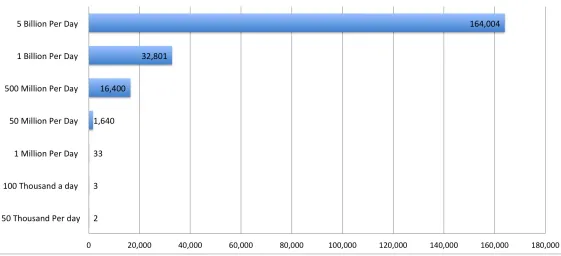
Figure 3-2 shows what the distribution looks like (if perfectly even, which it’s not) with this new assumption.
Figure 3-2. Using only the 30,487 ASNs that matter
The 1 million RUM measurements per day give you a measly 33 measurements per day per network. Barely one per hour!
If one of your users begins to experience an outage across one or more ISPs, you might not even know they are having problems for 50-plus minutes. By then, your customers that are experiencing this problem (whatever it was) would be long gone.
It’s important to understand that there are thresholds of volume that must be reached for you to be able to get the type of coverage you desire, if you desire last-mile coverage.
At 50 million measurements per day, you might get a probe every minute or so on some of the ISPs. The problem is that the Internet works in seconds. And it is not that easy to get 50 million
The bigger problem is that measurements are not distributed equally. We have been assuming that given your 30,487 networks, you can spread those measurements over them equally, but that’s not the way RUM works. Rather, RUM works by taking the measurements from where they actually come. It turns out that any given site has a more limited view than the 30,487 ASNs we have been discussing. To understand this better let’s look at a real example using a more bottom-up methodology.
Assume that you have a site that generates more than 130 million page views per day. The example data is real and was culled over a 24-hour period on October 20, 2015.
134 million is a pretty good number, and you’re a smart technologist that implemented your own RUM tag, so you are tracking information about your users so you can improve the site. You also use your RUM to monitor your site for availability. Your site has a significant number of users in Europe and North and South America, so you’re only really tracking the RUM data from those locations for now. So what is the spread of where your measurements come from?
Of the roughly 51,000 ASNs in the world (or the 30,000 that matter), your site can expect
measurements from approximately 1,800 different networks on any given day (specifically, 1,810 on this day for this site).
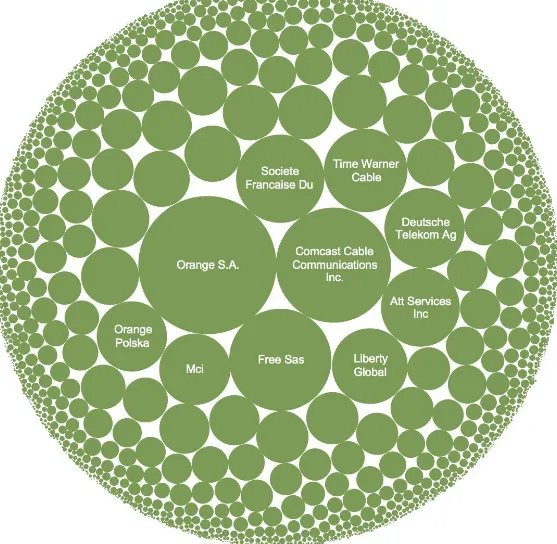
Figure 3-3. Sample of actual ISPs involved in a real sites monitoring
The disparity between the top measurement-producing networks and the bottom networks is very high. As you can see in the table that follows, nearly 30 percent of your measurements came from only 10 networks, whereas the bottom 1,000 networks produce 2 percent of the measurements.
Number of measurements Percent of total measurements
Top 10 networks 39,280,728 29.25580% Bottom 1,000 networks 3,049,464 2.27120%
RUM Across Five Real Sites: Bottom Up!
The preceding analysis is a top-down analysis of how many networks a hypothetical site could see in principle. Let’s look at the same problem form the bottom up now. Let’s take five real sites from five different verticals with five different profiles, all having deployed a RUM tag. This data was taken from a single 24-hour period in December 2015.
Here are the sites that we will analyze:
A luxury retail ecommerce site that typically gets more than one million page views each day A social media site that gets more than 100 million page views per day
A video and picture sharing site that gets more than 200 million page views per day A gaming site that gets more than two million page views a day
Over-the-Top (OTT) video delivery site that regularly gets around 50,000 page views a day Here is the breakdown over the course of a single day:
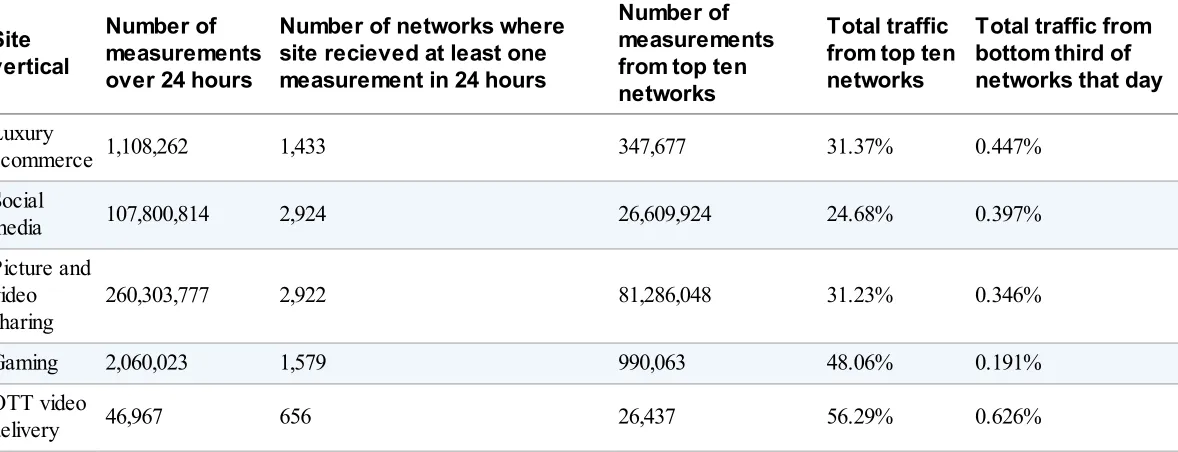
Table 3-1. Five sites and their RUM traffic
Site
Total traffic to the various sites varies greatly among these five sites. And yet, even with the huge variance in traffic, there are certain patterns that emerge. For all five sites, 25 to 50 percent of the measurements are taken from the top ten networks. Furthermore, for all five sites, the bottom one-third of the networks providing measurements contributed less than .5 percent in all but one case.
The pattern that emerges is that you need a lot of measurements to get network coverage.
Although admittedly this is a limited dataset and the sites represented have different marketing
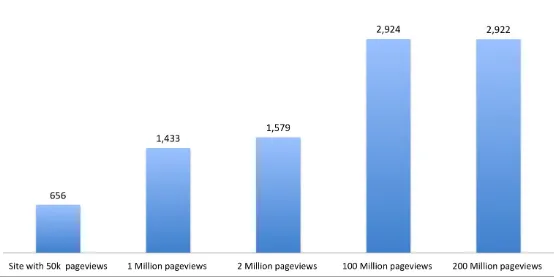
As Figure 3-4 shows, we can see that sites with around 50,000 measurements per day can typically expect to see fewer than 1,000 networks. Sites that are seeing 1 to 2 million measurements per day will typically see 1 to 2 thousand networks, and sites with 100 to 200 million measurements per day will see around 3,000 networks—at least with these demographics.
Figure 3-4. Number of last-mile networks seen from sites of various traffic levels
This is out of the 30,487 networks that we determined earlier are important.
If you extrapolate out using this approach you would need a billion measurements to get to roughly 6,000 networks. But, we will see that this top-down approach is not correct for some important reasons.
Recall that we began this chapter trying to understand how one might cover 30,000 ASNs and ISPs using a RUM tag. What we see here is that the typical site only sees (on a daily basis) a fraction of those 30,000 networks (much less the complete set of 51,000 networks). That’s far too few to feel confident in making assertions about RUM coverage, because performance could have been
problematic in principle from networks that were not tested. How do you overcome this? One way would be to augment by using Synthetic Monitoring. This is a good strategy but has shortcomings. As we discussed in Chapter 2, you cannot monitor all these networks using synthetic monitors (for costs reasons primarily). It is impractical. But there is a strategy that could work. And that’s what we discuss in the next chapter.
References
1. “Active vs. Passive Web Performance Monitoring.”
and its ramifications. Could not have had better input. 3. Geoff Huston, “Exploring Autonomous System Numbers.”
Chapter 4. Community RUM: Not Just for
Pirates Anymore!
I’m a reflection of the community.
—Tupac Shakur
Community measurements? What are these? Simply put, if you can see what other people are
experiencing it might help you to avoid some ugly things. In many ways, this is the primary life lesson our parents wanted to instill in us as children. “Learn from others mistakes, because there is not
enough time to make all the mistakes yourself.” By being associated with a community (and learning from that community), a person can avoid the most common mistakes.
In that context, let us review what we discussed in the last chapter. It turns out that sites get far less coverage from the vastness of the Internet than typically understood. Of the 51,000 ASNs and ISPs, only a fraction provides RUM measurements on a daily basis to any given website.
More important—and we will discuss this in much greater detail below—the long tail of networks changes all the time and is typically not the same at all for any two given sites.
You could augment your RUM with synthetic measurements. This is certainly possible, but it is also certainly very expensive. To get coverage from even a fraction of the ASNs that don’t produce significant traffic to a site would be a lot of synthetic traffic.
So how can community RUM measurements help?
Crowdsourcing is the act of taking measurements from many sources and aggregating them into a unified view. You can crowd-source anything. In Japan, they have crowd-sourced radiation measurements (post Fukushima). There have been attempts to get surfers to contribute (via crowd sourcing) to sea temperature studies typically performed only by satellites.
As Cullina, Conboy, and Morgan said in their recent work on the subject:
Crowdsourcing as a contemporary means of problem solving is drawing mass attention from the Internet community. In 2014, big brands such as Procter and Gamble, Unilever, and Pepsi Co. increased their investment in crowdsourcing in ranges from 50 percent to 325 percent.
A key element of crowdsourcing is the ability to aggregate. This is in fact what makes it a community. So, what if you could aggregate the RUM measurements from the five sites we discussed in the last chapter?
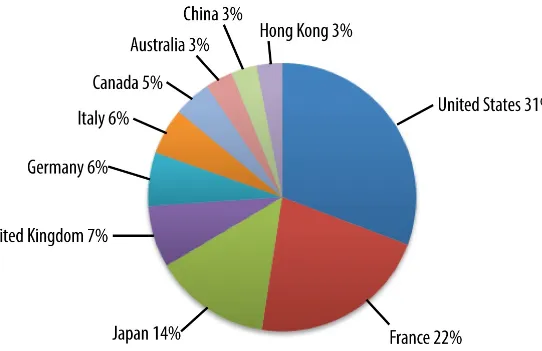
Figure 4-1 shows that the luxury ecommerce website has a very nice spread of traffic from those countries that you would expect are the largest buyers of luxury goods.
Figure 4-1. Demographics of a luxury ecommerce site
Figure 4-2. Demographics of social media site
Figure 4-3. Demographics of picture and video-sharing site
Figure 4-4. Demographics of a gaming site
Figure 4-5. Demographics of video OTT site
Table 4-1. Top networks for OTT site
Network Percent of total measurements
Comcast Cable Communications, Inc. 17.4463% AT&T Services, Inc. 9.5194% MCI Communications Services, Inc. D/B/A Verizon Business 6.4875%
CenturyLink 5.1738%
So, how do these five sites stack up with regard to having network overlap? If we take a look at the top ten networks from which each of them receive traffic, we can get a sense of that. Lets color the networks that appear in the top ten networks for all five sites:
Figure 4-6. Top ISPs in common using RUM amongst five sites
So for these five sites (on this day) in the top ten networks from which they received RUM
measurements, there were only three networks that they all shared: Verizon, AT&T, and Comcast. As was pointed out earlier, for the OTT site, that was roughly 33 percent of its monitoring traffic from those three networks. From the entire top ten of its networks, the OTT site received a bit more than 50 percent of its traffic overall. This was on the high end. The other sites got anywhere from 25 percent to 48 percent of their traffic from the top ten networks in their portfolio of last-mile networks.
Even when you broaden the filter and allow a network to be colored if it appears in two or more top ten network list, 46 percent of the networks that show up in any of the top ten show up only once (23), whereas 54 percent show up in multiple sites top ten lists.
Figure 4-7. Top ISPs in common using RUM amongst five sites with two or more sites in common
Figure 4-8. RUM coverage of five different sites
Figure 4-9. Network overlap of the five different sites
So the overlap of last-mile networks appears strong. In fact, what you find is that generally all the networks in the smaller sites set are found in the larger sites set. But it is not a perfect containment relationship. Table 4-2 provides some examples.
The lefthand column is the name of the last-mile network, and the remaining five columns are the five sites we have been discussing, along with the number of measurements that originated from that
network. As you can see in the sample set, there were many examples in the data where smaller sites had some measurements from a last-mile network when the larger ones did not. This is not the
complete list either; it was just a sample of them that I pulled out of the data. There are literally hundreds of examples where larger sites had fewer measurements on a particular network than smaller sites. As you can also see in the sample set, the gaming site (in spite of generating more than two million measurements from all over the world) had no measurements from these selected
networks.
Table 4-2. Example networks with little to no overlap
Last mile network OTT site
(46,967) ecommerce(1,108,262) Gaming(2,060,023) Social media(107,800,814) Picture and videosharing (260,303,777)
2Talk Global IP network 10 0 0 3,293 2,029 Academic Seneca network 1 0 0 889 3,818 Afghantelecom Government
Communication network 1 0 0 6,098 1,993
Airtel Tanzania 2 0 0 3,586 2,803
Arab American University Jenin 0 0 0 44 0 Bangladesh Telecommunications
Company 44 0 0 5,144 1,290
Blackberry Limited 0 15 0 0 0
Hec Pern 1 0 0 18,242 11,556
Hong Kong University of
Science and Technology 14 0 0 3,502 7,547
Jawwal 0 0 0 492 0
Meghbela Broadband 2 0 0 5,471 2,778 Rasaneh Avabarid Private Joint
Stock Company 0 25 0 2,125 0
Safaricom Limited 6 0 0 13,902 10,000 Saudi Basic Industries Company 0 0 0 8,625 0 Seokyung Cable Television Co.,
Ltd. 2 0 0 26 169,590
Shahrad Net Company Ltd. 0 0 0 2,670 0
Sonic Wireless 5 0 0 1,265 1,218
Telefonica De Costa Rica TC,
S.A 2 0 0 1,553 2,564
We can attribute some of this to the varying demographics of the five sites’ visitors that we discussed earlier. The last halves of visitors of each of the sites’ networks are not only different among each other on a daily basis, they’re even different day over day within each of the sites. So there is a “network effect” (no pun intended) that magnifies the number of networks that participate in the community.
Something really important to remember here is that our top-down analysis showed there were roughly 30,000 last-mile networks with traffic that matters. With these five sites (on this day), we saw 2,933 last-mile networks. That’s less than ten percent of the ones that matter. How many sites would need to contribute to the community to get a significant percentage of 30,000 last-mile networks around the world?
In our entire dataset of 2,933 networks, there were 15 examples of when only one of the five sites saw a network. This represents 0.51 percent additive, meaning how many times a site sees a network that other sites do not see. Using this number, we can extrapolate out how many sites would need to be in the community, as shown in Figure 4-10.
As has been noted, the five websites I selected for our analysis garner 2,933 networks being
measured. Extrapolating out, we see 300 websites would get us 9,532 networks being monitored. It takes more than 800 web properties in such a community before you get close to the goal of 30,000 networks. This calculation does not take into consideration a number of factors that are important, such as demographics, size of site, and other important components. Even with all the warts this
method of calculation has, it is interesting to note that it would take 800 web properties implementing a RUM tag in this hypothetical RUM community before you would have more than 28,000 of the
networks covered. What this calculation also ignores is the number of measurements from each
network. As I discussed earlier, getting one measurement per day is not adequate for most of the tasks that this RUM data would be used for; having at least hourly data would be far more desirable. If we recalculated this to include hourly data as a requirement, the number of “acceptable networks” would be far lower and thereby the number of web properties that would need to deploy a RUM tag would be far higher.
Figure 4-10. The number of sites needed in a community to garner adequate coverage
Chapter 5. What Does a RUM
Implementation Look Like on the Web?
Every man’s life ends the same way. It is only the details of how he lived and how he died that distinguishes one man from another.
—Ernest Hemingway
Even though this book is ostensibly about RUM “in and of itself,” the context of RUM on the modern Internet demands that we give that primary use case a thorough working over. So, what does RUM on the Internet look like? Let’s review some of the details.
Alistair Croll and Sean Power, in their excellent book Complete Web Monitoring, detailed the six steps of RUM:
Capture
The monitoring system captures page and object hits from several sources—JavaScript on a browser, a passive network tap, a load balancer, or a server and its logfiles.
Sessionization
The system takes data about these hits and reassembles it into a record of the pages and components of individual visits, along with timing information.
Problem detection
Objects, pages, and visits are examined for interesting occurrences—errors, periods of slowness, problems with navigation, and so on.
Individual visit reporting
You can review individual visits re-created from captured data. Some solutions replay the screens as the visitors saw them; others just present a summary.
Reporting and segmentation
You can look at aggregate data, such as the availability of a particular page or the performance on a specific browser.
Alerting
Any urgent issues detected by the system may trigger alerting mechanisms.
In this section, we take a look at the first two of these. We will also look at three technologies that embody how you might go about implementing these concepts, namely how Cedexis, Pingdom, and Boomerang did so. In later sections, we look the last four items
Figure 5-1. Capturing RUM
There are pros and cons to each of these ways of capturing RUM, but here we will focus on the first option because it provides the best method to capture last-mile data. We will discuss Port Mirroring and Network Taps later along with some of the disadvantages with using those methods.
Deploying a JavaScript Tag on a Website
Figure 5-2. SaaS or build it
Later, I will discuss how collectors do what they do and how that ultimately results in reporting that matters for both backward-looking RUM and real-time RUM. But as you saw is the last chapter, RUM can result in a lot of measurements.
Deploying the Tag
A JavaScript tag is a snippet of code that is included on any page from which the site administrator wants to get measurements. As our first example, let’s look at the Boomerang tag.
Boomerang
Boomerang is a very popular open source RUM implementation developed by Philip Tellis. Quite simply it looks like this:
<script src="boomerang.js" type ="text/javascript"> </script>
<script type="text/javascript"> BOOMR.init({
User_ip: "<network ident>",
Beacon_url: http://mysite.com/beacon.php
The primary purpose of Boomerang is to beacon-back user performance from the page. Boomerang measures these things using whatever the browser supports or by using its own methods. It then sends those results back to a server you designate (http://mysite/beacon.php). We will talk more about this in the next section. SOASTA has implemented a version of Boomerang as its RUM solution (and Mr. Tellis works there) and ExtraHop has implemented integration with Boomerang as its RUM solution. In both of these cases, the user is relieved of the duty of setting up a beacon-catcher solution.
Cedexis
Another example of a RUM tag is the one deployed by Cedexis:
<script>
(function(e,c,a,g,f){ function d()
{var b=c.createElement("script");b.async=!0; b.src=
"//radar.cedexis.com/1/1/radar.js";c.body.appendChild(b)} (function()
{for(var b=[/\bMSIE (5|6)/i],a=b.length;a--;)if(b[a] .test(navigator.userAgent))return!1;return!0})()
The purpose of this tag is somewhat different. After it is loaded, it measures public infrastructure (Content Delivery Networks and Clouds) for Latency, Throughput, and Availability. It also then sends those results to servers that Cedexis has set up around the Internet to ingest and process those
measurements.
Pingdom
PingDom’s RUM implementation captures much of the same information as Boomerang but the implementation of the RUM tag is slightly different:
<Script>
var prum = [['id', '54eca1afabe53d8b6199ac0a'], ['mark', 'firstbyte', (new Date)().gettime()]]; (function() {
var s = document.getElementsbyTagName('script')[0] , p = document.createElement('script');
p.async = 'async';
p.src = '//rum-static.pingdom.net/prum.min.js'; p.parentNode.insertBefore(p,s);
})(); </script>
product and you need to set up you own server to process the transaction. As you will see in later chapters, this can be no trivial matter.
There are alternate ways to insert these tags on to pages, from tag management packages to including them in your header or footer files. In either case, the same RUM tags are deployed.
Other Examples of Web-Based RUM (SPAs and Mobile)
There are at least two examples of web-based RUM for which some different strategies must be deployed. Specifically, in these two types of web-based RUM, you cannot just deploy a RUM tag in the same way as laid out just a moment ago. Rather new methods must be devised.
The first example is a web page that never completes loading. These types of sites are often referred to as Single Page Applications (SPAs). SPAs are web apps that load a single HTML page. It then dynamically updates that page as the user interacts with the app. SPAs use a combination of AJAX and HTML5 to create fluid and responsive web apps, without constant page reloads. However, this means the heavy lifting occurs on the client side, in JavaScript. Angular.js is probably the most popular of the JavaScript library’s that support this design pattern, but there are others such as Ember.js, backbone.js, and React.
Nic Jasma of SOASTA laid out the challenges well in his blog post on the subject. He outlines the three issues that SPAs expose (which I combine into two—his third is really a summary of the first two).
The “onLoad” event no longer matters.
Technically the onLoad fires when all the static objects are completely loaded. However, in an SPA-style site, that is trivially true because all the main objects are made to be dynamically delivered by the SPA framework. As Mr. Jasma notes, this renders the use of this event in the loading meaningless because it gets fired far before the page is actually usable. In the test he ran, the onLoad event was fired up to two seconds before the page was actually usable.
Because the ‘onLoad’ event is one of the most important triggers traditionally for most
performance tools, this has also rendered those tools somewhat useless for SPA-based sites. Soft navigations are not real navigations
Because everything in an SPA site is a single page, navigations are not page-to-page; rather, they are intrapage navigations. This type of navigation is referred to as a “soft-navigation.” Because the soft-navigations around the SPA page do not initiate full-page rerenderings, the triggers that drove performance tools have become obsolete.
Although SPA is great for the performance, to quote Mr. Jasma, “soft navigations leave traditional performance analytics tools in the dark as they assume a page load happens only once per browser navigation.”
Mr. Jasma goes on to detail how SOASTA resolves these thorny issues. It’s certainly worth the read but probably not that relevant to our focus on RUM.
As early as 2013, Steve Souders called for replacing onLoad as the trigger for measuring page performance. It has taken the popularity of SPAs to get the focus to make this happen.
How does this impact the typical RUM implementation? If you deploy your RUM tag at the bottom of an SPA page, it will fire once and only once. Depending on the intent of what was being collected by the RUM, that could be a real problem. In the case of an Application Performance Monitoring tool like SOASTA, you can see that new strategies had to be deployed to collect better metrics around Page Rendering, but in any Passive RUM scenario it effects the strategy of the data collection. For instance, if you wanted to collect last-mile data and your site was 15 pages, and you moved to an SPA-based site, you would collect one-fifteenth of the data that you were collecting prior to the migration (assuming that everyone who visited your site visited every page). Thus, even here you can see that you need to deploy new methods to collect the data for all the navigations.
The second type of Internet web RUM implementations that has some unique properties is a Native Mobile App’s. These apps are written in languages like Objective C and Java, or perhaps Adobe Air using Starling and Feathers frameworks. These languages are fully compiled and do not lend
themselves to deploying tags within the app. Rather the natural implementation strategy within a fully compiled language is to implement a desired feature using an SDK or API. And, in fact, this is what many of the commercial RUM providers have done to accommodate this scenario. This is precisely what companies like SOASTA and Cedexis have done to expand their customer’s abilities to deliver RUM solutions.
References
Chapter 6. Using RUM for Application
Performance Management and Other
Types of RUM
Diversity and independence are important because the best collective decisions are the product of disagreement and contest, not consensus or compromise.
—James Surowiecki, The Wisdom of Crowds
In this chapter, we will delve even further into what people are using RUM for on the Internet. We will also note that this is not the only use of RUM, and as proof, I will discuss some RUM use cases that are very different but hopefully provide more context for this important type of measurement.
What You Can Measure by Using RUM
The types of information that can be gleaned from RUM are amazing. Focusing in on just website data (much of the focus of RUM for the past 15 years), we can see a huge variety in the types of analysis that RUM can provide. Let’s take a quick sidestep to understand some of the history of website RUM. Back in the 90s and early 2000s, companies such as Tealeaf, Wily Technologies, and Coradient were attempting to use RUM to evaluate website performance. These tools were sometimes called End User Experience Management (EUEM) and they attempted to calculated page-load time by passively monitoring HTTP transactions. Chase Snyder, (@chasews) a writer employed by Extrahop, has made this observation:
These requests and responses were put through a byzantine process of HTML parsing,
referrer/header parsing, and sessionization to determine which elements were part of the page. Eventually, the system figured out when the last element was sent to the user from the server, and used that information to calculate a theoretical page-load time.”
These companies had some really nice features like being able to play back sessions to see how
people were using the website. However, they suffered from lack of browser support and complexity. Snyder goes on to point out the main two serious drawbacks and limitations:
The processing required for calculating a theoretical page-load time based on when the last element was served was expensive in terms of computational resources.
These factors led to a rapidly diminishing return on the investment in old-school RUM/EUEM tools. However, the need to understand user experience has only intensified since then, as more business-critical operations rely on the web.
October 2010 saw the first public working draft of the Navigation Timing Specification. We will go into more details about Navigation Timing shortly, but for now what you need to know is that by December 2012, it was publicly proposed and shortly thereafter all major modern browsers adopted the standard, as illustrated in Figure 6-1.
Figure 6-1. Navigation Timing API and the browsers that supported it
This changed the face of Web RUM tools because they now had a much simpler way to get the information about browser events to report upon.
There are a number of modern commercial RUM providers. SOASTA, Cedexis, Appdynamics, ExtraHop, Gomez, Catchpoint, and New Relic are all fine examples. However, you also have the option of developing your own RUM solution. I previously mentioned the very popular open source option Boomerang maintained by Philip Tellis. He originally open sourced it when he was at Yahoo!, but is now providing ongoing maintenance and enhancements as part of his work at SOASTA for the commercial version (mPulse). There is no better source than Mr. Tellis to tell you what Boomerang does:
Boomerang uses a variety of techniques to measure page load time depending on what browsers support...Apart from page load time, boomerang also collects a bunch of other data, like
network throughput, DNS latency, memory details, etc. and it is extensible using plug-ins. Let’s evaluate some examples of reporting that you can develop.
Figure 6-2. Waterfall chart for observing page components and load times
Let’s see how that might be possible.
There are two standards that have been developed for browsers by the World Wide Web Consortium (W3C) Web Performance Working Group. As just mentioned, the first, called Navigation Timing, was put out in 2012.
Navigation Timing
Navigation Timing of the page load can be collected by using the API illustrated in Figure 6-3. There are nine stages that encompass 21 different events that take place inside the web browser loading a page. Each of the nine stages has timing-related information that can be accessed. Here are the nine stages:
1. Prompt for unload 2. Redirect
3. App cache 4. DNS lookup
5. TCP connection handshaking 6. Request
Figure 6-3. Navigation Timing API
The Navigation Timing API (sometimes called the “NavTiming API”) is just an extension of the HTML Document Object Model (DOM). It adds a “performance” object with two properties: one for timing the window load events, and one detailing the navigation sequence. The NavTiming API lets developers extract information about the timing of the page load after the page has completely loaded. The reason that a timing object was added by W3C is somewhat interesting.
In the past, developers who wanted to understand how fast their page was loading would include code on the page using the JavaScript Date object, as shown here:
var start = Date.now();
And also code at the very bottom like this:
console.log("Page load took " + (Date.now() - start) + "milliseconds");
But there is a problem with this method:
Because the code was inline, it could actually effect the load time it was intending to measure. Using the Date object, this was often inaccurate. Internet browsers update their internal time objects too infrequently and getting timing for tests below 15 ms could be wildly inaccurate. Having all these timing objects in your page was messy code.
There was still no way to measure network latency by using this method. Embedding the timers like this in the page still misses the total page load time experience that a user has when she visits a page. This is because the DNS resolution, redirects, and server response times are still left out. Because of these reasons, some developers attempted to use cookies to get this data. In other words, they would measure the time from unloading one page to loading another and store that information in a cookie. The problems here are somewhat obvious:
This does not work for first-time visits to a main page
It provides only a high-level view of latency with no detailed breakdown of why. So, for instance, you cannot tell the difference between network latency and server performance.
For these reasons, the W3C body came out with Navigation Timing to give developers the means to understand what was happening on the page.
The timing object has a timer value for each of the properties associated with each of the nine stages. Thus, if you are just interested in DNS time you can subtract domainLookupStart from
want to understand the entire page load time in milliseconds you can just subtract the navigationStart value from loadEventEnd.
As you can imagine, the Navigation Timing API was a huge boon to RUM-oriented developers. They could now measure all the timings of the page load and get very detailed reports of how their page load time was being affected. This has spawned a new generation of Application Performance Monitoring (APM) tools.
One of the shortcomings of Navigation Timing is that it only provides the metrics for the page that the user was viewing. It lacks visibility into third-party performance. Navigation Timing is great for providing root request timing and page-level metrics, but most modern web pages are rife with
external calls to other resources. These other resources on the page include CSS, JavaScript, images, and dozens of third-party components. Navigation Timing does nothing to help understanding how these are affecting page load. For some of these reasons, Navigation Timing was extended to include Resource Timing.
Resource Timing
Figure 6-4. Resource Timing API
Because this is a work on RUM (and not specifically on how to improve page load time) I won’t go into as much detail on Resource Timing. The appendix has many valuable resources listed that will provide you with much more information on this valuable topic. Suffice it to say that there is a plethora of ongoing work toward improving this standard and rolling out tools to support it.
Network RUM
Another older RUM method on the Internet is Port Mirroring. One significant disadvantage is that this method mostly will lose the last mile. For that reason, we will only touch on it here for the sake of completeness. Port Mirroring is a network feature implemented on network switches and routers, where the switch (or router) sends a copy of all network traffic from one port to another port, where the packet can be analyzed. It’s typically used by network engineers to learn what’s happening on the network. It also has been adopted by APM tools to provide additional information. All the major appliance companies support Port Mirroring in some form or another, although often under different names. For example, Cisco calls Port Mirroring SPAN, which stands for Switched Port Analyzer. 3Com switches have Roving Analysis Port (RAP). Juniper just calls it Port Mirroring (as does Netgear).
Let’s take a moment to refresh your memory of Figure 5-1.
Port Mirroring or other types of Passive RUM using the switch or router or network taps take place in the between the firewall and load-balancers (callout 2 in the diagram), or after the load balancers and in front of the servers (callout 3).
features.
A packet sniffer has similar capabilities. It can be hardware or software and has some of the following features:
Analyze network problems (hardware or software) Intrusion Detection
Regulatory compliance
Monitor network usage (including internal and external users and systems) Network Policy Compliance
Debug client/server communications and network protocol implementations
For these reasons packet sniffers and their related hardware and software friends remain popular RUM tools.
Something Completely Different: A Type of RUM for Media
—Nielson Ratings
It is important to understand that RUM is not a new idea. Rather it is an old idea with a new
implementation on the Web. For that reason I want to spend a few minutes taking a slight diversion and looking at an older RUM measurement that everyone is familiar with—Nielson ratings. Starting in 1923, the Nielson Company had developed a number of “benchmarks” using a survey method. These included industrial market surveys; consumer market surveys; an index to measure drug and retail store sales (in 1933); department store and food indexes; market share analysis for retail stores (think counting items on the shelf); liquor indexes in 1938 (after prohibition, of course); and other similar indexes. In 1936 it acquired the rights to the “Audimeter.” This was a device that (when attached to a radio) could record when it was on and, more important, to what station it was tuned. In 1942 the company launched a Radio Index.
Nielson Ratings for Radio were introduced initially measuring 20 programs in four areas: Total audience
Average audience Cumulative audience
Homes per dollar spent for time and talent
Originally data was collected using Viewer “diaries,” in which a target audience self-records its viewing or listening habits.
Later Devices were designed and distributed that connected to the Radio or TV to record if it was on and what it was tuned to. This was originally the aforementioned Audimeter, but it evolved into the Set Meter for TV and later the People Meter, allowing for more specific demographics to be recorded.
In 1972, Nielson introduced an automated data collection system and index for TV Ratings in the United States (Figure 6-5).
Figure 6-5. Happy people getting measured
In 1987, the company introduced the People Meter that added additional demographics to the data set, by requiring that the persons watching the TV enter their information. This made it possible for
Nielson to correlate age and other demographic data to TV watching.