JEJAK
Journal of Economics and Policy
http://journal.unnes.ac.id/nju/index.php/jejak
Factors Affecting the Domestic Price of Rice in Indonesia
Wawan Hermawan1, Fitrawaty2, Indra Maipita3
1Faculty of Economic and Business Padjadjaran University 2,3Faculty of Economic State University of Medan
Permalink/DOI: http://dx.doi.org/10.15294/jejak.v10i1.9133
Received:August 2016; Accepted: November 2016; Published: March 2017
Abstract
This study aims to determine the factors that have dominant influence to domestic prices of rice. Ordinary Least Square is used to run model with time series data from BPS. The results of the study we found that domestic rice production and the exchange rate have negative effect on domestic rice prices, in contrast the international rice price and the level of income per capita. Domestic production of rice and international prices of rice do not significantly affect domestic prices of rice, while the exchange rate and per capita income significantly affect domestic prices of rice respectively at the alpha level of 10 and 1 percent. Per capita income is a the greatest influence on the formation of domestic prices of rice by the estimated coefficient of 3.5985. This condition also describe the level of society's dependence on rice consumption. The high of difference of domestic price of rice with the international rice prices can be detrimental to the community while providing a strong emphasis on increasing imports of rice as well as trigger the illegal market.
Key words : Domestic price of rice, exchange rate, Income.
How to Cite: Hermawan, W., Fitrawaty, F., & Maipita, I. (2017). Factors Affecting the Domestic Price of Rice in Indonesia. JEJAK: Jurnal Ekonomi Dan Kebijakan, 10(1), 155-171. doi:http://dx.doi.org/10.15294/jejak.v10i1.9133
© 2017 Semarang State University. All rights reserved
Corresponding author :
Address: FE Universitas Negeri Medan, Jl. W. Iskandar Ps.V Medan
E-mail: [email protected]
INTRODUCTION
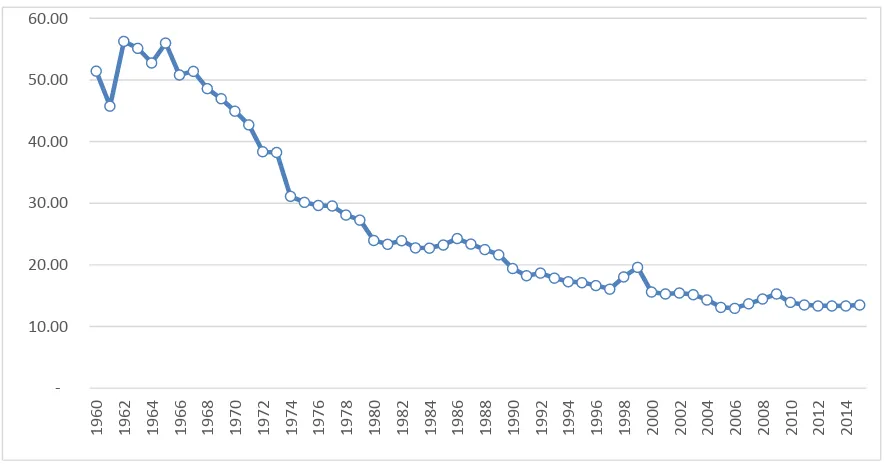
Indonesia has undergone a structural change of the economy since the 1960s. Indonesia shifted from agricultural economic structure to structure-based industries. Contribution of the agricultural sector is greater than 50 percent of Indonesia's GDP up to 1967. Beginning in 1968, the agricultural sector's contribution to GDP has a tendency to continue to fall until 2015. Figure 1 shows the contribution of agriculture sector to GDP Indonesia at current prices. Trends in agricultural sector contribution to GDP continues to decline indicates an increase in output in sectors other than agriculture. In 1998 Indonesia experienced a severe economic crisis. Economic growth fell 13.1 percent, but the agricultural sector to grow faster than usual. Agricultural sector's contribution to GDP in 1998 grew significantly. One of the best sector to face the crisis in 1998 is agriculture sector. Agriculture sector lead the economy to make Indonesian move up and still get the positive growth in
Indonesian economy.
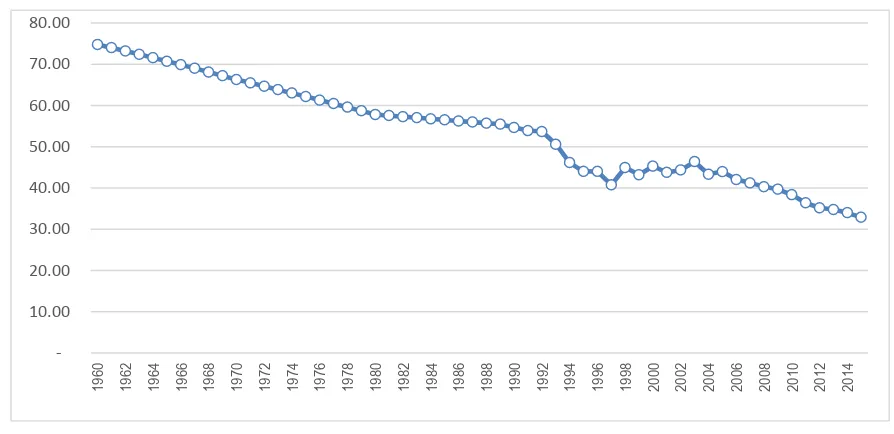
Changes in economic structure can also be seen from the main job of changes. The agricultural sector absorbing labor up to 74 percent in 1960. In 2015, employment in the agricultural sector only reached 32.88 percent. Figure 2 shows the decline in employment in the agriculture sector in Indonesia in 1960 until 2015. There was a shift in employment in other sectors, in addition to the agricultural sector. This is understandable, value added in the agriculture sector in addition to the larger and more sectors that could get added value in a short time compared with the agricultural sector. The transfer of human resources to other sectors, which fell by percentage, but sufficiently offset by growth in population. However, the additional amount of work in the agricultural sector is not as big as the additional number of people working in non-agricultural sectors. It is still in accordance with the amount of agricultural land are likely to remain, or much change in land use to be a function other than for agriculture.
Source: BPS
Figure 1. Share of Agriculture Sector to GDP at Current Prices (%).
10.00 20.00 30.00 40.00 50.00 60.00
Source: BPS
Figure 2. People Working In The Agricultural Sector (%).
Economic development is done by emphasizing the development of the agricultural sector. Strengthening the agricultural sector continues to be done during the five-year development (PELITA) in the era of the Orde Baru regime, led by the second president of the Republic of Indonesia, Soeharto. The golden age of this era, Indonesia experienced a period of food self-sufficiency (Swasembada Pangan) that President Soeharto was named the Father of Development. Strengthening the agricultural sector continued to drive economic development based industrial sector. The era of modern development that is expected to occur at the time of Indonesia has a strong industrial sector.
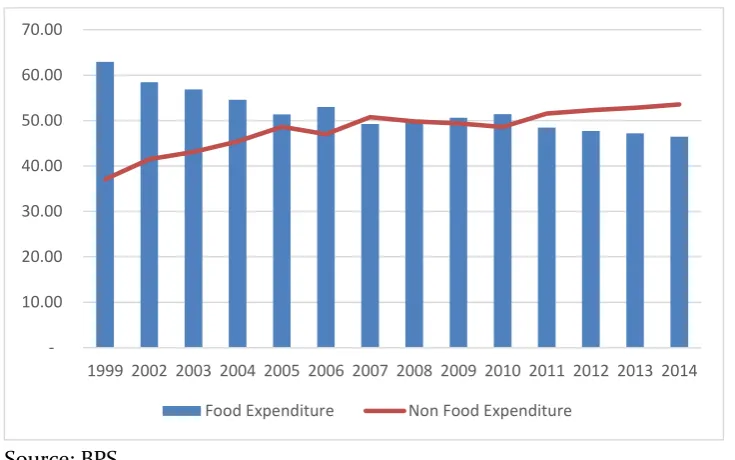
Changing economic structure seen from the agricultural sector's contribution to GDP and employment in agriculture and non-agriculture has changed the pattern of household consumption expenditure. Percentage of Average Expenditure per Capita per month According to the Group of which is divided into two large, namely the expenditure for food and non-food
expenditure. The percentage of average expenditure per capita in 1999 to reach 62.94% of food spending, in the following years there was a tendency down the composition of expenditures for food. In contrast, spending on non-food increased composition of 1999 which only amounted to 37.06 percent to 53.55 percent in 2015. Figure 3 shows the trend of expenditure for food continue to fall throughout the year 1999-2014.
Most of the Indonesian expenditure per capita still expend for food (Figure 3), Food is a primary need that must be met to make people survive (Widayaningsih and Barokatumunalloh, 2016). Despite the declining trend, from 1999 to 2014 the share of expenditure on food is still above 40 per cent of the total expenditure made. This expenditure profile shows the elasticity of the food items are still not income elastic.
Source: BPS
Figure 3. Percentage of Average Expenditure per Capita per Month by Type of Expenditure
Rice consumption is a major commodity in the calculation of commodity packages of food needs by BPS (Maipita, 2014). In addition, rice is the main commodity and has a big influence to the poverty line (CBS, 2013). This is due to the poor, fulfilling the needs for survival becomes the primary. Spending on food is a priority can even spend all the income of a head of household. If spending on food is reduced, meaning that can meet the spending on clothing and other primary expenditure. At the time this happens, then an increase in welfare for a family.
When we look at the movement of the price of rice in the Indonesia from January to April 2015, the price looks fluctuate as shown in Figure 4. Fluctuations in the price of rice will have an impact on people's purchasing power (Shrestha, and Chaudhary, 2012), and ultimately impact on poverty levels. When the price of rice increased, the share of income spent on food (rice) will also be increased (De Hoyos and Medvedev, 2009). People who are slightly above the poverty line will be able to fall below the poverty line. The increase in rice
prices have a large impact on the increasing contribution of food expenditure of total family income. The fulfillment of primary needs, such as for clothing and expenditure on health will lose priority to food expenditures. Impact of derivatives by increasing the number of poor people.
Fluctuations of the price of rice in Indonesia is the caused by many things, for example: (1) structural factors and cycles, (2) factors of supply and demand, (3) international and domestic markets (ADB, 2008), (4) climate, (5) distribution, (6) the exchange rate, and more. The period of the rice harvest are factors that play a great role in price changes. Much of supply of rice were great at providing a decrease in the price of rice, so that rice prices could fall due to an oversupply. The price of rice in Indonesia was also affected by some of the policies of the Ministry of Agriculture and the President's policy in influencing the stock and the price of rice in Indonesia. Rice import policy is a policy for the reduction in the price of rice with the flood of supply of rice which cost less than the market price.
10.00 20.00 30.00 40.00 50.00 60.00 70.00
Souce : BPS
Figure 4. The Trend Movement of Price of Rice in medium January-April 2015 (Rp/Kg).
The amount of family spending on consumption is influenced by many factors, such as: the level of income, level of prices, interest rates, and expectations for the future. According to the theory of Keynes' consumption, the consumption level is strongly influenced by a person's income level. That is, when prices rise, the purchasing power is going down because the amount of money that must be spent to maintain the same level of consumption should increase. When the level of fixed and limited income, the amount of goods consumed should be reduced. Reduction of purchasing power and consumption will reduce the level of social welfare. For people who are slightly above the poverty line, this condition can shift them below the poverty line. When this happens, the poverty rate would increase.
Poverty is still a crucial issue and a very complex phenomenon to any country (Hung and Makdissi, 2004; Marianti and Munawar 2006; Maipita et al, 2010, 2014, 2016; Jantan et al 2012). Even Poverty Alleviation has been the primary goal of public policy in almost all industrialized countries (Moller, et al, 2003). Empirical evidence from various studies indicate that the rice price increase will have
an impact on the purchasing power, poverty and inequality (Shrestha, and Chaudhary, 2012; De Hoyos and Medvedev, 2009; World Bank, 2008; Save the Children, 2009; Ravalion and Walle, 1991; Minot and Goletti, 2000).
On the other hand, Indonesia was in a condition known as "demographic bonus" (MP3EI, 2011; Maipita, 2014). The dependency ratio is relatively small. This means that at this time until the next few decades Indonesia has the working age population is quite large compared with children and old age. Increasing the working age population indicates that there will be an increase in consumption. The consumption of productive age will be higher than people who are not productive. This means that the demand for rice as a staple food of Indonesian society will also increase.
RESEARCH METHODS
The demand for rice in the form of the function of the price, is influenced by the price of the rice itself and the level of income. In other words, the demand for rice is affected by price and income levels. However, for the case of rice in Indonesia, the prices are very influenced by harvest or production of rice in domestic and
9.2 9.4 9.6 9.8 10 10.2 10.4 10.6 10.8
international rice prices. This is because Indonesia still require imports to keep domestic demand for rice. Therefore, in theory, the exchange rate also affect the price formation. Thus, the price of domestic rice P* : International price of rice GDPK : GDP per capita
t : Year
The model in equation (1) is useful to get the behavior of the price of rice by using annual data from 2000 to 2014. The estimated coefficients of equation (1) will give an overview of the behavior (business as usual) on changes in independent variables, namely production rice, exchange rate, international prices and per capita income. Furthermore, the simulation of the significant variables by raising and lowering the value of the value of each variable (in percent) each year from 2015 to 2020 with a baseline year 2014. Furthermore, we will see the impact of each simulation of the domestic rice price. The value obtained from the simulation of the geometric mean of the growth of each variable during the years 2000-2014.
RESULTS AND DISCUSSION
Domestic Price Rice Pattern
ASEAN member countries plays an important role in world rice trade. ASEAN member countries are largely a producer (exports) rice except Indonesia and the Philippines (net imports). Approximately 53
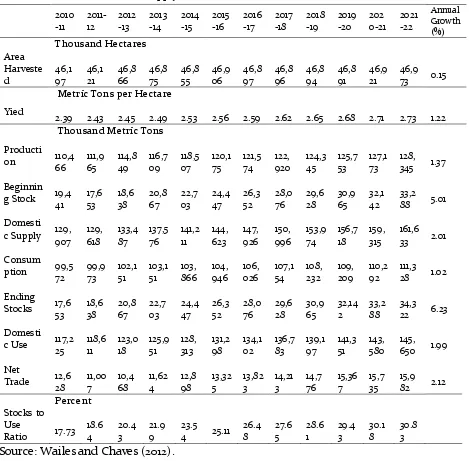
percent of total exports and 19 percent of total imports and 22 percent of total world rice consumption is done by the member countries of ASEAN (Wailes and Chaves, 2012). The data of rice production and consumption of the 10 member countries of ASEAN by the year 2022 are shown in Table 1.
Rice producer in ASEAN as well as India, Pakistan, and the United States play an important role in determining the international rice prices. The period 2000 to 2014, rice price movements both domestic prices and international prices tend to rise as shown in Figure 5. Furthermore it appears that there is a relatively large difference between the prices of domestic rice premises international rice prices for average quality rice. Economically, these conditions lead to export as well as because it is needed for domestic demanders higher than the existing production.
Table 1. Total Rice Supply and Utilization of 10 ASEAN Countries 2010-2022
Source: Wailes and Chaves (2012).
The higher the difference between the price of domestic rice at an international rice prices on the one hand more and trigger an increase in imports and this would be detrimental to domestic farmers. While on the other hand, policies that restrict imports of rice would be detrimental to the public because they have to pay a higher price than the world market price, in addition also will trigger a black market (smuggling).
Source: BPS calculated; Pd = The Domestic Price of Rice, Pi = The International Price of Rice
Figure 5.
The Domestic Price of Rice and International Price of Rice (USD / kg) with average
Quality.
From Table 2 and equation (2) note that domestic rice production variables did not significantly influence the price of domestic rice. In other words, the period of 2000-2014, regardless of the number of domestic rice production is not able to significantly influence the price of rice in the country. This is due to several things, such as: (1) during the period of study, the number of domestic rice production is too little compared to the needs that cannot affect the stock of rice which eventually also unable to influence the price, (2) although the harvest occurs, decrease price only occur at the farm level, namely in the form of a decrease in grain prices, but the price of rice in general in society tend to have no effect, (3) to fulfill the lack of rice supply (meet demand) is done by rice imports at
more competitive prices (lower), ( 4) system guarantees the price of grain at the farm level has not been done optimally, (5) the level of 2015a), (8) infrastructure that rice production has not been optimized resulting in high cost of production and distribution becomes uneven.
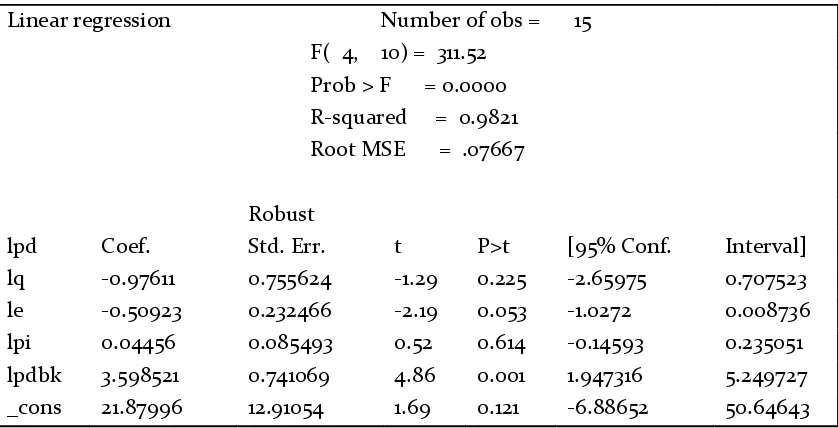
From the estimation results in Table 2 was obtained domestic rice price equation as shown in equation (2).
Table 2. Estimation Results of Domestic Price of Rice Linear regression Number of obs = 15 F( 4, 10) = 311.52 Prob > F = 0.0000 R-squared = 0.9821 Root MSE = .07667
Robust
lpd Coef. Std. Err. t P>t [95% Conf. Interval]
lq -0.97611 0.755624 -1.29 0.225 -2.65975 0.707523
le -0.50923 0.232466 -2.19 0.053 -1.0272 0.008736
lpi 0.04456 0.085493 0.52 0.614 -0.14593 0.235051 lpdbk 3.598521 0.741069 4.86 0.001 1.947316 5.249727 _cons 21.87996 12.91054 1.69 0.121 -6.88652 50.64643
The sign of the coefficients in equation (2), it is known that variable of domestic rice production (domestic), and the exchange rate have negative effect on domestic prices of rice, while international prices of rice and the level of per capita income of the people have positive influence on the price of domestic rice. This means that if there is an increase in domestic production and if there is an increase the value of Exchange Rate (Rp / USD), then the domestic price will decline, and vice versa. Meanwhile, when international prices of rice and rising per capita income levels, it can push up domestic prices of rice. The signs of negative coefficient rice production may mean that if there is an increase rice production by one percent would reduce domestic rice prices by 0.98 percent. This figure is quite realistic although not significant at the alpha level of 10 percent. It is interesting that although the international price of rice is much cheaper than domestic rice prices, but according to the results of the regression in equation (2), international rice prices do not significantly affect the price of domestic rice. This is due to government policies that restrict imports of
rice so that even international rice prices are relatively low, but not necessarily be able to easily get into the country. Such a policy is relatively ineffective in protecting producers of rice (rice farmers) domestic (Bowo et al, 2016), but on the other hand could harm consumers because they have to buy at higher prices.
Various studies show that developing country imports from developing countries are largely influenced by changes in prices and exchange rates (exchange rate). Fluctuations in prices and exchange rates had a negative and significant effect on imports of agricultural products such as soybeans, corn and rice are imported from developing countries (Haque, 2012). This is due to limited access and trade policies such as restrictions on exports / imports (IFRI, 2011). Other researchers such as Kandilov (2008), Arize and Slottje (2008) also found similar negative effects.
does not significantly affect the price of rice in the country.
The rupiah exchange rate against the dollar showed a significant effect on the price of domestic rice. The coefficient value of -0.5092 indicates that when there is an increase of rupiah exchange rate against the dollar or a weakening rupiah against the dollar (depreciation) of one percent, then the domestic rice price will go down by 0.51%. This contrasts with the theory that the increase in import prices should divert demand for domestic goods. This means that in this case the rise in import prices as a result of the depreciation of the rupiah is not the price of rice domestically to be cheaper than international rice prices, in other words, international prices of rice remain cheaper and demand for cheaper prices remain high.
These findings are in line with studies Tulasombat et al (2015) that the exchange rate affect the volume of foreign trade. The world trading system that is more open and the level of production in importing countries increasingly efficient cause the price of food products in the country are affected (Ministry of Trade of RI, 2015). Bowo et al (2016) conducted a study to test the competitiveness and government policies on rice, corn and soybean farming in Central Java province, found that profitability and competitiveness of farmers are sensitive to fluctuations in the exchange rate against the dollar and changes in international prices.
The behavior of the exchange rate of the domestic price of rice in line with the international price of rice variable. The increase in the international price, assuming constant exchange rates, shows the coefficient were positive but not significant in affecting change in the price of domestic rice. The coefficient of 0.05 indicates that changes
in international prices of rice do not change the price of domestic rice.
The last variable is income per capita. This variable conveniently indicates that large and significant influence on price changes of domestic rice. If there is an increase in per capita income by one percent of domestic rice prices to be increased by 3.6 percent. This coefficients shows the high level of price elasticity of rice to per capita income (elastic). Although, according to the study Wailes and Chaves (2012) that supply of rice and demand are inelastic in the largely Asian countries.
This finding is consistent with the condition of Indonesian society that about 80 percent of the total population are consumers of rice and was ranked 5th in the world for per capita consumption of rice calories (Ministry of Trade RI, 2015a). Over 50 per cent of the total expenditure of around half of Indonesia's population is used for food expenses, and approximately 17 percent of all spending for 20 percent of the lowest-income population used to consume rice (World Bank, 2010).
Simulations
Simulations carried out by trying to increase or decrease the variables that affect the domestic price of the above equation. The increase or decrease in the simulation is the geometric mean of the growth during the period 2000 to 2014. The simulations will be conducted by partial way in which only change one variable by increasing or decreasing the percentage change of each variable.
independent variables affect the dependent variable statistically. Other variables are assumed no change, so that impacts that occur only show the effect of one variable on the dependent variable.
The first simulation was done by raising and lowering the value of the rupiah against the dollar by 1.87 percent per year from a year earlier. The value obtained from the simulation of the average geometric growth of these variables during the years 2000 to 2014. The use of the geometric mean is taken to show the movement patterns of the average of the variable value of the rupiah against the dollar and the per capita income. The results of this simulation are shown in Table 3.
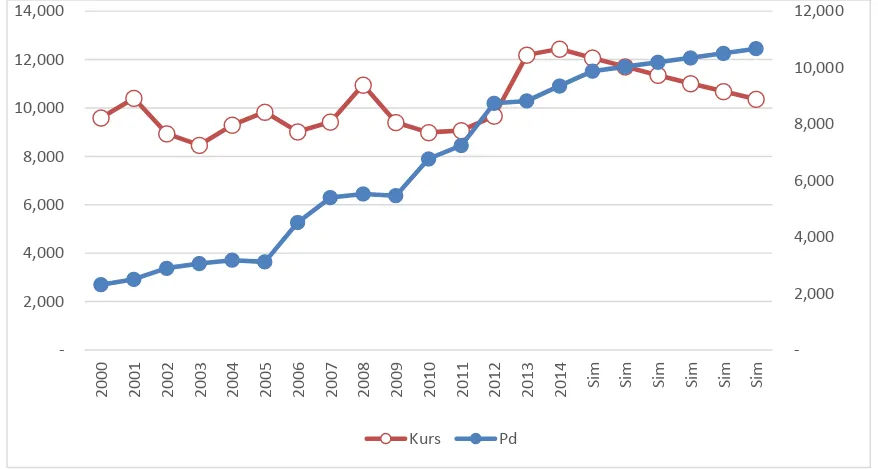
Generally, when the exchange rate increased (the value of the rupiah weakened or depreciated against the dollar), the decline of the domestic rice price. This condition is consistent with the findings in the estimation of equation (2). Although the impact of
exchange rate changes on domestic rice prices is relatively small, but statistically significant according to equation (2).
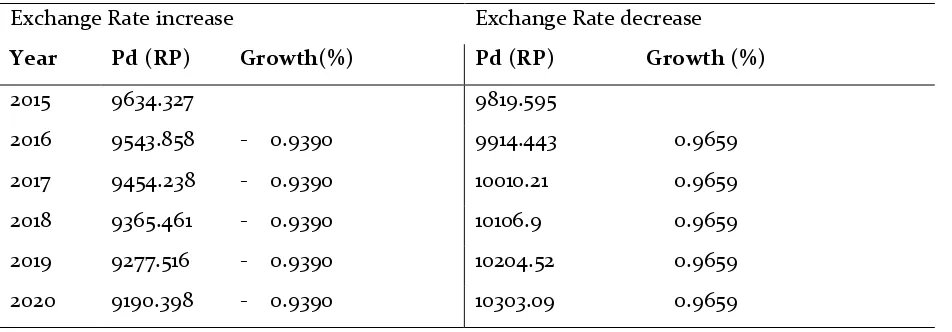
The average of increase in the exchange rate of 1.87 percent per year from the previous year in 2020, led to a decrease in the average domestic price of rice by 0.94 percent (an average of USD 88.79 / Kg). If the rise in the exchange rate per year occurred at 1.87 per cent until 2020, then the price of domestic rice in 2020 is estimated to be US $ 9190.38 / kg, down from Rp 443.93 / Kg of rice prices in 2015. Visually, the results simulating rise in exchange rate on the price of domestic rice shown in Figure 6.
Conversely, a decline in the rupiah against the dollar or rupiah appreciation, causing domestic rice prices tend to rise. This condition is shown in Figure 7, which shows a simulation in the event of a decrease in the exchange rate with other variables constant. This way to see the opposite effect of exchange rate movements on the domestic rice price.
Table 3. Simulation Results Increase and Decrease in Exchange Rate Against Domestic Rice Price
Exchange Rate increase Exchange Rate decrease
Year Pd (RP) Growth(%) Pd (RP) Growth (%)
2015 9634.327 9819.595
2016 9543.858 - 0.9390 9914.443 0.9659
2017 9454.238 - 0.9390 10010.21 0.9659
2018 9365.461 - 0.9390 10106.9 0.9659
2019 9277.516 - 0.9390 10204.52 0.9659
2020 9190.398 - 0.9390 10303.09 0.9659
Source: Data Processing; (Kurs = Exchange Rate; Pd = Domestic Rice Price)
Figure 6. Simulation Results Increase in Exchange Rate (US $ / US $) against Domestic Rice
Price.
Source: Data Processing; (Kurs = Exchange Rate; Pd = The domestic rice price)
Figure 7. Simulation Results Decrease in Exchange Rate (US $ / US $) Against Domestic Rice
Price
When a decline in the exchange rate is continuously at 1.87 percent per year, the price of rice will increase by an average of 0.97 percent per year. The small impact of exchange rate on prices of rice in accordance with the
results obtained in the regression equation (2). If the exchange rate continues to decline in the same amount in 2020 (ceteris paribus), then in 2020 the price of rice is estimated to be Rp10,303.09 / kg, an increase of Rp 483,495 /
2,000 4,000 6,000 8,000 10,000 12,000
2,000 4,000 6,000 8,000 10,000 12,000 14,000 16,000
2000 2001 2002 2003 2004 2005 2006 2007 2008 2009 2010 2011 2012 2013 2014 S
im Sim Sim Sim Sim Sim
Kurs Pd
2,000 4,000 6,000 8,000 10,000 12,000
2,000 4,000 6,000 8,000 10,000 12,000 14,000
2000 2001 2002 2003 2004 2005 2006 2007 2008 2009 2010 2011 2012 2013 2014 S
im
S
im
S
im
S
im
S
im
S
im
Kg. From Table 3 shows that the increase in the exchange rate is greater than the absolute value of the domestic rice price decline, or increase in the exchange rate is 1.87 percent only responded by a decrease in domestic rice prices by a much smaller response, which is 0.94 percent. Likewise, the decline in the exchange rate of the same magnitude, responded smaller by the increase in domestic rice prices. In other words, the exchange rate is price-inelastic domestic rice. This condition is due to the market does not work well (not perfect) or in other words avoid distortion of the market. The increase and decrease in the exchange rate are not necessarily able to affect the price of domestic rice well, because the Indonesian rice market intervention by the government. When the rupiah appreciated, not necessarily the rice can be imported from abroad despite international rice prices are much cheaper because of imported rice is strictly regulated by the government. The second simulation is done on the variable income per capita, by raising and lowering the value of these variables by 3.9 percent. The simulation results are summarized in Table 4.
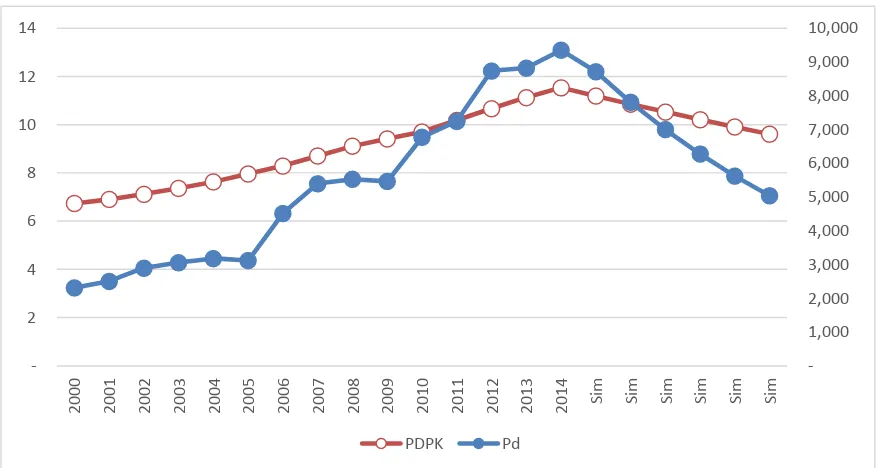
According to equation (2) that the per capita income of the domestic rice prices have a direct relationship. That is, if the level of income per capita rises, the domestic rice prices
will also rise through increased demand. Conversely a decrease in per capita income will reduce the price of domestic rice. Visually, the results of this simulation are shown in Figure 8 and 9.
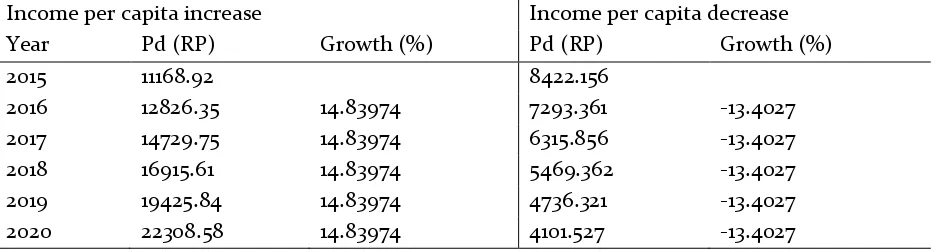
If the per capita income rose by 3.9 percent from 2014 (assuming the other is remain constant), then the price of rice will increase to Rp 11,168.92 / Kg in 2015. And when the per capita income levels have continued to rise by the same amount until 2020, the price of rice would be USD 22,308.58 / Kg in 2020. in other words, the price of rice will increase twice the price in 2015. the average increase in per capita income level of 3.9 percent per year will raise domestic rice prices by an average of 14.8 percent per year.
When Table 4 we look more closely, it would appear that the domestic rice price hike due to rising per capita income levels vary annually. In 2016, there was an increase in price by USD 1657.44 / Kg, then in 2017 the increase in the price to USD 1903.40 / kg from 2016, in 2018, the price increase to Rp 2185.86 / kg and so on until 2020 an increase in the price of Rp 2882.74 / Kg of 2019. in other words, the period of the simulation, domestic rice price hike due to rising per capita income levels continue to rise.
Table 4. Simulation Results Increase and Decrease Income per Capita Against Domestic
Rice Price
Income per capita increase Income per capita decrease
Year Pd (RP) Growth (%) Pd (RP) Growth (%)
2015 11168.92 8422.156
2016 12826.35 14.83974 7293.361 -13.4027
2017 14729.75 14.83974 6315.856 -13.4027
2018 16915.61 14.83974 5469.362 -13.4027
2019 19425.84 14.83974 4736.321 -13.4027
2020 22308.58 14.83974 4101.527 -13.4027
Source: Data Processing; (PDPK = income per capita; Pd = the domestic rice price)
Figure 8. Simulation Results Income Per Capita (Million) Against Domestic Rice Pric
Source: Data Processing; (PDPK = income per capita; Pd = the domestic rice price)
Figure 9. Simulation Results Decrease in Revenue Per Capita (Million) Against Domestic Rice
Price.
From figure 8 shows that the per capita income decline by an average of 3.9 percent per year would lower domestic rice prices by an average of 13.4 percent per year, assuming the others constant. If the decline in per
capita income occurs continuously per year by 2020, the domestic rice price will also decrease every year until 2020. In 2020, domestic rice prices have been reduced by more than half the price in 2015, from Rp 8422 , 156 / kg to Rp
1,000 2,000 3,000 4,000 5,000 6,000 7,000 8,000 9,000 10,000
2 4 6 8 10 12 14
2000 2001 2002 2003 2004 2005 2006 2007 2008 2009 2010 2011 2012 2013 2014 S
im Sim Sim Sim Sim Sim
PDPK Pd
2,000 4,000 6,000 8,000 10,000 12,000 14,000 16,000 18,000 20,000
2 4 6 8 10 12 14 16
2000 2001 2002 2003 2004 2005 2006 2007 2008 2009 2010 2011 2012 2013 2014 S
im Sim Sim Sim Sim Sim
4,101,527 / Kg. The decline in the price of rice per year from 2014 to 2020 also varied. The highest price decrease occurred from 2014 to 2015, amounting to US $ 1128.79 / kg, while in 2016 a decrease of USD 977.51 / Kg of 2015, and in 2017 decreased by Rp 846.49 / Kg of year 2016. In 2020 the decline in prices is smaller than the previous year, amounting to Rp 634.79 / Kg. The simulation result shows that when per capita income continued to decline by a fixed percentage, then the price of rice will also continue to decline (due to lower levels of demand for rice), with the rate of decline in prices is getting smaller. This can be explained that the decline in household income levels will reduce the demand for rice, which eventually attractively priced to go down. However, because rice is the staple food, then at a certain level regardless of the low income households, will still require a (purchase) of rice to meet their needs. In this condition, despite the low income levels of quantity demand for rice will no longer be reduced.
CONCLUSION
From the results of the study above, we can conclude several things, as follows. Price of rice trend shows that domestic prices of rice tend to be more expensive than the price of international rice. The difference between the two prices as converging further. It needs to become the government's attention as it can be triggered an increasing rice imports, while on the other hand can be detrimental to the community are mostly role as the consumer of rice.
Variable of domestic rice production and international prices do not significantly affect the price of domestic rice, in contrast with the variable rate and per capita income
levels of society. The regression results show that changes in rice production in Indonesia is not able to affect change in the price of domestic rice (not significant to the price of domestic rice). Therefore, government policies need to protect the public both as farmers and as consumers.
The rupiah exchange rate against the dollar as well as the per capita income level of the community showed a significant effect on the price of domestic rice, even level of income changes is elastic to the domestic rice price. This condition reflects the level of dependence on rice consumption of Indonesian society.
To maintain stability and affordability of domestic rice prices, the increase in the quality of infrastructure to support the sectors of rice, rice valid data provision, the efficiency of production and distribution of rice among regions should be a concern of the government. Also need proper formulation of trade policy, especially for imported rice.
REFERENCES
Arize, A, T. O and D.J. Slottje. (2008). Exchange-Rate Volatility In Latin America And Its Impact On Foreign Trade. International Review of Economics and Finance 17(1):33–44.
Asian Development Bank (ADB). (2008). Food Prices and Inflation in Developing Asia: Is Poverty Reduction Coming to an End? Economics and Research Department, Paper prepared by a team led by William E. James, ADB. April 2008.
Bowo, P., Nurayati, A., & M. Imleesh, R. (2016). Analysis of Competitiveness and Government Policy on Rice, Corn and Soybean Farming. JEJAK: Jurnal Ekonomi Dan Kebijakan, 9(2), 159-169. doi:http://dx.doi.org/10.15294/jejak.v9i2.8235 BPS (Badan Pusat Statistik). (2013). Profil Kemiskinan di
Indonesia September 2012. Berita Resmi Statistik No. 06/01.ThXVI, 2 Januari 2013. Badan Pusat Statistik. BPS (Badan Pusat Statistik). (2013). Profil Kemiskinan di
Indonesia Maret 2013. Berita Resmi Statistik No. 47/07.Th.XVI, 1 Juli 2013. Badan Pusat Statistik. De Hoyos, R. E. and Medvedev, D. (2009). Poverty Effects of
Research Working Paper No. 4887. The World Bank, Washington DC.
Haque, A.K. Iftrkharul. (2012). The Effect of Exchange Rate and Commodity Price Volatilities on Trade Volumes of Major Agricultural Commodities. A Thesis. University of Guelph, Canada.
Hung, Nguyen Manh, and Paul Makdissi. (2004) . Escaping the Poverty trap in a Developing Rural Economy. The Canadian Journal of
economics/Revue Canadienned’Economique. Vol.
37(1). Feb, 2004: 123-139.
IFPRI. (2011). 2011 Global Food Policy Report. Washington, D.C.: International Food Policy Research Institute.
Jantan, M. D., I. Maipita, Fitrawaty, dan I. Hamdani. (2012). The Impact of Diverting a Fuel Subsidy to the Agricultural Sector on Income Distribution and Poverty. The International Journal of Interdiciplinary Environmental Studies 7(2): 1-13. Kandilov, I. (2008). The Effects of Exchange Rate
Volatility on Agricultural Trade. American Journal of Agricultural Economics 90(4): 1028-1043.
Kementerian Perdagangan RI. (2015). Laporan Akhir Analisis Dampak Kebijakan Pemerintah terhadap Inflasi dan Kemiskinan. Pusat Kebijakan Perdagangan dalam Negeri. Badan Pengkajian dan Pengembangan kebijakan Perdagangan Kementerian Perdagangan RI.
Kementerian Perdagangan RI. (2015a). Laporan Akhir Kajian Efektivitas Kebijakan Impor Produk Pangan Dalam Rangka Produk Pangan. Pusat Kebijakan Perdagangan dalam Negeri. Badan Pengkajian dan Pengembangan kebijakan Perdagangan Kementerian Perdagangan RI. Maipita, Indra. (2014). Mengukur Kemiskinan dan
Distribusi Pendapatan. Yogyakarta: UPP STIM YKPN.
Maipita, Indra., Moh. Dan Jantan., and Nor Azam Abdul Razak. (2010). The Impact of Fiscal Policy Toward Economic Performance and Poverty Rate in Indonesia. Bulletin of Monetary Ecomomics and Banking, Bank Indonesia 12(4): 391-424.
Maipita, Indra., Wawan Hermawan, dan Fitrawaty. (2012). Reducing Poverty Through Subsi- dies: Simulation of Fuel Subsidy Diver- tion to Non-Food Crops. Bulletin of Monetary Ecomomics and Banking, Bank Indonesia 14(4): 369-387. Maipita, Indra., Wawan Hermawan, Fitrawaty, and Budi
Eko Soetjipto. (2016). The Impact of Middle Class Spending on Economic Growth and Industry in
Indonesia. International Journal of Economics Research. Serial Publication. Vol. 13(3): 813-828. Marianti, R, dan wawan Munawar, W. (2006). Moving Out
of Poverty: The case of Desa Branta Pesisir, Pamekasan Regency. SEMERU Research Institute. Minot, N. and Goletti, F. (2000). Rice Market Liberalization
and Poverty in VietNam. Research Report 114, International Food Policy Research Institute, Washington DC.
Moller, Stephanie., evelyne Huber, John D. Stephens, David Bradley, and Francois Nielson. (2003). Determinant of relative Poverty in Advanced Capitalist Democracies. American Sociological Review, Vol. 68(1): 22-51.
MP3EI, Kementerian Koordinator Bidang Perekonomian. 2011. MasterPlan Percepatan dan Perluasan Pembangunan Ekonomi Indonesia 2011-2025 (MP3EI). Kementerian koordinator Bidang Perekonomian Republik Indonesia.
OECD. (2015). OECD Economic Survey: Indonesia 2015. Ravallion, M. and van der Walle, D. (1991). The Impact on
Poverty of Food Pricing Reforms: a Welfare Analysis for Indonesia. Journal of Policy Modeling13(2): 281-99.
Save the Children, (2009). How the Global Food Crisis is Hurting Children: The Impact of the Food Price Hike on a Rural Community in Northern Bangladesh. Save the Children UK, London.
Shrestha M.D, and Chaudhary, S.K. (2012). The Impact of Food Inflation on Poverty in Nepal. NBR Economic Review.
Syaifullah, Yunan. (2013). Ketahanan Pangan dan Pola Distribusi Beras di Propinsi Jawa Timur. JEJAK Journal of Economics and Policy, 6 (2): 103-213 doi: 10.15294jejak.v7i1.3596.
Timmer, C. (2014), Rice price stabilization in Indonesia: A century-long perspective (Stabilisasi harga beras di Indonesia: Perspektif satu abad), presentasi dalam konferensi Bank Dunia Volatilitas Harga Pangan, Ketahanan Pangan dan Kebijakan Perdagangan, 18-19 September.
Tulasombat, Sirikul., Chanchai Bunchapattanasakda, Somchai Ratanakomut. (2015). The Effect on Exchange Rates on Agricultural Goods for Export: A Case of Thailand. Information Management and Business Review. Vol. 7(1): 1-11.
Wailes, Eric J., Eddie C. Chaves. (2012). ASEAN and Global Rice Situiation and Outlook. ADB Sustainable Development Working Paper Series. No.2. Agustus 2012.
Kebijakan, 9(1): 111-128.
World Bank. (2010). Perkembangan Triwulan Perekonomian Indonesia: Melihat ke Masa Depan. The World Bank.