THE INTEGRATION BETWEEN INDONESIA AND
WORLD RICE MARKET
Written By:
Hariyati, Yuli and Sugeng Raharto Agribusiness Study Program
Faculty of Agriculture - University of Jember As a Keynote Speaker
In International Seminar Indonesian Students in ASEAN On 28-29 October 2011, Bangkok, Thailand
ABSTRACT
The availability of rice in Indonesia is a very strategic role in this country. The availability of rice Indonesia has a relationship with the world rice market because of the role of Indonesia as one of the large rice importer in the world. Imports by Indonesia increasingly become sutu dependence for Indonesia. The availability of rice was more associated with the state of the world rice market. This study aims to analyze: (1) the factors that affect the supply, demand and price of rice in Indonesia, (2) association of the world rice price to the availability of rice in Indonesia, (34) conditions availability of Indonesia's rice imports if there is a change of export rice in major exporting countries and importers. This study uses secondary data years 1980-2008 and analyzed through a system of simultaneous equations econometric model with the 2SLS method, then proceed with the validation of simulation models for analysis. The results showed that: (1) Factors that affect the supply of rice Indonesia from 1998 until 2008 Indonesia was the productivity of rice and fertilizer prices (2) Factors that influence the demand for rice Indonesia from 1998 until 2008 is the price of domestic rice and a population of Indonesia, (3) the world price of rice has been linked to the availability of rice in Indonesia, (4) The change in price and quantity of exports in Thailand, as well as changes in price and quantity of imports in Cote D'Ivoire keep the conditions of supply of surplus rice in Indonesia .
Keywords: availability of rice Indonesia, the world rice market, econometric models, and simulations of policy.
INTRODUCTION
Background Issues
Rice is an important commodity because it is a staple food needs must be met at all times. Staple food requirements necessary to arrange their availability in sufficient quantity, good quality, safe, and easily available at prices affordable by all levels of society. Therefore, the main objectives of agricultural development to establish the balance of availability of rice (Nurmalina, 2007).
Asia still dominates in the field of production, consumption and world rice trade. Indonesian rice production to take share of approximately 9% of total world production. Indonesian rice producing countries of the world third largest, after China (30%) and India (21%). However, the last two countries are net exporters of rice, in contrast to Indonesia becoming a net importer of rice since the late 1980s. (Sawit, 2007).
The price for something and the number of traded goods is determined by demand and supply of goods. Pricing mechanism and quantity of goods traded obtained upon analysis of demand and supply of a particular item in a market. The situation in a market said to be in balance or equilibrium if the amount offered by the seller at a specified price is equal to the amount requested of the buyer at that price. Prices of goods and the transportation of goods or commodities from one country to another country legally, generally in the trading process.
Export process in general is an act to remove the goods or commodities of the country to put it into another country. Exports of goods generally require the intervention of customs in the countries sending and receiving countries.
Import is the process of transportation of goods or commodities from one country to another country legally, generally in the trading process. The process generally is the act of entering the import of goods or commodities from other countries into the country. Imports of goods generally require the intervention of customs in the country of the sender or receiver (Ahmeth, 2010).
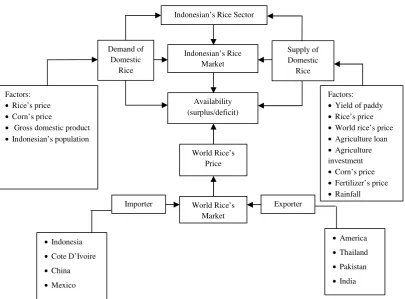
Thinking Framework
Indonesia's rice sector is closely related to the supply, demand, and the Indonesian rice market. Where those three things will
affect the condition of availability of rice in Indonesia. While the conditions of supply of rice in Indonesia is strongly influenced by the world rice price and the
Figure 1.Scheme of Thinking Framework
Indonesian’s Rice Sector
Indonesian’s Rice
• Gross domestic product •Indonesian’s population
world rice market. This is because Indonesia is one of the major rice importers in the world. Other rice importing countries are also large Cote d’Ivoire, China, and Mexico. While the major rice exporting countries in the world are the United States, Thailand, Pakistan, and, India. A change in the sector will change the world rice market situation in Indonesia's rice sector.
HYPOTHESIS
1. Factors that affect the supply of rice Indonesia is the productivity of rice, domestic rice prices, world rice prices, agricultural credit, agricultural investment, prices of corn, the price of fertilizer, and rainfall.
2. Factors that influence the demand of rice Indonesia is the price of rice, corn prices as substitutes, income per capita of Indonesia, and the total population in Indonesia.
3. World rice prices have relevance to the availability of rice in Indonesia. 4. Changes in world rice exports or
imports affect the amount of availability of rice Indonesia.
RESEARCH METHOD
The method used to determine the area of research is a method of intentional (purposive Method). Selection of research areas based on the consideration that the countries selected is quite influential country in the world rice economy. The method used is descriptive method and analytic method. The data used are secondary data obtained from FAOSTAT (Food Agricultural Organization Statistics) and BPS (Central Bureau of Statistics). The data used is data from 1980 until 2008.
To test the first hypothesis about the factors that affect the supply of rice in Indonesia is to use econometric models to build a system of simultaneous equations
consisting of three equations and one equation structural identity, namely:
a. The area of rice crops in Indonesia a ADI = a0+ a1PRAS + a2PGUNG + a3KREPER +
a4ADIt_1
b. Productivity of rice in Indonesia
YDI = b0+ b1CHJ + b2PFER + b3ADI + b4YDIt_1
c. Total production of rice in Indonesia QGBH = ADI . YDI
d. Total production of rice in Indonesia QRASINA = 0,6032 . QGBH
f. Supply of rice in Indonesia
SRAS = c0 + c1YDI + c2PRAS + c3PWRAS + c4KREPER + c5INVPER + c6PGUNG + c7PFER + c8CHJ;
To test the second hypothesis about the factors that affect the supply of rice in Indonesia is to use econometric models to build a system of simultaneous equations consisting of two structural equations, namely:
a. Demand of Rice in Indonesia
DRAS = d0+ d1PRAS + d2PGUNG + d3GDPINA
+ d4POPINA
f. Rice prices in Indonesia
PRAS = e0 + e1MRASINA + e2SRAS + e3PWRAS + e4PRASl + e5TINA + e6DRAS
g. World Price market
PWRAS = f0 + f1*XWRAS + f2*MWRAS + f3*MRASCDI + f4*MRASCHI + f5*XRASTHL
MRASCDI = h0 + h1*PMRASCDI + h2*EFICDI + h3*QRASCDI + h4*POPCDI + h5*MRASCDIl XRASTHL = p0 + p1*PXRASTHL +
p2*EFITHL + p3*GDPTHL + p4*QRASTHL + p5*POPTHL + p6*PXRASTHLl + p7*STHL + p8*XRASTHLl
Description:
ADI = Area of Paddy (Ha) Pras = Price of Domestic Rice
(Rupiah/ Ton)
PGUNG = Price of Corn (Rupiah / ton) KREPER = Agriculture Credit (Rupiah
Billion)
Ha)
CHJ = Rainfall (mm / year)
PFER = Fertilizer Price (Rupiah / ton)
QGBH = Grain Production (tons) QRASINA = Indonesian Rice Production
(Tons)
SRAS = Supply of Rice (tons) PWRAS = World Rice Prices (U.S. $ /
Ton)
INVPER = Agricultural Investments (Rupiah billion)
Dras = Demand for Rice (Tons) GDPINA = Income per Capita (USD) POPINA = Population of Indonesia
(Soul)
MRASINA = Indonesia's Rice Imports (Tons)
TINA = Indonesia's Rice Import Tariff
MRASCHI = Rice’s import of China XRASTHL =Rice’s export of Thailand PXRASTHL= Rice’s export price of
Thailand
EFITHL = Exchange rate of Thailand GDPTHL = Gross Domestic Product of
Thailand
QRASTHL= Rice’s production of
Thailand
POPTHL = Population of Thailand PXRASTHL = Rice’s export price of
Thailand in the previous year
STHL = Rice’s supply of Thailand
XRASTHLl = Rice’s export of Thailand in the previous year
To test the third hypothesis about the relationship of world rice prices to the availability of rice in Indonesia is to use econometric models to build a system of
simultaneous equations consisting of 22 structural equations.
To test the fourth hypothesis about the conditions of supply of Indonesia's rice imports if there is a change of export rice in major exporting countries and importers are using the simultaneous method of simultaneous equations model 22 owned. Before the simulation is first tested the model validation.
Simulation Model
Simulation aims: (1) evaluate the policies of the past, and (2) make a forecast for the foreseeable future (Hariyati, 2003). Simulation model uses a computer software package SAS / ETS ver 8.2 (Statistical Analysis System / Econometric Time Series), which makes the simulation:
(1) Changes in rice prices and production Cote D'Ivori (the largest importer) 5% (after the 2011 budget target of inflation of 5% in Indonesia in 2011)
(2) Changes in prices and production of Thai rice (the largest exporter) increased by 5%
Availability is calculated by reducing the supply with demand. Availability before the simulation compared with the availability after the simulation.
RESULTS AND DISCUSSION The Performance of Indonesia Rice Market
Package of simultaneous equations that are used in rice supply equation in Indonesia are as follows:
ADI = 2182130 + 32.16419 PRAS - 75.736 PGUNG + 2588.711 KREPER + 0.797419 ADIt_1
YDI = 0.289201 + 0.000016 CHJ - 9.62E-06 PFER + 1.47E-07 ADI + 0.571761 YDIt_1
QGBH = ADI*YDI QRASINA = 0.6032*QGBH
218.3396 KREPER - 280.223 INVPER - 825.515 PGUNG - 779.4784 PFER DRAS = -2.992E7 - 2.06583 PRAS - 122.718
PGUNG + 1700.60 GDPINA + 0.382654 POPINA
PRAS = -1993910 + 0.052 MRASINA - 0.02056 SRAS + 108.9 PWRAS + 0.724200 PRASt_1 + 95206.01 TINA + 0.005 DRAS
PWRAS = 282.0777 + 6.389E6*XWRAS 0.00006*MWRAS
0.00008*MRASCDI -0.00009*MRASCHI + 8.11E-6*XRASTHL
MRASCDI = -1066081 + 28511.92*PMRASCDI + 57666.43*EFICDI +
0.471990*QRASCDI + 0.035319*POPCDI + 0.681766*MRASCDIl
XRASTHL = -1.977E7 + 90829.97*PXRASTHL + 402948.2*EFITHL
-3.226E7*GDPTHL + 0.266933*QRASTHL + 0.394781*POPTHL -2409.71*PXRASTHLl +
0.007687*STHL - 0.15034*XRASTHLl
In a simultaneous equations model which has variables that influenced the price, these variables have been normalized by divided by the consumer price index (Consumer Price Index / CPI). This is done to reduce disorders such as inflation, so price fluctuations not solely due to the effects of inflation. Normalized variable done to all the variables that influenced the price, this is to eliminate the effects of inflation.
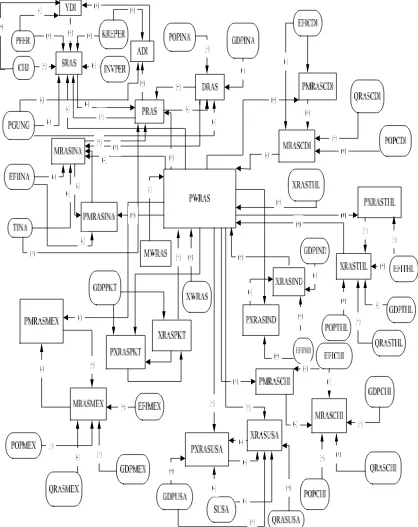
As one of the world's largest importer of rice, cannot be refused again that the state of Indonesian rice to some extent been influenced by the state of the world's rice. The results of data analysis as a whole variable relationship between domestic and global rice market is presented in Figure 5.3. Figure 2 describes the interrelations and mutual influences between endogenous to exogenous variables in domestic and global rice market, so it can be understood in brief about both performance domestic and
6
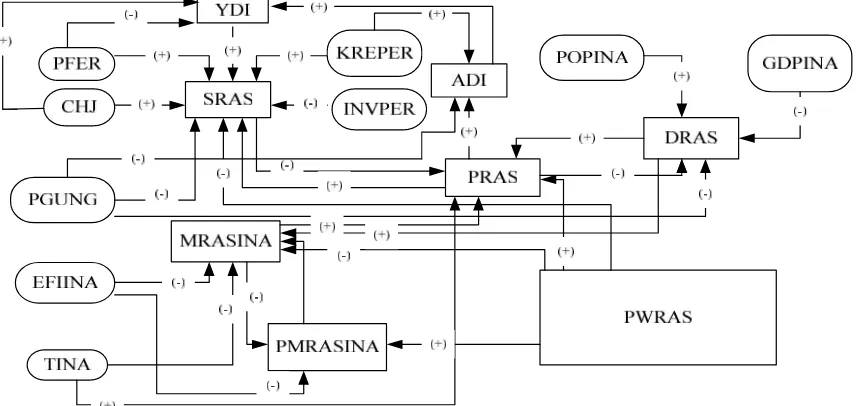
7 Linkage to the Availability of World Rice Prices Rice Indonesia
As for the domestic rice market situation in which world rice prices have influenced depicted in Figure 1. The results show that world rice prices have a positive relationship to the price of domestic rice.
And the world rice price has a negative relationship to the supply of rice in Indonesia. While the demand of rice in Indonesia, the world rice price changes to work simultaneously through the domestic rice price.
Figure 3.Scheme Variables Relations World Rice Prices of Domestic Rice Market Situation
This means that changes in world rice prices that can affect directly the price of domestic rice, will be changing the state of Indonesia's rice demand. This is because the domestic rice price is a variable that affects demand for Indonesian rice. Changes in supply and demand side that would change this state of availability of rice in Indonesia. This explains that the rice economic changes at global level will have an impact on the domestic rice economy. This condition is important for the Indonesian government, in order to always be careful with the rice price fluctuations in global markets or the world. Changes in domestic rice prices, due to changes in world rice prices, the complex will have an impact, among others will have an impact on the amount of imports, changes in supply of goods is also accompanied by changes in domestic demand.
Influential in world rice prices on prices, domestic rice supply and demand
shocks explain that if the world rice market will affect the domestic rice economy. A change in world rice prices will affect the availability of the rice situation in Indonesia. As is well known that a change in the availability of rice in the country able to influence the state of the country both in terms of economic, political, and security and safety. Therefore Indonesian’s government needs to anticipate changes in exporting countries and importers in supplying the world rice market.
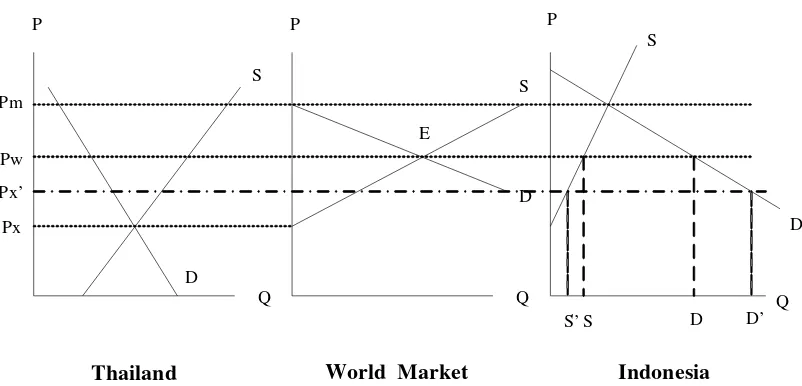
Changes in Prices and Total Export of Rice in Thailand
7 price and quantity of Thai exports by 5%. Simulations carried out simultaneously in order to see the impact of these changes on the availability of rice in Indonesia. Changes in price and quantity of exports
that occurred in Thailand as the country's largest exporter of the world is described as follows in Table 1.
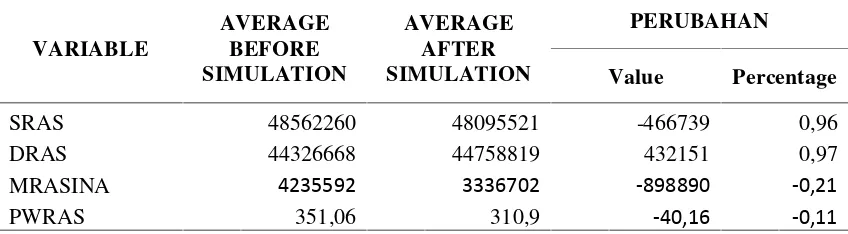
Table 1. Simulation Resultsof Increase in Price and Quantity of Thailand’s RiceExport by 5%
VARIABLE
AVERAGE BEFORE SIMULATION
AVERAGE AFTER SIMULATION
PERUBAHAN
Value Percentage
SRAS 48562260 48095521 -466739 0,96
DRAS 44326668 44758819 432151 0,97
MRASINA 4235592 3336702 -898890 -0,21
PWRAS 351,06 310,9 -40,16 -0,11
Based on the above table it can be seen that with an increase in the price and quantity of exports of Thai rice 5% will reduce supply as well as Indonesia's rice imports. Decrease in supply of 466,739 tons of rice Indonesia and Indonesia's rice imports amounting to 171,870 tons due to Thailand is a country that is able to play the largest exporter of rice world prices, so an increase in the price of Thai rice will also be able to increase world rice prices. As for Indonesia's rice demand has increased due to an increased quantity of exports of Thai rice. As it is known that Thailand is the main destination country Indonesia to import rice.
Based on the above calculation, the availability of rice was measured by reducing the quantity of supply with demand quantity (supply-demand). From
the table above, the availability of rice in Indonesia prior to the simulation are: Availability =Supply–Demand
=48,562,260 Ton–44,326,668 Ton
= 4,235,592 Ton
And the increase in rice prices and Thailand's export quantity to the availability of rice in Indonesia can be calculated as follows:
Availability =Supply–Demand
=48,095,521 Ton–44,758,819 Ton
= 3.336.702 Ton
8
Figure 4. Change Curve Supply and Demand Increase After the Simulation and Thai Rice Exports Total 5% tons of D into D 'amounting to 44,758,819 tons. The increase amounted amounting to 432,151 tons or 0.97%. On the supply side there is a decrease of 48,562,260 tons of S to S 'amounting to 48,095,521 tons. This decrease of 117,214 tons or 0.96%. But the simulation is fixed Indonesia to bring about the availability of rice into a surplus. Based on the graph, it can be seen in order to supply demand situation in Indonesia back in a state of balance, then the government should raise the domestic price of domestic rice. It is also intended to protect the price at the level of domestic rice producers.
Changes in Prices and Total Imports of Rice at Côte d'Ivoire
The selected rice importer country is the country's largest importer in the world, the Ivory Coast. Ivory Coast (Côte d'Ivoire) is a country in West Africa is the country's largest rice importer in the world. A country in West Africa is made of rice as one of the staple food society,
after cassava. But the topography that is not possible to grow rice as well as political circumstances are not conducive lead this country continued to import rice to meet the rice needs of the community. Simulations are performed and the amount of the increase in import prices by 5%. Simulation is done to see what the impact of price changes and the amount of imported rice in Cote d’Ivoire to the conditions of supply of rice in Indonesia. The simulation results are presented in the Table 2.
Based on simulation results in Table 2 it can be seen that the simulated increase in the quantity of imported rice in Cote d’Ivoire able to increase Indonesia’s rice supply of 0.017% or 8305 ton. The decline occurred in Indonesia's rice demand side of 0.147% or 65 156 ton. This decrease occurred due to an increased number of imported rice in Cote d’Ivoire led to world rice prices increased by 98.850% so that the domestic rice prices also increased by 11.678%. This is what causes domestic rice demand has decreased. An increase in world rice prices caused the price of Indonesia's rice imports increased, so the number of Indonesia's rice imports declined.
S
14
Table 2.Changes in Price and Quantity of Rice Imports in Coted’IvoireSimulation Results
VARIABLE
AVERAGE BEFORE SIMULATION
AVERAGE AFTER SIMULATION
CHANGES
Value Percentage
SRAS 48562260 48570565 8305 0.017
DRAS 44326668 44261512 -65156 0.147
MRASINA 921511 778856 -142655 18.316
PMRASINA 3.244 3.5298 0.2858 8.097
PRAS 6579 7448.9 869.9 11.678
PWRAS 3.5106 305.2 301.6894 98.850
PMRASCDI 3.3584 4.0154 0.657 16.362
MRASCDI 693837 728196 54359 4.718
Calculations for the availability of rice in Indonesia after the simulated increase in import prices and the quantity of imported rice in Cote d’Ivoire 5% are as follows:
Availability =Supply–Demand
=48,562,260 Ton–44,326,668 Ton
= 4,235,592 Ton
Having carried out a simulation of the price and quantity of rice imports Cote d’Ivoire then rice availability Indonesia becomes:
Availability =Supply–Demand
=48.570.565 Ton–44.261.512 Ton
= 4.309.053 Ton
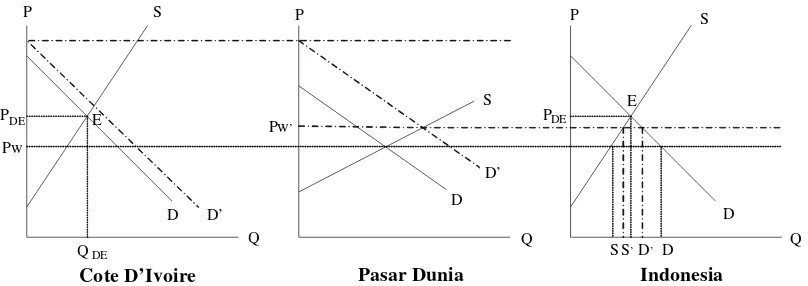
From the above calculation, it can be deduced by the increase in the amount of Cote d’Ivoire rice imports by 5% it will increase the availability of rice Indonesia amounting to 73,461 tons or by 1.7%. The graph for the simulation is as follows:
Figure 5. Change Curve Supply and Demand Increase After The Simulation and Total Imports of Rice Cote D'Ivoire 5%
Figure 5, illustrates the state changes on the supply side and demand after the simulated increase in the amount
of rice imports Cote d’Ivoire. On the demand side there is a decrease from 44,326,668 tons to 44,261,512 tons. This Pw
Cote D’Ivoire Pasar Dunia Indonesia
S S
S
D D D
D’ D’
Pw’
S’
S D’ D
E E
P P P
Q
Q Q
PDE PDE
14 decrease of 65,156 tons or around 0.147%. While on the supply side there was an increase from 48,562,260 tons to 4.8570.565 tons. The increasing amounted to 8305 tons or 0.017%. As mentioned previously, this simulation still make the state the availability of surplus rice in Indonesia but the amount of availability to be increased..
Of the two simulations that have been done above, both show that all simulations are done remains led to a
decrease in the availability of rice in Indonesia. The impact of changing economic conditions on the economy of the world rice Indonesia is presented in Table 3.
From Table 3, it can be known of the changes (in the form of an increase of 5%) price and the amount of exports and imports in major economies will cause a state of
Table 3.Changes in Indonesian rice economy as the impact of changes in world rice
Variabel Basic Value
Value and Percentage Changes (Simulation in Exporter
SRAS 48562260 48095521 -466739 0.97 48570565 8305 0.017
DRAS 44326668 44758819 432151 0.97 44261512
-decreased availability of rice in Indonesia. On changes in exporting countries, the availability of rice Indonesia decreased by 898,890 tons. While the changes in importing countries, the availability of rice Indonesia decreased by 845,496 tons.
CONCLUSION AND SUGGESTIONS Conclusions
1. Factors that affect the supply of rice Indonesia from 1998 until 2008 Indonesia was the productivity of rice and fertilizer prices. price of imported rice, but the increase in world rice prices remained create
conditions for the availability of surplus rice in Indonesia.
4. The price change and quantity of exports in Thailand, as well as changes in price and quantity of imports in Cote d’Ivoire keep the conditions of supply of surplus rice in Indonesia.
Suggestions
1. For further research is recommended for more economic variables used in looking at factors affecting supply and demand of rice Indonesia. The variable is intended to be able to describe the state of Indonesia's rice supply and demand better.
14 REFERENCES
Ahmeth, A. 2010. Makalah Ekspor Impor Indonesia.
http://adie-wongindonesia.blogspot.com/2010
/03/makalah-ekspor-impor-indonesia.html. [3 Februari 2011]. Hariyati, Y. 2003. Performansi Keragaan
Pasar Beras Indonesia di Era Liberalisasi Perdagangan.
Mulyana, Andi. 2004. Prakiraan Dampak Penghapusan Intervensi Kebijakan Impor dan Operasi Pasar Beras Terhadap Stabilitas Harga dan Marjin Pemasaran Beras di Pasar Domestik. Jakarta: PERHEPI. Nurmalina. 2007. Model Neraca
Ketersediaan Beras yang
Berkelanjutan untuk Mendukung Ketahanan Pangan Nasional. http://repository.ipb.ac.id/handle/1 23456789/40846. [3 Februari 2011].
Sawit, MH. 2007. Indonesia dalam Tatanan Perubahan Perdagangan Beras Dunia.
www.bulog.co.id/old_website/.../2 0070321Artikel-Husein_Sawit.pdf. [3 Februari 2011]