The Highest Retail Price (HET) of Subsidized Fertilizer at the
Farmer’s Level in South Sumatra Rice Farming, Indonesia
Elisa Wildayana, M. Yamin Hasan, M. Edi Armanto, Imron Zahri, Dessy Adriani, Ranty Fitria Sari, Nursittah, Fitri Lestari, and Reszki Oktavia
Faculty of Agriculture, Sriwijaya University, South Sumatra, Indonesia, HP. +628127338950
Corresponding author: [email protected]
Recieved August 2017 | Revised November 2017 | Accepted November 2017
Abstract
The research objective is to analyze the subsidized fertilizer price (HET) at the hand of farmers of rice farming in South Sumatra province. The sampling method was disproportionate stratified random sampling with four land typologies. The field data were collected through observation, and interviews with respondents. The use amount of fertilizers on all typologies effected significantly different to rice yields. In the lebak ricefields, the influence of Urea, NPKPhonska and KCl together effected significantly different, but not significantly different for each use of fertilizers. The use cost of Urea affected rice yields and income of farmers significantly different for all ricefields. Eligible HET price received by farmers has to be lower than the real HET price. Determination eligible HET price has to consider soil productivity and accessibility (dam, water gates, water pump, road, infrastructure, local retail and others).
Keywords: HET, subsidized fertilizer, rice farming, level of farmers JEL Classification: Q24, Q18, H23
How to Cite: Wildayana, E., Hasan, M., Armanto, M., Zahri, I., Adriani, D., Sari, R., Nursittah, N., Lestari, F., & Oktavia, R. (2018). The Highest Retail Price (HET) of Subsidized Fertilizer at the Farmer’s Level in South Sumatra Rice Farming, Indonesia. Jurnal Ekonomi Pembangunan: Kajian Masalah Ekonomi dan Pembangunan, 19(1), 24-35. doi:https://doi.org/10.23917/jep.v19i1.5137
DOI: https://doi.org/10.23917/jep.v19i1.5137
1. Introduction
Agricultural sector has a significant role in the third place after mining and processing industry in the role of the regional economy in South Sumatra. The contribution amount of agriculture in the GDP (Gross Domestic Product) was around 20% in 2015 (BPS, 2016; Osorio et al., 2011). The agricultural products are grouped into five sub-sectors, i.e. subsectors of food crops, plantation, forestry, animal husbandry and fishery (Inoue et al., 2015; Armanto et al., 2017).
become a necessity that cannot be left out in the process of food production (Comtea et al., 2013; Adriani and Wildayana, 2015).
Rice production in South Sumatra has increased over the last three decades of cultivating their improvement, including the use of superior varieties, area extensification, irrigation and fertilization (Wildayana et al., 2016). The Government has given support to stimulate rice yields by introducing a subsidized fertilizer price, irrigation schemes and the fertilizer subsidy scheme. In connection with the fertilizer, three main nutrients, NPK is very important for rice cultivation. The misuse of this fertilizer can reduce yields and also make the soil less productive.
The agricultural input market failures in Indonesia had led to the deterioration of agricultural production at the farmer level who suffer most from the agricultural input market failures, so that farmers face chronic agriculture problems (Banful, 2011). Those problems included poor marketing services, incentive prices, lower output, higher fertilizer prices, lack of credit (liquidity) at the farmer level and the lack of farmer’s knowledge. If the low-input farming systems is conducted, it is automatically followed by a low output, so that fertilizer subsidies play a very important role to improve soil productivity (Druilhe and Barreiro-Hurlé, 2012; Chinu and Tsujii, 2004). But there is often appropriate subsidies, which are often not an option of the government’s policy in the long term because the Government generally does not resolve the root causes of the fertilizer subsidy and does not go according to the rules set (Rachman and Sudaryanto, 2010).
Fertilizer subsidies are common in developing countries with innovation seeks to help and to avoid huge losses at the farmer level (Rashid et al., 2013). Paradigm subsidies have often discussed how to reduce subsidies and exacerbated inefficiency of the implementation of this program in the field (Amanze et al., 2010; Akpan and Aya, 2009). Subsidized fertilizers are Urea, NPKPhonska, while KCl fertilizer is not subsidized by the
Government. This dependence on the fertilizers has serious implications for farmers, i.e. when the fertilizer crisis happened and available fertilizer are not necessarily affordable by farmers because generally subsidized fertilizer prices are up in the hands of farmers over the HET price which has been established by the Government (Wildayana et al., 2017). The HET dynamics of the subsidized fertilizer in Indonesia in the period of 2013-2017 did relatively not change (stabile); the fertilizer prices of Urea, SP36, ZA, NPK and organic fertilizer are about Rp 1,800/kg, Rp 2.000/kg, Rp 1,400/kg, Rp 2.300/kg and Rp 500/kg respectively. The price difference in the real price versus the HET price will obviously aggravate the production cost, partly due to not synchronized work between the various parties associated with the policy of subsidized fertilizer. The real HET price of subsidized fertilizer at the level of farmers is higher than the established HET price. Thus, the research objective is to analyze the subsidized fertilizer price (HET) at the hand of farmers of rice farming in South Sumatra province.
2. Research Methods
This research was already carried from January to July 2017 in the South Sumatra Province. The method used in this study is a survey method. The determining the location of the research was done intentionally purposive in consideration of each location chosen to represent each land typology of the rice yields center.
SPSS version 21 (Statistical Product and Service Solutions). The results of data were processed, tabulated, explained descriptively, and presented in the functions of multiple linear regression. Soil productivity of each land typology was mathematically calculated by using the formula:
(1)
Where:
Y = Productivity (ton/ha/year) Pt = Farming production (ton/year) X = Land size (ha)
The influence of the use of subsidized fertilizer on yields and income in each land typology was calculated by using models of multiple regression equation:
Y= α +
β
1X1 +β
2X2 + ...β
nXn + e (2)Where:
Y = Production (ton/year) and rice field income (Rp/year)
X1 = Total fertilizer use Nr 1 (kg/year) or the cost of fertilizer use Nr 1 (Rp/year) X2 = Total fertilizer use Nr 2 (kg/year) or the
cost of fertilizer use Nr 2 (Rp/year) Xn = Total fertilizer use Nr n (kg/year) or
the cost of fertilizer use Nr n (Rp/year)
α
= Interceptsβ
1,2,....n = Estimates of parameter e = Coefficient
Finding out how much the dependent variable can be explained by the independent variables, it can be explained by R2 values (the coefficient of determination) and can be statistically tested by using F test.
3. Results and Discussions
South Sumatra Province has a land area of around 9,716,859 ha, about 799,693 ha is utilized for ricefields. The ricefields can be divided as an area of technical irrigation (35,051 ha), semi technical irrigation (19,720 ha), simple irrigation (15,121 ha), rural irrigation (27,247 ha), rainfed ricefields (123,975 ha), tidal ricefields (241,340 ha), lebak swamp (192,614 ha) and others (144 561 ha). The land area is used for other agriculture amounting of approximately 4,874,520 ha and about 4,042,746 ha are utilized for other purposes (not agriculture).
Results and discussions of the research will explore some information and facts of the research items, i.e. characteristics of sampled respondents; production and productivity of rice farming; the fertilizer effect on rice yields in rice farming; and the effect of fertilizer cost on income of farmers
3.1. Characteristics of Sampled
Respondents
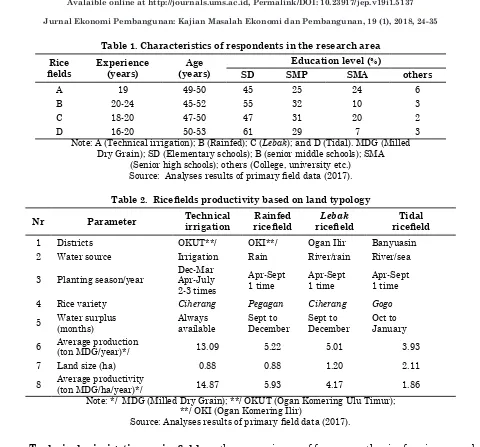
Table 1. Characteristics of respondents in the research area Rice
fields Experience (years)
Age (years)
Education level (%)
SD SMP SMA others
A 19 49-50 45 25 24 6
B 20-24 45-52 55 32 10 3
C 18-20 47-50 47 31 20 2
D 16-20 50-53 61 29 7 3
Note: A (Technical irrigation); B (Rainfed); C (Lebak); and D (Tidal). MDG (Milled Dry Grain); SD (Elementary schools); B (senior middle schools); SMA
(Senior high schools); others (College, university etc.)
Source: Analyses results of primary field data (2017).
Table 2. Ricefields productivity based on land typology
Nr Parameter Technical irrigation
Rainfed
ricefield
Lebak
ricefield ricefieldTidal
1 Districts OKUT**/ OKI**/ Ogan Ilir Banyuasin
2 Water source Irrigation Rain River/rain River/sea
3 Planting season/year
Dec-Mar
Apr-July
2-3 times
Apr-Sept 1 time
Apr-Sept 1 time
Apr-Sept 1 time
4 Rice variety Ciherang Pegagan Ciherang Gogo
5 Water surplus
(months)
Always available
Sept to December
Sept to December
Oct to January
6 Average production(ton MDG/year)*/ 13.09 5.22 5.01 3.93
7 Land size (ha) 0.88 0.88 1.20 2.11
8 Average productivity(ton MDG/ha/year)*/ 14.87 5.93 4.17 1.86
Note: */ MDG (Milled Dry Grain); **/ OKUT (Ogan Komering Ulu Timur); **/ OKI (Ogan Komering Ilir)
Source: Analyses results of primary field data (2017).
Technical irrigation ricefields, the average production was approximately 13.09 tons MDG/ha/year with the most widely used variety of Ciherang. The average experience in rice farming was 19 years and the average area of cultivated land is 0.88 ha. The average age of farmers was in the range 49-50 years. Last education of farmers were commonly (45%) at the SD (elementary school), around 25% at the SMP (junior high school) and SMA (senior high school) 24%, and the remaining (6%) belongs to undergraduate level or equivalent (S1).
Rainfed ricefields, the land area is cultivated an average of 0.88 ha. The average rice yields is around 5.22 tons MDG/ha/year with an overall local variety of Pegagan. The average
experiences of farmers on the rice farming ranged from 20-24 years. The average age of farmers was in the range of 45-52 years. Last education of farmers are commonly (55%) at the SD, SMP 32%, SMA 10% and undergraduate (3%).
Lebak ricefields, the average area of
cultivated land is 1.20 ha. The average rice yields was amounted to 5.01 tons MDG/ha/year with a whole variety used is Ciherang. Average farming experience ranged from 18-20 years with an average age of farmers in the range of 47-50 years. Last educational levels of farmers are at the SD 47%, SMP 31%, SMP 20% and undergraduate/ equivalent (2%).
amounted 3.93 tons MDG/ha/year with a whole variety used is local variety and the Gogo rice. The farmer’s experience ranged from 16-20 years and the average age of farmers was in the range of 50-53 years. The last education of farmers were commonly at the SD 61%, SMP 29%, and SMA 7%, as well as the remaining (3%) belongs to undergraduate level or equivalent (S1/diploma).
3.2. Production and Productivity of Rice Farming
The research areas represent each studied land typology, namely ricefields of technical irrigation, rainfed, tidal and lebak. All ricefields were determined as area centers of rice productions and rice farming is the main activity found in four typologies (Table 2). In addition, the four typologies as the regions agricultural sector are able to contribute to the GDP of South Sumatra.
3.2.1. Technical Irrigation Ricefields Technical irrigation ricefields are located in District of OKUT South Sumatra and belong to the rice production center of the technical irrigation ricefields. The landuses (60%) in the district are dominated by ricefields, which is divided into technical irrigation (90%), nontechnical irrigation (3%), and not irrigated (7%). The remaining area (40%) belongs to not an agricultural land (for housing, industry and so on). Ricefields are generally planted with rice as the main source of income of farmers, and generally produce 7-10 tons MDG/ha/planting season and can be done 2-3 times/year or more precisely 5 times/2 years. Rice planting is carried out in two seasons, i.e. the Rendengan in December to March and the Gadu in the April to July. Thus rice yields is on average 13.09 tons MDG/ha/year.
Technical irrigation ricefields has the highest productivity than other land typologies. This high productivity will be able to generate a rice yields of 14.87 tons MDG/ha/year, while rainfed ricefields (5.93 tons MDG/ha/year), is
under technical irrigation ricefields, especially when compared with lebak ricefields (4.17 tons MDG/ha/year) or tidal ricefields (1.86 tons MDG/ha/year). High productivity on technical irrigation ricefields was because infrastructure of water management (namely dam, water gates, water pump and others) are well installed and water is able to irrigates and to flow through the ricefields in the right quantity, right time, right dose and according to the wishes of farmers as well as the use of seed varieties that are responsive to fertilizer use, as well as a balanced fertilizer use, makes this region a surplus. To compare and to analyze the rice productivity can be analyzed with mathematical calculations and technical irrigation ricefields can be used as the rural comparison. The difference level between the productivity of technical irrigation ricefields to rainfed ricefields amounted to 60.19%, with the lebak ricefields (71.96%) and with the tidal ricefields (87.49%).
3.2.2. Rainfed Ricefields
3.2.3. Lebak Ricefields
Lebak ricefields are sited in the District of Ogan Ilir and belong to the rice production center of the lebak ricefields. The acreages of lebak ricefields cover of around 69% of the district area. The majority of people living in the lebak swamp depend on the principal business of rice farming by taking an interval between months of April to September. Lebak ricefields can be divided into three land typologies, namely the shallow lebak (covering approximately 43%), levee lebak (covering around 35%) and middle lebak (about 22%). The average rice yields is approximately 5.01 ton MDG/ha/year. It seems that the water availability largely determines the soil productivity. In the middle lebak, water is always available, thus water requirements for rice can be fulfilled, thus the highest production reached 6.5 ton MDG/ha, which is found in middle lebak.
Lebak ricefields have three typology types, i.e. shallow lebak, levee lebak and middle lebak. Middle lebak is generally capable of producing 7.0 tons MDG/ha/year, and shallow lebak and levee lebak are capable of producing about 3.0-4.5 ton MDG/ha/year. The average productivity is 4.17 tons MDG/ha/year. Lebak ricefield productivity is high because the local procurement of farm inputs is conveniently closed to Palembang city.
3.2.4. Tidal Ricefields
Tidal ricefields are located in District of Banyuasin, which belong to tidal B Zone and C Zone and are the rice production center of the tidal ricefields. The tidal ricefields cover an area of around 71% of the total district area and are determined also as a center of the tidal rice yields. Tidal Ricefields are cultivated in a cycle of one planting season per year with the average rice yields of about 3.93 ton MDG/ha/year, with the highest production reached about 7.0 tons MDG/ ha/year found in the B Zone. Rice yields in the B Zone is higher than the C Zone because the water availability in the B Zone is more secure due to the influence of tides, water availability will meet the water needs of rice plants separately, and thus
the rice growth and production may be optimal. Tidal ricefields showed the lowest productivity compared to other land typologies, this was due to the difficulty of farmers to manage the water system in the tidal area. Farmers are not able to cultivate their lands due to technical factors that are difficult managed by the farmers themselves, they are not 100% concentrated on their on-farm jobs, but they are scattered in other jobs. Besides the tidal ricefields is mostly located in remote area and is difficult to achieve access, then the distribution of the production factors of rice farming was difficult and also sometime delayed? Therefore, with limited input and the area is less accessible in terms of transportation and communication, land management became less attended by many parties including government and private sectors. This is exactly what makes the tidal ricefields having an average land size of quite large, but the productivity of the ricefields itself is still considered low compared with other productivity. Some tidal land itself is located in C Zone, which means that water tides affect less the growing season, because the tides are not enough water to irrigate cultivated land, so that the production of this rice is still low.
3.3. Fertilizer Effect on Rice Yields in Rice Farming
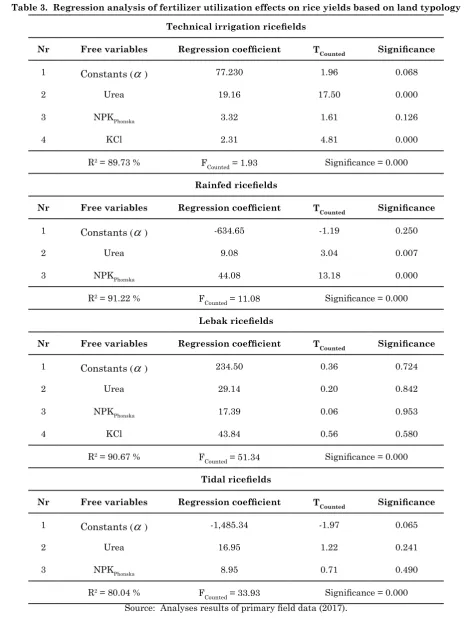
The results of multiple regression analysis showed that the rice yields are determined as dependent variables, while the independent variables are the fertilizers of Urea, NPKPhonska and KCl. The results of the regression analysis of fertilizer utilization on rice yields are summarized in Table 3.
Table 3. Regression analysis of fertilizer utilization effects on rice yields based on land typology
Technical irrigation ricefields
Nr Free variables Regression coefficient TCounted Significance
1 Constants (
α
) 77.230 1.96 0.0682 Urea 19.16 17.50 0.000
3 NPKPhonska 3.32 1.61 0.126
4 KCl 2.31 4.81 0.000
R2 = 89.73 % F
Counted = 1.93 Significance = 0.000
Rainfed ricefields
Nr Free variables Regression coefficient TCounted Significance
1 Constants (
α
) -634.65 -1.19 0.2502 Urea 9.08 3.04 0.007
3 NPKPhonska 44.08 13.18 0.000
R2 = 91.22 % F
Counted = 11.08 Significance = 0.000
Lebak ricefields
Nr Free variables Regression coefficient TCounted Significance
1 Constants (
α
) 234.50 0.36 0.7242 Urea 29.14 0.20 0.842
3 NPKPhonska 17.39 0.06 0.953
4 KCl 43.84 0.56 0.580
R2 = 90.67 % F
Counted = 51.34 Significance = 0.000
Tidal ricefields
Nr Free variables Regression coefficient TCounted Significance
1 Constants (
α
) -1,485.34 -1.97 0.0652 Urea 16.95 1.22 0.241
3 NPKPhonska 8.95 0.71 0.490
R2 = 80.04 % F
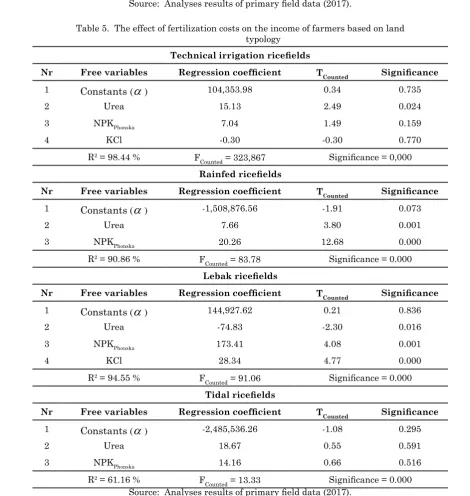
Table 4. Fertilizer costs and income of farmers
Nr Parameter Technical irrigation
Rainfed
ricefield
Lebak
ricefield ricefieldTidal
1 Fertilizer (Million Rp/year) 1.85 0.56 0.34 0.63
2 Income (Million Rp/year) 17.54 7.17 7.71 7.63
Source: Analyses results of primary field data (2017).
Table 5. The effect of fertilization costs on the income of farmers based on land typology
Technical irrigation ricefields
Nr Free variables Regression coefficient TCounted Significance
1 Constants (
α
) 104,353.98 0.34 0.7352 Urea 15.13 2.49 0.024
3 NPKPhonska 7.04 1.49 0.159
4 KCl -0.30 -0.30 0.770
R2 = 98.44 % F
Counted = 323,867 Significance = 0,000
Rainfed ricefields
Nr Free variables Regression coefficient TCounted Significance
1 Constants (
α
) -1,508,876.56 -1.91 0.0732 Urea 7.66 3.80 0.001
3 NPKPhonska 20.26 12.68 0.000
R2 = 90.86 % F
Counted = 83.78 Significance = 0.000
Lebak ricefields
Nr Free variables Regression coefficient TCounted Significance
1 Constants (
α
) 144,927.62 0.21 0.8362 Urea -74.83 -2.30 0.016
3 NPKPhonska 173.41 4.08 0.001
4 KCl 28.34 4.77 0.000
R2 = 94.55 % F
Counted = 91.06 Significance = 0.000
Tidal ricefields
Nr Free variables Regression coefficient TCounted Significance
1 Constants (
α
) -2,485,536.26 -1.08 0.2952 Urea 18.67 0.55 0.591
3 NPKPhonska 14.16 0.66 0.516
R2 = 61.16 % F
Counted = 13.33 Significance = 0.000 Source: Analyses results of primary field data (2017).
In the technical irrigation ricefields, fertilizer uses of Urea, NPKPhonska and KCl are able to contribute the rice yields by 89.73%, while
yields of 19.16 kg. KCl fertilizer use showed also significantly affect to rice yields, where each 1 kg KCl fertilizer used is able to increase rice yields amounted to 2.31 kg, while NPKPhonska was not significantly different or did not give the real effect to rice yields, it was indicated by significance test (TCounted < TTable= 1.61 < 2.102).
In the rainfed ricefields, the fertilizer uses of Urea and NPKPhonska are able to contribute and to explain the rice yields by 91.22%, however the rest of around 8.78% was explained by other variables that are outside the model. Urea and NPKPhonska fertilizer gave significant effect, i.e. each 1 kg Urea fertilizer use is able to increase the rice yields of 9.08 kg and 1 kg NPKPhonska fertilizer is able to improve the rice yields of 44.08 kg. The together use of Urea and NPKPhonska gave significantly different on the rice yields. The constant value of -634.65 indicated that without the use of Urea and NPKPhonska, the rice yields will be reduced by 634.65 kg.
In the lebak ricefields, the fertilizer uses
of Urea, NPKPhonska and KCl are able to contribute and to explain the rice yields of 90.67%, while 9.33% was elaborated by other variables out of the model. The uses of Urea, NPKPhonska and KCl separately did not give real effect to the rice yields, but KCl, which is a non-subsidized fertilizer, provides the closest real influence on the rice yields. However the values of FCounted were larger than FTable (51.34 > 2.12), it means if all fertilizers (Urea, NPKPhonska and KCl) are used together, then the combination of these fertilizers is able to give real effect on rice yields.
At the tidal ricefields, the fertilizer uses of Urea and NPKPhonska are able to contribute and to explain the rice yields of 80.04%, while 19.96% was pointed out by other variables. The uses of Urea and NPKPhonska partially did not give real effect, but the significantly different effect would be showed if both fertilizers are applied together. The constant value of -1,485.34 indicating that without the use of Urea and NPKPhonska, the rice yields will be reduced by 1,485.34 kg. This illustrates that Urea and NPK together
affected the rice yields significantly, but not partially. The low rice productivity is due to that farmers do not received both fertilizer at once, but separately, while the separate application of fertilizer was not significantly affected to the rice yields. Delays in the fertilizer distribution to the farmers are caused by that the farmers are located in remote area and far away from retailers and limited transport (damage to roads, limited transportation, lack of understanding of the important role fertilizer on the rice productivity and others).
3.4. The Effect of Fertilizer Cost on Income of Farmers
Fertilizer as a production factor is very important in the ricefields, therefore the fertilizer cost influenced the income of households. The average income of farmers of technical
irrigation ricefields is much greater (more than doubled) than other land typologies because the ricefields have a cycle of growing season 2-3 times annually, precisely 5 planting seasons in 2 years, the growing seasons of Gadu and Rendengan and are not influenced by natural factors, while other ricefields showed one growing season annually and are dominantly influenced by the nature condition. Table 4 and Table 5 describe the average cost of fertilizer and the income of farmers based on a land typology of ricefields.
it will increase the income of Rp 15.13 incomes received by farmers. The uses of NPKPhonska and KCl are not significantly different to the income of farmers or do not show real effect to the income. The constant value showed that it can be concluded that without the fertilizer costs incurred for ricefields, farmers will still earn income from their ricefields amounting to Rp 104,353.98. The cost of fertilizer use is able to explain the income of 98.44%, while 1.56% was performed by other factors out of the model.
In the rainfed ricefields, the constant value is negative in the amounting of -1,508,876.56. This indicates if no Rp 1.00 charge of Urea and NPKPhonska use, then the income of farmers will be reduced by Rp 1,508,876.56. It can be concluded that the use of urea and NPKPhonska give very real impact on the income of farmers. NPKPhonska cost effect greater than the cost of the Urea use, i.e. each Rp 1.00 costs is incurred for the use of NPKPhonska, it will be able to increase the income of farmers of Rp 20.26, while for Rp 1.00 costs to the Urea use will only add Rp 7.66 to the income. The R2 value of 90.86% indicates that the independent variable (the income of farmers) could explain the dependent variable or fertilizer amounted to 90.86%, while 9.14% was displayed by other factors.
In the lebak ricefields, without the cost of fertilizer use, then the income of farmers will remain at Rp 144,927.616. Cost for the Urea use will not affect the income of farmers. Each Rp 1.00 costs incurred for NPKPhonska use, it is able to increase the income of farmers amounted to Rp 173.41 and each Rp 1.00 costs incurred for the KCl use, it will increase the income of farmers of Rp 28.34. Use of Urea, NPKPhonska and KCl can explain the income of farmers of 94.55%, while 5.45% is explained by variables other production factors which are outside the model.
The tidal ricefields have lowest productivity (1.86 tons MDG/ha/year) compared to the other productivities, the use of fertilizers is very influential on the income, i.e. if the farmers
do not pay for the use of fertilizers, their income will be significantly reduced as much as Rp - 2,485,536.26. The cost for the use of Urea and NPKPhonska together will give real impact on the income of farmers, but not partially. The R2 value of 61.16% explained that the cost of fertilizer use can only explain the income of farmers amounted to 61.16%, while 38.84% is explained by other variables (other production factors) that are outside the model.
Income earned by farmers on the various typology of rice fields is of course closely related to the rice yields because in general the higher the rice yield is obtained, the greater the income of farmers is achieved. To produce the harvested rice yields, it is necessary to have maintenance that encourages increased yields, such as fertilizer application. In each typology requires different fertilizer composition, so that the cost of fertilizer is also different. Provision of certain types of fertilizers done by farmers can affect the costing of farming in which also affects income of farmers.
4. Conclusions
5. Acknowledgement
We would like to acknowledge the Sriwijaya University research Grant for funding this research. Thanks are also directed the staff of the Faculty of Agriculture, Sriwijaya University, our students as well as local farmers, who have contributed to this research. Lastly we wanted to a lot of thank you to all people, who cannot be mentioned and helped our research.
6. References
Adriani, D. and E. Wildayana. (2015), “Integrasi Pertumbuhan Ekonomi dan Penciptaan Kesempatan Kerja Sektor Pertanian di Indonesia”. Jurnal Sosiohumaniora, Vol 18(3); 204-212.
Akpan, S. B., and E.A. Aya (2009). Determinants of fertilizer use among small – holder farmers in Wetland Region of Cross River State. Global Journal of Agricultural Sciences. Vol 8(2); 195-201.
Amanze, B., C. Eze, and V. Eze. (2010). Factors Influencing the Use of Fertilizer in Arable Crop Production among Smallholder Farmers in Owerri Agricultural Zone of Imo State. Academia Arena. Vol 2(6); 90-96.
Armanto, M.E., M.A. Adzemi, E. Wildayana and M.S. Imanudin. (2013), “Land Evaluation for Paddy Cultivation in the Reclaimed Tidal Lowland in Delta Saleh, South Sumatra, Indonesia”. Journal of Sustainability Science and Management. Vol 8(1):32-42. June 2013.
Armanto, M.E., R.H. Susanto and E. Wildayana. (2017), “Functions of Lebak Swamp before and after Landfills in Jakabaring South Sumatra”. Sriwijaya Journal of Environment, Vol 2(1); 1-7.
Banful, A.B. (2011), “Old Problems in the New Solutions? Politically Motivated Allocation of Program Benefits and the “New” Fertilizer Subsidies,” World Development. Vol. 39(7); 1166-1176.
Badan Pusat Statistik (BPS), Provinsi Sumatera Selatan”. Palembang.
Chinu J. N. and H. Tsujii (2004). Determinant of farmer’s decision to adopt or not to adopt inorganic fertilizer in savanna of northern Nigeria. Nutr. Cyc. Agroecosyst. Vol 70; 293-301.
Comtea, I., F. Colinc, O. Grünberger, S. Follainc, J.K. Whalena, and J.P. Calimane. (2013), “Landscape-Scale Assessment of Soil Response to Long-Term Organic and Mineral Fertilizer Application in an Industrial Oil Palm Plantation, Indonesia”. Agriculture, Ecosystems and Environment. Vol 169; 58-68.
Druilhe, Z. and J. Barreiro-Hurlé. (2012), “Fertilizer subsidies in sub-Saharan Africa,” ESA Working Paper No. 12-04. Rome, FAO.
Ellis, F. and D. Maliro. (2013), “Fertilizer Subsidies and Social Cash Transfers as Complementary or Competing Instruments for Reducing Vulnerability to Hunger: The Case of Malawi”. Development Policy Review. Vol 31(5); 575-596.
Galperin, H. and M.F. Viecens. (2017), “Connected for Development? Theory and Evidence about the Impact of Internet Technologies on Poverty Alleviation”. Development Policy Review. Vol 35(3); 315-336.
Inoue, S., T. Okae, and K. Ashi. (2015), “Rice Policy Trends in Southeast Asian Countries: Thailand, Vietnam and Indonesia”. Primaff Review. Vol 66(7); 4-5.
Osorio, C.G., D.E. Abriningrum, E.B. Armas and M. Firdaus. (2011), “Who is Benefiting from Fertilizer Subsidies in Indonesia?” Policy Research Working Paper 5758, Poverty Reduction and Economic Management Unit, East Asia and Pacific Region, the World Bank
in Indonesia”. Analisis Kebijakan Pertanian. Vol. 8(3); 193-205.
Rashid. S., N. Tefera, N. Minot and G. Ayele. (2013), “Can Modern Input Use be promoted without Subsidies?” An Analysis of Fertilizer in Ethiopia. Agricultural Economics. Vol. 44(6); 595-611.
Warr, P. and A.A. Yusuf. (2014), “Fertilizer Subsidies and Food Self-Sufficiency in Indonesia”. Agricultural Economics. Vol 45(5); 571-588.
Wildayana, E. and M.E. Armanto. (2017), “Agriculture Phenomena and Perspectives of Lebak Swamp in Jakabaring South
Sumatra, Indonesia”. Jurnal Ekonomi dan Studi Pembangunan (JESP). Vol 9(2); 156-165.
Wildayana, E., M.E. Armanto, I. Zahri and M.Y. Hasan. (2017), “Novel Innovation of Subsidized Fertilizers Based on Soil Variability and Farmer’s Perception”. Jurnal Ekonomi Pembangunan. Vol 18(1): 50-63.