THE PRICE TRANSMISSION
IN RICE MARKET CHAIN IN INDONESIA
HUSNUL KHOTIMAH
GRADUATE SCHOOL
BOGOR AGRICULTURAL UNIVERSITY BOGOR
STATUTORY DECLARATION AND COPYRIGHT DELEGATION
I hereby declare that my thesis entitled “The Price Transmission in Rice Market Chain in Indonesia” is true of my work as under the guidance of the advisory committee and it has not been submitted in any form to any institution. This is submited to fulfill one of the requirements for the award of Master of Science from Bogor Agricultural University Indonesia and Georg-August Goettingen University Germany in the frameworks of international joint degree program between both universities. The source of informations derived or quoted from published and unpublished works from other authors have been mentioned in the text and listed in the References at the end of this thesis.
I hereby assign the copyright of my writing to Bogor Agricultural University.
Bogor, January 2013
ABSTRACT
HUSNUL KHOTIMAH. The Price Transmission in Rice Market
Chain in Indonesia. Supervised by SUHARNO, RITA NURMALINA,
and STEPHAN VON CRAMON-TAUBADEL.
The aim of this study is to assess the rice market chain performance, namely price volatility and price transmission among producer, rice miller, wholesaler, and retailer, with respect to the enforcement of rice price stabilization policy in Indonesia. We use the standard deviation of return for price volatility and the Cointegration test and the Error Correction Model for price transmission analysis. The results of this study show that the magnitudes of price volatilities along market chain decrease from producer to retailer. Producer in the upstream faces the highest price volatility at 24,9%, and then ricemiller and wholesaler face the lower price volatility than producer but still high at 18,3% and 18,1%, respectively. Whereas retailer in the downstream faces the stable price at 8,7%. The price transmission analysis concludes that the rice market chain in Indonesia is segmented. The rice price is not transmitted completely from producer to consumer, and vice versa. There are only two markets which are integrated, namely price relationships between producer and ricemiller and between wholesaler and retailer. Meanwhile the price relationships between producer and wholesaler, producer and retailer, ricemiller and wholesaler, and ricemiller and retailer are not integrated.
SUMMARY
HUSNUL KHOTIMAH. The Price Transmission in Rice Market Chain in Indonesia. Supervised by SUHARNO, RITA NURMALINA, and STEPHAN VON CRAMON-TAUBADEL.
Rice commodity has important and strategic roles in Indonesia economically, socially, and politically. Therefore the government of Indonesia imposes comprehensive policies to maintain rice price to be stable. The performance of its policies can be seen from Indonesian rice market resilience faced the world rice crisis in 2007/2008. The Indonesian rice market policy for price stabilization is executed by Bulog. Bulog has tasks to import rice, purchase domestic excess supply, maintain government rice reserve, inject additional supply when rice price rise, and distribute rice for the poor with low price. The successful of price stabilization policy in Indonesian rice market raise a question how did this policy influence the rice market chain performance? especially price volatility and price transmission among producer, rice miller, wholesaler, and retailer. We use the standard deviation of return for price volatility and the Cointegration test and the Error Correction Model for price transmission analysis.
The result of this study shows that the magnitudes of price volatilities along market chain decrease from producer to retailer. Producer faces the highest price volatility at 24,9%, and then rice miller and wholesaler face the lower price volatility than producer but still high at 18,3% and 18,1%, respectively. Whereas retailer faces the stable price at 8,7%. This study also confirms that the rice price volatilities before and during crisis are not different significantly for retailer price, wholesaler price, and rice miller price, but decrease significantly for producer price.
The price transmission analysis concludes that the rice market chain in Indonesia is segmented. The rice price is not transmitted completely from producer to consumer, and vice versa. There are only two markets which are integrated, namely price relationships between producer and rice miller as well as wholesaler and retailer. Whereas the price relationships between producer and wholesaler, producer and retailer, rice miller and wholesaler, and rice miller and retailer are not integrated. The factors which may influence these relationships are the seasonal price effects, market power to manage supply, trade barriers, direct or indirect interaction related to product flows effects on price determination, transaction costs, transparancy of market information, and price stabilization policy.
The policy implications which can be recommended from this study are: manage the unstable supply from production point through manage the cropping pattern in the production areas and strengthen the farmers’ institution by reinforce
“Lumbung Padi” to the farmers, provide and manage good infrastructures for
transportation, rice processing, warehousing, and communication infrastructure in Indonesian rice market chain system, encourage the market competitiveness along the rice market chain, and if everything is going well the rice price stabilization policy in the downstream market may be omitted.
RINGKASAN
HUSNUL KHOTIMAH. Transmisi Harga pada Rantai Pasar Beras di Indonesia. Dibimbing oleh SUHARNO, RITA NURMALINA, dan STEPHAN VON CRAMON-TAUBADEL.
Komoditas beras memiliki peran yang penting dan strategis bagi Indonesia, baik secara ekonomi, sosial, maupun politik. Maka dari itu pemerintah Indonesia menerapkan kebijakan yang komprehensif untuk menjaga harga beras tetap stabil. Kebijakan ini dinilai berhasil menghadapi krisis pangan global pada tahun 2007/2008. Kebijakan stabilisasi harga beras di Indonesia dilakukan oleh Bulog. Keberhasilan kebijakan stabilisasi harga beras di pasar Indonesia menimbulkan pertanyaan bagaimana kebijakan ini mempengaruhi kinerja rantai pasar beras, khususnya volatilitas harga dan transmisi harga antara petani, penggilingan, grosir, dan ritel. Penelitian ini menggunakan standard deviation of return untuk analisis volatilitas harga serta Cointegration test dan Error Correction Model untuk analisis transmisi harga.
Hasil dari penelitian ini menunjukan bahwa besar volatilitas harga beras sepanjang rantai pasar menurun dari petani ke ritel. Petani menghadapi volatilitas harga yang paling tinggi dengan volatilitas harga 24,9%, kemudian penggilingan dengan 18,3%, grosir dengan 18,1%, dan ritel dengan 8,7%. Ritel menghadapi harga yang stabil dibandingkan dengan lembaga pemasaran lainnya. Penelitian ini juga mengkonfirmasi bahwa volatilitas harga sebelum dan selama krisis tidak berbeda signifikan untuk harga penggilingan, harga grosir, dan harga ritel. Tapi menurun dengan signifikan untuk harga petani.
Analisis transmisi harga menyimpulkan bahwa rantai pasar beras di Indonesia tidak terintegrasi. Harga beras tidak tertransmisikan secara sempurna dari petani ke ritel, dan begitu juga sebaliknya. Hanya ada dua pasar yang terintegrasi yaitu antara petani dengan penggilingan dan grosir dengan ritel. Sementara itu pasar antara petani dengan grosir, petani dengan ritel, penggilingan dengan grosir, dan penggilingan dengan ritel tidak terintegrasi. Faktor-faktor yang diduga mempengaruhi hubungan transmisi harga ini antara lain dampak dari harga musiman, kekuatan pasar dalam mengelola penawaran, hambatan-hambatan perdagangan, hubungan interaksi langsung atau tidak dalam perdagangan terkait dengan dampak dari aliran produk dalam penentuan harga, biaya-biaya transaksi, transparansi informasi pasar, dan kebijakan stabilitas harga.
Implikasi kebijakan dari penelitian ini adalah: mengupayakan suplai produksi yang stabil melalui mengelola pola tanam di daerah produksi dan memperkuat kelembagaan petani dengan menggalakan kembali lumbung padi, mengediakan dan mengelola infrastruktur dengan baik dalam bidang transportasi, penggilingan beras, pergudangan, dan infrastruktur komunikasi dalam sistem rantai pasar, mendorong pasar yang kompetitif sepanjang rantai pasar, dan jika semuanya sudah berjalan dengan baik, kebijakan stabilisasi harga beras di hilir rantai pasar beras bisa dihilangkan.
© All Rights Reserved to IPB, Year 2013
Copyright Reserved by Law
Prohibited to quote part or all of this paper without mentioning or citing the sources. Quotation is only for educational purposes, research, writing papers, preparing reports, writing criticism, or review of an issue and citations will not harm the interests of IPB
Prohibited to publish and reproduce part or all of this paper in any form without
THE PRICE TRANSMISSION
IN RICE MARKET CHAIN IN INDONESIA
HUSNUL KHOTIMAH
A Thesis
as one of the requirements to achieve the title of Master of Science
on Study Program of Agribusiness
GRADUATE SCHOOL
BOGOR AGRICULTURAL UNIVERSITY BOGOR
Examiner from External Committee : Dr. Amzul Rifin, SP, MA.
Thesis Title : The Price Transmission in Rice Market Chain in Indonesia
Name : Husnul Khotimah
Registration Number : H451100201
Approved
1. Advisory Committee
Dr. Ir. Suharno, M.Adev Chairman
Prof. Dr. Ir. Rita Nurmalina, MS Member
Prof. Dr. Stephan von Cramon-Taubadel Member
Agreed
2. Coordinator of Major Agribusiness 3. Dean of Graduate School
Prof. Dr. Ir. Rita Nurmalina, MS Dr. Ir. Dahrul Syah, M.Sc.Agr
ACKNOWLEDGEMENT
I would like to express my gratitude to my supervisors in Bogor Agricultural University Indonesia, Dr. Ir. Suharno, M.Adev and Prof. Dr. Rita Nurmalina, MS, for their motivation, encouragement, and assistance to learn about rice market in Indonesia. I hope my research can give additional insight about how price transmission works in the Indonesian rice market.
I would also like to thank to my supervisor from Georg-August Goettingen University Germany, Prof. Dr. Stephan von Cramon-Taubadel for the continuous support in my research, for his patience, motivation, discussion, answer and immense knowledge. His guidance helped me to learn the basic of price transmission theory and encourage me to learn more and write my thesis with spirit. My thanks also for Nelissa Jamora for her help, discussion, and motivation to finish my thesis.
My big gratitude for my big family in Kuningan West Java, especially for my mom, my dad, and my fiance, who allowed me to continue my study in Germany, for their prays, supports and smiles every day for me. My thanks also for my friends in Magister Science of Agribusiness AK 1 and for my new family in Germany, Roko Big Family. Thank you for togetherness, happiness, and familiarity accompanying my study in Bogor and Goettingen.
I must also acknowledge Indonesia-Germany Scholarship Program from Directorate General of Higher Education, The Ministry of National Education Republic of Indonesia, for their finance and trust given to me to study in Germany.
BIBLIOGRAPHY
The author was born in Kuningan, June 19th 1987. She is the third of four children from Mr. Lumri Rais and Mrs.Aah Sariah. She grew up and study from elementary school until senior high school in Kuningan West Java. She finished her senior high school in SMAN 1 Mandirancan, Sub district Kuningan West Java. She continued her study in Bogor Agricultural University with major Agribusiness and graduated as the Bachelor of Economics in 2010. Then she continued her master immediately in the same year on International Joint Degree Program between the Magister Science of Agribusiness, Graduate School of Bogor Agricultural University Indonesia and the International Agribusiness and Rural Development, Sustainable International Agriculture, Georg-August Goettingen University Germany with sponsorship from the Directorate General of Higher Education, The Ministry of National Education Republic of Indonesia.
TABLE OF CONTENTS
2.1 Production, Consumption, and Import ... 7
2.2 Rice Policies in Indonesia ... 11
2.3 Indonesian Rice Market Chain ... 14
2.4 Previous Studies on Rice Price Transmission in Indonesia ... 16
III THEORETICAL BACKGROUND ... 19
3.1 Price Volatility and Price Stabilization Policy ... 19
3.2 Price Transmission and Market Integration ... 22
3.3 Operational Framework ... 24
IV METHODS ... 27
4.1 Data and Sample Collecting Method ... 27
4.2 Data Processing and Analysis Method ... 27
4.2.1 Volatility Analysis ... 27
4.2.2 Price Transmission Analysis ... 28
V RESULTS AND DISCUSSION ... 33
5.1 Rice Price Volatilities ... 33
5.2 Rice Price Transmission and Market Integration ... 34
5.2.1 Unit Root Test ... 34
5.2.2 Cointegration and Error Correction Models ... 36
5.3 Discussion and Policy Implications ... 46
VI CONCLUSION AND RECOMENDATIONS ... 51
6.1 Conclussion ... ... 51
6.2 Recomendations ... 52
REFERENCES ... 53
LIST OF TABLES
Table Page
1 Harvested area, production, and yield of rice in Indonesia in
2000-2012 ... 9
2 Harvested area, production, and yield of rice per province in 2011 ... 10
3 The price volatilities of producer, rice miller, wholesaler, and retailer 33 4 Unit Root test result ... 35
5 Cointegration test for producer-rice miller ... 36
6 Error Correction Model for producer-rice miller ... 37
7 Cointegration test for producer-wholesaler ... 38
8 Error Correction Model for producer-wholesaler ... 39
9 Cointegration test for producer-retailer ... 40
10 Error Correction Model for producer-retailer ... 41
11 Cointegration test for rice miller-wholesaler ... 41
12 Error Correction Model for rice miller-wholesaler ... 42
13 Cointegration test for rice miller-retailer ... 43
14 Error Correction Model for rice miller-retailer ... 44
15 Cointegration test for wholesaler-retailer ... 44
16 Error Correction Model for wholesaler-retailer ... 45
LIST OF FIGURES
Figure Page
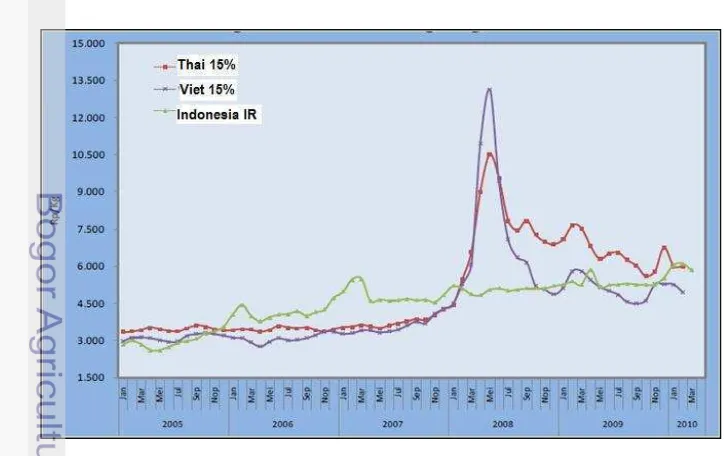
1 Comparison of rice prices between Indonesia, Thailand, and
Vietnam in 2005-2010 ... 2
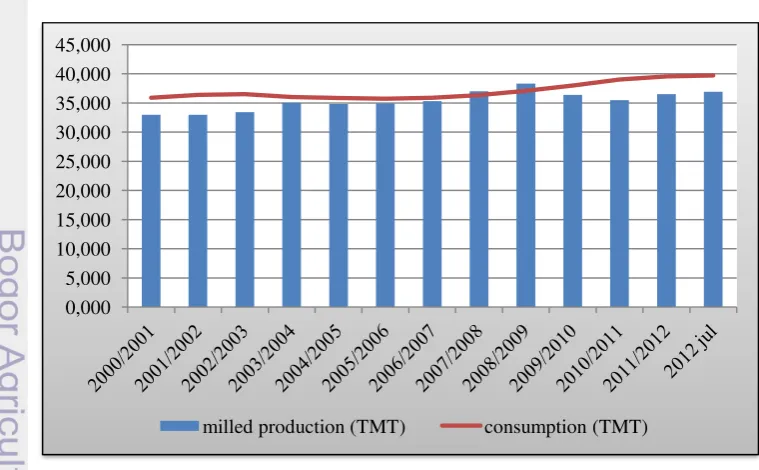
2 Comparison of rice production and consumption in Indonesia .... 7
3 Indonesian rice import in 2000-2012 ... 8
4 Seasonal paddy crop calendar ... 11
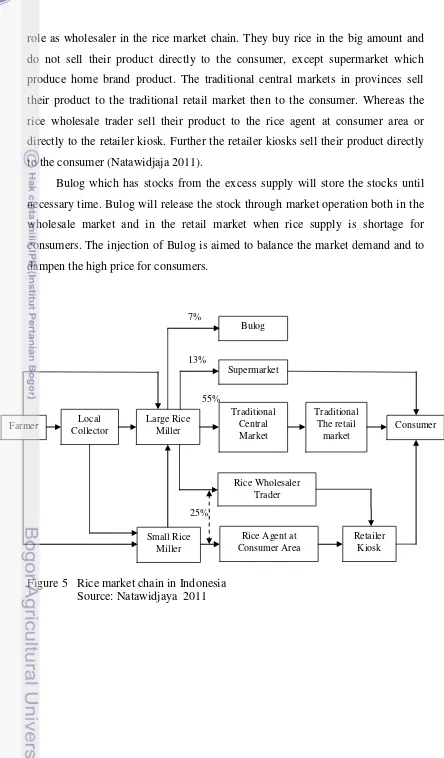
5 Rice market chain in Indonesia ... 15
6 Conventional analysis of supply-induced price variability ... 20
7 The enforcement of floor price to stabilize price in the market ... 21
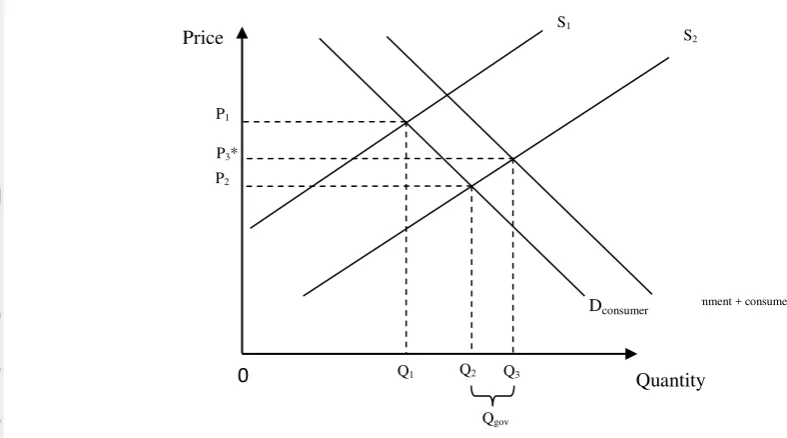
8 The enforcement of government purchasing price to stabilize price in the market ... 21
LIST OF APPENDIXES
Appendix Page
1 F-test for test the significance of variance differences
of rice prices before and during crisis ... 58
2 Graph of producer price and rice miller price in
2000-2012 ... 58
3 Graph of producer price and wholesaler price in
2000-2012 ... 59
4 Graph of producer price and retailer price in
2000-2012 ... 59
5 Graph of rice miller price and wholesaler price in
2000-2012 ... 60
6 Graph of rice miller price and retailer price in
2000-2012 ... 60
7 Graph of wholesaler price and retailer price in
ABBREVIATIONS
ADF Augmented Dickey Fuller
AIC Akaike Information Criteria
BPS Badan Pusat Statistik (Statistics Central Board)
BULOG Badan Urusan Logistik (National Logistics Board) ECM Error Correction Model
FAO Food and Agricultural Organization
FAS Foreign Agricultural Service
GDP Gross Domestic Product
HPP Harga Pembelian Pemerintah (Government Purchasing Price)
IFAD International Fund for Agricultural Development
IMF International Monetary Fund
LOI Letter of Intent
MP Rice Miller price
MT Million Ton
PP Producer Price
RASKIN Beras untuk masayarakat miskin (Rice for the poor) RP Retailer Price
SD Standard Deviation of Return
USDA United States Department of Agriculture
I INTRODUCTION
1.1 Background
“Pangan Rakyat adalah Soal HIDUP ATAU MATI”
“Food for People is about LIFE OR DEATH”
Soekarno, First President of Indonesia. Bogor, 27 April 1952
This quote is the title of President Soekarno’s speech in the cornerstone -laying ceremony for the Faculty of Agriculture in the University of Indonesia
(now Bogor Agricultural University). This quote emphasizes the important of
food for people, especially rice for Indonesian people. He also stated that to
provide sufficient amount of rice and maintain affordable rice price for people are
the important things to maintain the economic stabilization in the country. Many
efforts to depress other prices are nothing when rice price is not stable and not
affordable (Soekarno 1952).
Rice price has important role for Indonesia with respect to poverty,
economic growth, and food security. The level of rice price is the most important
determinant of poverty at household level in the short-run. The Indonesian
households spent about 10% of their income and the poor households spent about
20-25% of their income to buy rice. The consumption per capita of rice in
Indonesia is the 3rd highest in the world; it is about 139,1 kg/year/person. The
unaffordable and unstable rice price brings the disaster for the poor. The poor
always bear the brunt of bad economics, and then this condition inhibits the
poverty alleviation (Timmer 2004).
In addition, rice commodity has strategic roles both economically, socially,
and politically. In January 2012, the national inflation was at 0,76% and rice
contributed by 0,18% (BPS 2012). The inflation of rice price will trigger the other
goods prices. The severe high prices of food can trigger the riot of society and
disrupt the stabilization of politics. Even it can drop the government power. This
The food crisis in the world market occurred twice in the last decade . The
first crisis took place in 2007/2008 and the second crisis in 2010/2011. The food
prices increased slowly and steadily before, then in the beginning of 2007 food
prices took off and reached its peak in the mid of 2008 (FAO 2011). The staple
food prices surged significantly in the world market in this period, for examples
maize price increased by 74%, wheat price increased by 124%, and rice price
increased by 224% (World Bank 2008). Further, after mid 2008 food prices
declined but then increased again in 2010 and reached its recorded peak in
February 2011 (FAO Global Food Price Monitor 2011).
The high food prices have severe implications for food and nutrition
security, macroeconomic stability, and political security (Braun 2008). Data from
FAO (2008) show that the number of undernourished people increased from 848
million in 2005 to 963 million in 2008 due to the food crisis. The food crisis in
2007/2008 affected the economic growth of many developing countries which
active as exporter and importer in the world rice market. The economic growth of
these countries were dropped to negative rate, for example, in 2008 the economic
growth of Singapore at -8,9%, Thailand at -7,11%, Malaysia at -6,2%, and the
Philippines still had positive economic growth with declining growth rate (World
Bank in Tambunan 2010).
Figure 1 Comparison of rice prices between Indonesia, Thailand, and Vietnam in 2005-2010 period
On the contrary Indonesia had positive economic growth at 6,2%, though
then it declined into 5,2% in the last quarter of 2009. Many studies conclude that
the food crisis in 2007/2008 did not affect Indonesian economy, especially in the
rice market. The high price of rice in the world market was not transmitted into
the rice price in Indonesia (Timmer 2008; BAPPENAS 2009; Keats et al. 2010;
Tambunan 2010; Dawe 2011). The rice production performed well in 2007. It can
provide enough rice stock and injection of rice supply for domestic market. In
addition the government of Indonesia also controlled on quantity of rice traded
internationally with trade restrictions (Dawe 2011). One of the government efforts
to prevent the rice selling to abroad and also in order to maintain its stock is by
announced the ban policy on rice export early in 2008 before the peak of rice
harvest time (Timmer 2008). Bulog as the state enterprise, whose role to stabilize
the rice price, has managed well the excess supply from production and maintain
the rice supply to meet demand in the rice market. Therefore, the rice price was
stable with normal inflation in Indonesia (BAPPENAS 2009).
The price transmission occurs when the price changes in the one market of
any given commodity similarly reflected in the other market in different location
(spatially) or other level in the market chain (vertically), transaction costs and
marketing margin are assumed not be counted. One of the requirements for price
transmission is that the policies are not an obstacle for market (Keats et al. 2010).
Whereas, the government of Indonesia imposes many of the rice policies to
maintain stable rice price through maintain the stock, regulate the rice import,
purchase the excess supply of harvest from producer, inject rice supply into
market when supply from producer is shortage, and distribute rice for the poor
with low price. Bulog has the right to execute these policies. These policies will
influence the price determination in the rice market either directly or indirectly.
The other factors which influence price transmission is market power. In the
developing country such as Indonesia, the bargaining powers among market
institutions in the rice market chain are not equal. Farmers as producer have the
weakest bargaining power in the market chain due to the lack information about
market and the need for immediate cash after harvest time. Most of them cannot
immediately in harvest time with given price. The equilibrium price in harvest
time is low due to the abundant supply in the market (Bustaman 2003). Farmers
are the net consumer for rice. Mostly farmers sell their product in unhusked form,
without storing the stocks for their need. The low revenue from rice production
implies the difficulties to buy their living needs, even for rice.
1.2 Problem Statement
The resilience of Indonesian economy in the rice price crisis in 2008 gave
benefit for domestic consumer with stable rice price. But how does this stable
price in the retail market impact the other market institutions in the rice market
chain? Does the rice price in retail market transmit to the wholesaler price, the rice
miller price, and the producer price? We can measure price transmission in the market chain to see how the market chain’s performance and the market efficiency during the period of price stabilization policy. The magnitude of price
transmission is important because it will affect the extent of adjustment by market
institutions in the market chain to stabilize price movements. In addition, the
prevailing price obtained by each level influences their welfare (Timmer 2008).
The rice price volatilities in each level of market chain are also important to
see, because the price volatility of rice might dampen the potential benefit of
higher price for the market institutions in the market chain by increasing the
uncertainty and distorting the economic planning (Braun 2008). In the short-run,
the price volatility increases risk and vulnerability for producer, rice miller,
wholesaler, and retailer in the market chain by mystify the market signals and
overcomplicate the decision making process (IFAD 2010 in UK Hunger Alliance
2011).
The government of Indonesia has intervened the rice market through variety
of policy instruments. These interventions very likely influence the market
performance, especially the price transmission process. This study wants to find
how the government interventions influence the market performance of the
Indonesian rice market chain, especially the price volatility and the price
1) How volatile are rice prices of producer, rice miller, wholesaler, and
retailer?
2) How are the rice price transmissions between producer, rice miller,
wholesaler, and retailer in the rice market chain of Indonesia?
3) What are the policies implications from this study for the government of
Indonesia?
1.3 Objectives of Study
The objective of this research is to assess the market performance of rice
market chain in Indonesia namely the price volatility of rice and the extent of
market integration and price transmissions between producer, rice miller,
wholesaler, and retailer in Indonesian rice market chain. This study also analyzes
the policy implications of this study.
1.4 Scope of Study
The scope of this study is the price volatility analysis and the price
transmission analysis among producer, rice miller, wholesaler, and retailer in the
rice market chain of Indonesia. This study uses secondary data of national
average rice price at each level in monthly series data from January 2000 until
May 2012. This period is taken for analysis relates to the period of new
intervention approach by the government of Indonesia to maintain stable price in
the rice market. This study uses standard deviation of return, Cointegration test,
and Johansen Maximum Likelihood Error Correction Model. The data processing
uses Excel and Jmulti Software.
1.5 Organization of study
The organization of this study is structured as follows. Chapter 1 describes
the background of this study, the problems, the objectives, the scope of study, and
the organizations of study. Chapter 2 describes the condition of Indonesian rice
market. Chapter 3 explains the literature reviews about theory and the framework
results and discussion. Chapter 6 concludes this study with conclusion, policy
II THE INDONESIAN RICE MARKET
2.1 Production, Consumption, and Import
Indonesia is the 3rd biggest rice producer country in the world which
contributes about 7,85% of the world rice production, but in the same time as the
6th biggest rice importer which imported 1,25 MT in 2011/2012 or about 3,41% of
total world production (FAS USDA 2012). Indonesian rice production is lower
than its consumption. This condition makes Indonesia as a net importer of rice in
world market, after experienced successful green revolution and self-sufficiency
achievement in 1980s.
The rice production growth is hindered by the lack of production land due to
land conversion of arable land to non-agricultural uses such as industry and
settlement. Especially in Java as the most fertile land as well as the highest land
value compared to other major islands. The land rent for industry and settlement
purposes are about 500 and 622 times to land rent for agricultural purposes,
respectively (Nasoetion & Winoto 1996 in Kusumaningrum 2008). Therefore
many farmers sell their land or convert their land for building industry or
settlement.
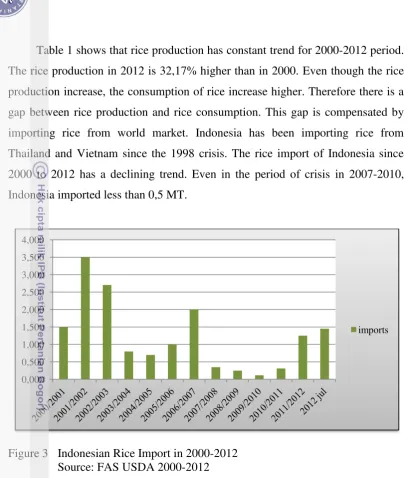
Table 1 shows that rice production has constant trend for 2000-2012 period.
The rice production in 2012 is 32,17% higher than in 2000. Even though the rice
production increase, the consumption of rice increase higher. Therefore there is a
gap between rice production and rice consumption. This gap is compensated by
importing rice from world market. Indonesia has been importing rice from
Thailand and Vietnam since the 1998 crisis. The rice import of Indonesia since
2000 to 2012 has a declining trend. Even in the period of crisis in 2007-2010,
Indonesia imported less than 0,5 MT.
Figure 3 Indonesian Rice Import in 2000-2012 Source: FAS USDA 2000-2012
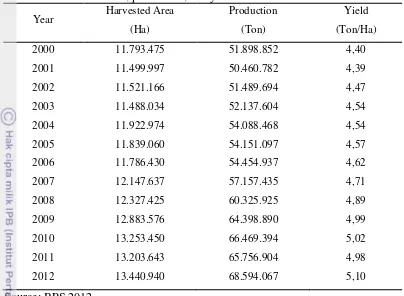
The Indonesian rice production increases steadily because the harvested area
also grow steadily. In 12 years the harvested area only increase 13,97% and the
national average for yield also not really significant increase. The yield in 2012 is
still at 5,1 ton/ha, it is under the ideal yield at 8 ton/ha. The lack of harvested area
needs the enhancement of yield to compensate it. The enhancement of yield still
difficult for Indonesia, there are still many problem to be solved. The
encouragement of new technology to produce higher yield and more stable
production along the year are needed. The extention program for farmers to use
new technology also needs to do continuously and massively to support the
Table 1 Harvested area, production, and yield of rice in Indonesia in 2000-2012
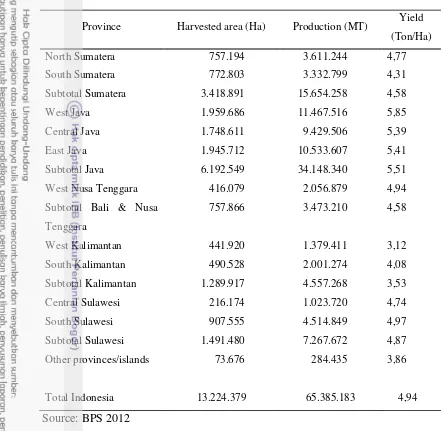
More than half of the national rice production is contributed by Java Island as the
most fertile land and the biggest farm labor forces. Java produces about 2,5 MT
per year or about 52% of the national rice production. The other islands like
Sumatera, Sulawesi, Kalimantan, and Bali with Nusa Tenggara contribute 24%,
11%, 7%, and 5% of the national rice production, respectively. The major rice
producing areas are West Java, East Java, Central Java, South Sulawesi, and
North Sumatera. In other hand for the other islands such as Kalimantan, Papua,
Maluku, and small islands are not suitable to be planted by paddy. They only
Table 2 Harvested area, production, and yield of paddy per province in 2011
Province Harvested area (Ha) Production (MT) Yield (Ton/Ha)
North Sumatera 757.194 3.611.244 4,77
South Sumatera 772.803 3.332.799 4,31
Subtotal Sumatera 3.418.891 15.654.258 4,58
West Java 1.959.686 11.467.516 5,85
Central Java 1.748.611 9.429.506 5,39
East Java 1.945.712 10.533.607 5,41
Subtotal Java 6.192.549 34.148.340 5,51
West Nusa Tenggara 416.079 2.056.879 4,94
Subtotal Bali & Nusa Tenggara
757.866 3.473.210 4,58
West Kalimantan 441.920 1.379.411 3,12
South Kalimantan 490.528 2.001.274 4,08
Subtotal Kalimantan 1.289.917 4.557.268 3,53
Central Sulawesi 216.174 1.023.720 4,74
South Sulawesi 907.555 4.514.849 4,97
Subtotal Sulawesi 1.491.480 7.267.672 4,87
Other provinces/islands 73.676 284.435 3,86
Total Indonesia 13.224.379 65.385.183 4,94
Source: BPS 2012
In Indonesia with sun shines all year around, farmers can grow paddy three
times a year. First crop season lasting from October to March, second crop from
April to August and third crop from August to December. The first crop produces
the main harvest. It produces about 60-65% of total national rice production in a
year. The second crop produces about 25-30% and the third crop produces about
5-15% of total national rice production (Ellis 1993 in Sari 2010). Farmers manage
their paddy cropping pattern adjusted with the availability of water. Paddy which
is planted in Indonesia is wet type; it needs a lot of water for growing. Therefore
mostly all farmers growing their paddy in rainy season (October-March). Whereas
vegetables, corn, sweet potatoes, and legumes which do not need a lot of water for
Planting Mid-season Harvest
Figure 4 Seasonal Paddy Crop Calendar
Source: Ministry of Agriculture, Indonesia 2012 in FAS USDA 2012
The seasonal cropping pattern implies that the rice supply is not constant
along the year. The excess supply occurs in the peak of harvest time at the first
crop in February and March. While in the second and third crop, the rice supply
cannot meet the rice demand in the market completely. In addition, the rice
demand of Indonesian market is inelastic or constant along the year. The
consequences of these conditions are the low price in the peak of harvest time and
the high price in the time of lack supply. These conditions are not good either for
consumer and producer. The low price in the peak of harvest time will hit farmers
and the high price in the lack of supply will burden consumers. The mentioned
conditions trigger high inflation and influence the macroeconomic condition.
Since new technology has not been found to address this condition, government of
Indonesia has been setting many policies to address these problems.
2.2 Rice Policies in Indonesia
Rice policies in Indonesia are comprehensive since it has been the most
important commodity for Indonesia economically, socially, and politically. The
Indonesian rice policies are divided into two types, anticipation policy and market
intervention policy. Other than that the Indonesian rice policies can be divided
into three phases based on the regime period of market policies. Sari (2010)
First phase is in 1967-1996 period, when the rice price was fully controlled
by government through market interventions in purpose to enhance and maintain
price stability. The full control power was given to Bulog as the only organization
who organize the rice trade in Indonesia. The Bulog rights including monopoly
right to control over international trade of rice, unlimited access to credit facilities
from Bank of Indonesia, right to impose floor price and ceiling price as guarantee
price for producer and consumer, right to procure the excess supply of rice from
farmer as much as necessary to lift the rice price in harvest time until the
determined floor price, the facilities of extensive logistical warehouses for rice
stocks, and right to sell the stocks by mean of ceiling price. In this condition, price
stabilization policy had succeed to dampen price volatility, stimulated the
enhancement of rice production, and achieved rice self sufficiency in 1984. But
the implementation of these policies paid high cost.
The second phase is in 1997-2000 period, when rice market of Indonesia was fully liberalized. In this period, all Bulog’s rights were omitted, import tariff was eliminated into 0% and all forms of the farm subsidies were repealed. These
are the implication of the Letter of Intent (LOI) between the government of
Indonesia, World Bank and International Monetary Fund (IMF) as the offered
solution to overcome the financial crisis in 1998. With zero import tariffs, the
Indonesian rice market was dominated by imported rice almost 6 MT from
Thailand, Vietnam, and USA. Therefore the food self sufficiency was dropped in
this period. There was no incentive for farmer to growing paddy. This condition
was exacerbated by El Nino effect. In this period the rice prices in farmer market
and consumer market were not stable. Inflation in this period was about 77,63%, it
brings on -13,13% of economic growth for Indonesia.
After severe crisis in 1998, Indonesian economy moved on gradually. Since
2001 until now 2012, the government of Indonesia has been controlling the
domestic rice market again with modified rules. The Indonesian rice market
system is not tough enough for free trade, especially for the small farmers who
have weak bargaining power and high dependency to rice production. The new
enhancement, food diversification, price policies, import policies, and rice
distribution for the poor (www.bulog.co.id).
Bulog transformed to be a state enterprise with public company status.
Bulog has mandates to maintain price stabilization in the rice market through
(www.bulog.co.id):
1) Domestic Procurement.
Bulog has right to procure the excess supply of rice in the harvest time from
domestic market with determined Government Purchasing Prices (Harga
Pembelian Pemerintah/HPP) and determined characteristics. The previous
policy of floor price as the guarantee price for producer in the New Order is
replaced by the Government Purchasing Price as a reference price for
producer price. Bulog is given budget to procure about 7-8% of the total
production (Natawidjaja 2011). Bulog purchases the excess supply by create
a new demand in the market. Bulog only purchases the products which meet
the requirement of HPP, so Bulog does not absorb the whole excess supply
and does not guarantee the rice price for producers.
2) Manage Government Rice Reserve (Stock).
Bulog manage Government Rice Reserve as an anticipation way for food
shortage problems, emergency in the case of disaster or food insecurity, and
as a tool for rice price stabilization. Bulog gets the stock from domestic
procurement and release it by the Market Operation and the Rice for the
Poor Program. Every year Bulog has to provide stocks depends on the
previous stock and the forecasting supply and demand. Ideally, Bulog has to
have 0,75-1,25 MT in stock each year. These policies succeed to maintain
dampen the high price of rice in the market. Market Operation will be held
if rice price rises in one week about 10% or more of the normal price
Minister of Trade no.04/M-DAG/PER/1/2012). The rice price is determined
on the open market depends on supply and demand, but the Government
through Bulog intervenes by inject rice supply into the rice market with
Market Operation (Alexander & Wyeth 1995). In addition, Bulog has
mandate to distribute rice for the poor (Raskin) with lower price directly to the targeted household. Bulog distributed 15 kg of rice/month for each poor
family by IDR 1.600/kg.
4) Rice Import Policies.
Beside maintain domestic supply, Government also regulate the rice import
mechanism. The rice import regulation is ruled by Decree of the Minister of
Industry and Trade No. 9 Year 2004. This regulates that the rice import is
banned in one month before main harvest, at main harvest, and two months
after main harvest. The harvest time is determined by the Minister of
Agriculture each year due to uncertain harvest time related to climate
anomalies. The right to import rice is given to Bulog with tariff import at
IDR 550/kg and import quota at 1,5 MT.
2.3 Indonesian Rice Market Chain
The rice market chain is the flow of rice from farmer in the production point
to consumer in the retail market. Natawidjaja (2011) described the rice market
chain in Indonesia consists of several marketing channels and marketing agencies.
Most of the farmers sell their product to local collector, but some of them sell
directly to large rice miller and small rice miller. The local collector is the
middleman between farmer and large rice miller. In this part, farmers have weak
bargaining power over buyers in the harvest time, because supply is redundant
whilst the number of traders are less than farmers. Often price is determined by
the trader.
Further, the paddy harvests are processed to be rice by rice milling unit. The
rice millers distribute rice dominantly to the traditional central markets in the big
cities or the capital of provinces. The rice supply to traditional central market is
role as wholesaler in the rice market chain. They buy rice in the big amount and
do not sell their product directly to the consumer, except supermarket which
produce home brand product. The traditional central markets in provinces sell
their product to the traditional retail market then to the consumer. Whereas the
rice wholesale trader sell their product to the rice agent at consumer area or
directly to the retailer kiosk. Further the retailer kiosks sell their product directly
to the consumer (Natawidjaja 2011).
Bulog which has stocks from the excess supply will store the stocks until
necessary time. Bulog will release the stock through market operation both in the
wholesale market and in the retail market when rice supply is shortage for
consumers. The injection of Bulog is aimed to balance the market demand and to
dampen the high price for consumers.
2.4 Previous Studies on Rice Price Transmission in Indonesia
There are several studies about rice price transmission in the Indonesian
market. These studies can illustrate how price transmissions had worked in the
rice market of Indonesia, with variety of cases and conditions. The rice price
performs in vertical and spatial markets from domestic market, national market
and international market. The price transmission performances of Indonesian
market also will be different depends on the time period of regime related to
different policies.
In the international market case, Aryani (2009) found that the Indonesian
rice market is integrated with Thailand and the Philippine with very weak level of
cointegration. This condition might be caused by the persistence of import control
policies (both tariff and non tariff) which are applied by these countries for rice
trade. In the other study, the Indonesian central market (Jakarta) is cointegrated
with international market (Bangkok) and domestic markets in Indonesia (Irawan
2006). The domestic markets are counted from the average rice price of 33
provinces in Indonesia. The study shows that if the international rice price
increases by 1%, it will increase the domestic rice price by 0,4%. Whereas if the
central market price in Jakarta increases by 1%, the domestic rice price will
increase by 0,66%. The contrast result from Conforti (2004), he used annual price
series and found that Indonesian rice market and international rice market are not
cointegrated. But with the causality test, his study found that Bulog which holding
monopoly power and managing domestic policies, following the world market
price trends.
In the national market case for spatial market integration, the price
transmissions among retail markets are not fully cointegrated. There are only 10
cointegrating vector from 12 retail markets in Indonesia, with Jakarta as a referred
market. The wholesale markets are also not fully cointegrated. There are
cointegrating vectors among Jakarta, Medan, and Makasar, but no cointegration
between Makassar and Surabaya (Sari 2010).
The previous study from Istiqomah (2006) supports this results that the
domestic markets in Indonesia are not fully integrated. In her study, she did
shows both regimes before and after liberalization is not fully cointegrated. The
number of cointegrating vectors after market liberalization is less than before.
There are about 22 cointegrating vectors of 26 domestic markets before market
liberalization, and then decreased into 12 cointegrating vectors of 24 domestic
markets after market liberalization. It means that the market liberalization made
Indonesian market more segmented, whereas the purpose of the market
liberalization is to build market to be integrated. She stated it may due to the
delayed response of market, the high transaction costs of storage and distribution,
non competitive market structure, the shortage of credit facilities, the slow
information flows, and the weakness of human capital. Alexander and Wyeth
(1994) studied the cointegration relationship among 27 provincial capitals of
Indonesia and CPI. They found that the CPI is cointegrated with all rice prices
series but without significant causality from it to rice prices.
Furthermore in the national vertical market, paddy price is cointegrated with
rice price with different pace of adjustment (Sari 2010). Rice price in the retail
market is more responsive when paddy price increases. When the rice price
increases in the retail market, paddy price is less responsive. It shows that there is
asymmetric price transmission in the vertical market of Indonesian rice market. In
the domestic case, Irawan and Rosmayanti (2006) analyzed the vertical and spatial
market integration in Bengkulu Province. Their study shows that the vertical
market integration between consumer and producer in Bengkulu is not formed.
Whereas the spatial market integration among the retail markets in Bengkulu are
formed.
The rice price volatility information is also useful to support the analysis.
The price volatility in the producer level is higher than the price volatilities in the
wholesaler and consumer market (Sari 2010). The rice price volatility in
1977-1997 is about 17-21% (Mears 1982; Pranolo 2001 in Rusastra et al. 2004).
Istiqomah (2006) found that the volatilities of paddy price and rice price were
affected by liberalization policy in 1998. After liberalization rice price in farmer
level was less volatile, whereas the rice price in consumer market was more
The liberalization policy high related with the existence of Bulog as the
state enterprise which hold the price stabilization right. Bulog’s policies considered to be too partial to consumers and sellers than producers or farmers,
thus the volatilities of paddy price in farmer level is more volatile than rice price
III THEORETICAL BACKGROUND
3.1 Price Volatility and Price Stabilization Policy
Price volatility explains the variance of data compared to their mean. The
price volatilities of food commodity are really important, especially for rice which
facing inelastic demand in the market. Price volatility will influence economic and
welfare of the society (Bustaman 2003). When rice prices increase, the
composition of public expenditure on rice will increase. These impacts are the
reduction of revenue allocation for the other needs such as education and health. If
the rice prices increase continuously and volatile, the more onerous burden for
society which can reduce the welfare of society including farmers as the net
consumer of rice.
In the Indonesian market, the standard of food volatilities determined by
Government Regulation about Food Security No. 68 Year 2002 and Regulation of
the Minister of Trade No. 22/M-DAG/PER/10/2005. These explain that high price
volatility or unstable price for staple food is when the increases of rice price
higher than 25% of normal price in a week.
Price stabilization on food can enhance economic growth and food security
(Timmer 1996; Timmer 2004; and Dawe 2011). The advantages of price
stabilization are that it can reduce the level of risk faced by producer and
stimulates farmers to invest more to produce rice and raise productivity,
meanwhile for consumer can get benefit from stable price and can alleviate
poverty. These notions assumed that rice price transmitted completely from
consumer to producer.
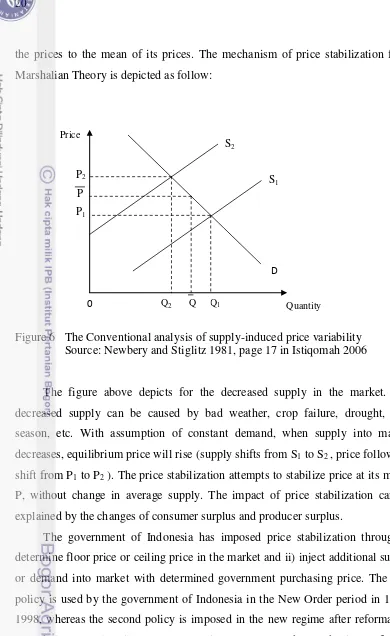
The price stabilization mechanism and its consequences are explained by
simple Marshalian theory from Waugh-Oi-Massell in Newbery and Stiglitz (1981)
(Istiqomah 2006). This theory assumes that the supply and demand are linear in
the market and will response instantaneously when there is change of supply or
demand, and additive stochastic disturbances. The changes of price equilibrium
in the market due to supply or demand changes in the short-run will cause price
the prices to the mean of its prices. The mechanism of price stabilization from
Marshalian Theory is depicted as follow:
Figure 6 The Conventional analysis of supply-induced price variability Source: Newbery and Stiglitz 1981, page 17 in Istiqomah 2006
The figure above depicts for the decreased supply in the market. The
decreased supply can be caused by bad weather, crop failure, drought, lean
season, etc. With assumption of constant demand, when supply into market
decreases, equilibrium price will rise (supply shifts from S1 to S2 , price follows to
shift from P1 to P2 ). The price stabilization attempts to stabilize price at its mean,
P, without change in average supply. The impact of price stabilization can be
explained by the changes of consumer surplus and producer surplus.
The government of Indonesia has imposed price stabilization through i)
determine floor price or ceiling price in the market and ii) inject additional supply
or demand into market with determined government purchasing price. The first
policy is used by the government of Indonesia in the New Order period in
1967-1998, whereas the second policy is imposed in the new regime after reformation
period since 2005 until now (Kusumaningrum 2008). The mechanisms of price
stabilization of these methods are depicted bellow: P
P2
0 Q2 Q Q1
P1
Price
Quantity D
S2
.
Figure 7 The enforcement of floor price to stabilize price in the market Source: Kusumaningrum 2008
Figure 7 explains that when supply increases from S1 to S2, then the price
decreases from P1 to P2, the government imposes the floor price as the minimum
price which is allowed. The consequence of this policy is that the government has
to purchase rice as much as the excess supply/surplus (QS*-QD*) with the
determined floor price in the market. In this case, government guarantee that the
price in the market will not being lower than the floor price.
Figure 8 explains how the government purchasing price by Bulog works to
stabilize price in the market. The government effort to stabilize price through
inject additional demand into market with determined price, determined
characteristics and depends on the capability of Bulog to purchase for stocks.
Government has had a percentage of purchase equal to 8 percent of all the existing
supply in the main harvest time. With the proportion of 8 percent, the government
easier in budgeting, planning, and budget calculation. There is no guarantee for
price in the market for the case of government purchasing price. The rice price
equilibrium depends on the supply and demand in the market. The government
purchasing price takes a role just as referenced price for market.
3.2 Price Transmission and Market Integration
Price transmission and market integration topic has been growing to be the
important issue in agricultural market policy. This issue becomes one of
considerations for decision making process in agricultural market policy due to its
advantages to give insight about the effect of its implementation for the economic
welfare. Price transmission parameter useful to indicate the direction, the
magnitude and the distribution of benefit and the cost of trade policy
implementation (Rapsomanikis et al. 2006)
There is no formal definition about price transmission. But there are some
concepts required to determine the price transmission and market integration. The
price transmission reflects the extent of market integration. Fackler and Goodwin
(2001) defined two markets are integrated if shock in one market is transmitted to
the other market. Specifically for illustration, goods X in market A is integrated
with market B if shock in the market A for example the demand changes will
influence the goods X price both in market A and market B. This indicates that
goods X has long-run cointegration among market A and market B.
Barrett (2001) said that price transmission or market integration as the
satisfaction of the Law of One Price (LOP). The LOP states that if trade occurs
between two markets and all profitable arbitrage opportunities are eliminated, the
The LOP is supposed to regulate for spatial market integration, whereas for
vertical market integration depends on production costs (Conforti 2004)
In addition, a basic concept, which is always used in spatial market
integration analysis, is the Enke-Samuelson-Takayama-Judge model. This model
postulates that price transmission is occurred when changes of price of one
commodity in one market (P1t) transmitted to the price in other market (P2t) with
reflected price plus transfer cost (C). Transfer cost in the spatial market context
for example is transport cost, whereas in the vertical market is marketing margin
(Brümmer et al. 2009). This postulate follows the Law of One Price postulate
(LOP). The relationship between the prices is as follows:
P1t = P2t + C ... ... (1)
There are three notions of price transmission concept, they are co-movement
and completeness of adjustment, dynamic and speed of adjustment, and symmetry
or asymmetry response adjustment (Rapsomanikis et al. 2006). Price transmission
analysis can be used to check the degree of market efficiency, in terms both of
them close to the competitive model (Barrett & Li 2002).
The degree of price transmission depends on some factors, these factors can
disrupt or even omit the price transmission. They are transaction costs,
transportation cost, market power, increasing return to scale in production,
product homogeneity and differentiation, exchanges rates, border and domestic
policies, market imperfection (Conforti 2004; Keats et al. 2010), market structure
(Braun 2008), trade policies, marketing margin, and communication infrastructure
(Rapsomanikis et al. 2006). The government policies can impede the price
transmission through agricultural policy instrument such as import tariffs, tariff
rate quota, export subsidies or taxes, and interventions mechanism. But
government policies not always hinder price transmission and market integration,
it depends on the nature of the policy instruments employed (Rapsomanikis et al.
2006).
Price transmission in the market chain is included into vertical price
“the adjustment to price shocks along the chain from producer to wholesaler and to retail levels, and vice versa.” Price transmission analysis which involved the intermediate in the market chain can show how the successive price transmission
of shock from the point of origin until the end of market chain. Imperfect
pass-through among intermediate can impede the price transmission and the transferred
benefit from consumer to producer, and vice versa. Vertical price transmission has
important role to determine the effects of trade policy in the size and the
distribution of welfare (Vavra & Goodwin 2005).
There is one characteristic of vertical price transmission which is often
found in the market chain of food commodity, this is asymmetric price
transmission. It emphasizes the different pace responses from price reduction and
price increase (Vavra & Goodwin 2005). The price reduction of food commodity
in farm is transferred through the market chain slowly and possibly not fully until
consumer. Whilst, the price increase at farm level is transmitted quickly through
market chain until consumer. The possibility causes of asymmetry price
transmission are the present of many small intermediaries (Peltzman 2000),
market concentration and market power (McCorriston & Sheldon 1996).
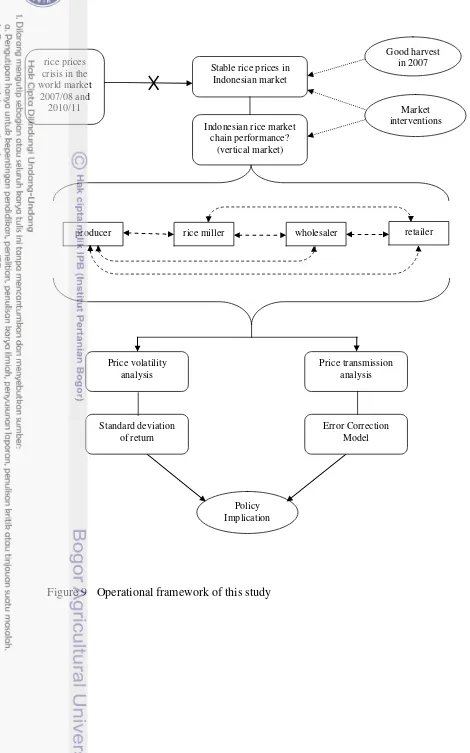
3.3 Operational Framework
The background of this study is the resilience of the Indonesian rice market
faced the world rice price crisis in 2007/2008 and in 2010/2011. Beside the effect
of good harvest in 2007, the stable price also comes from the enforcement of
comprehensive policies by the government of Indonesia to maintain stable price in
the consumer market. The phenomena raise a question how about the rice market
chain performance in this period? The good condition in the consumer market
should be transferred to the production market, so producers in the production
point get the same benefit like consumers (the transferred benefit).
This study analyzes the relationships between producer price-rice miller
price, producer price-wholesaler price, producer price-retailer price, rice miller
wholesaler price, rice miller retailer price, and wholesaler
price-retailer price. We analyze the market chain performance through price volatility
deviation of return and price transmission analysis uses Error Correction Model.
From this study we supposed to get the insight about the market integration along
Indonesian rice market chain, whether this is integrated or not. Then we analyze
the possible related causes and analyze the effects of the government interventions
into the price transmission performance. We can recommend the policy
implication from this study relate to the rice policy and the price transmission in
Figure 9 Operational framework of this study rice prices
crisis in the world market
2007/08 and 2010/11
Stable rice prices in Indonesian market
Good harvest in 2007
Market interventions Indonesian rice market
chain performance? (vertical market)
producer rice miller wholesaler retailer
Price volatility analysis
Price transmission analysis
Policy Implication Standard deviation
of return
IV METHODS
4.1 Data and Collecting Method
The study uses national average monthly data of rice prices in producer
level, rice miller level, wholesaler level and retailer level from January 2000 until
May 2012. These data are secondary data, which are collected from relevant
institutions in Indonesia. They are Bulog (Logistic Department of Indonesia),
Statistics Central Board of Indonesia (BPS), Directorate General of Processing
and Marketing of Agricultural Products in the Ministry of Agriculture, and PT
Food Station Tjipinang Jaya.
4.2 Data Processing and Analysis Method
This study analyzes the price volatility by determine the standard deviation
of return of each level in the market chain and the price transmission analysis by
Error Correction Model. The steps on this analysis are Unit Root Test,
Cointegration Test, and estimation of Error Correction Model. The processing
data will use excel and Jmulti software.
4.2.1 Volatility Analysis
The price volatility shows how much the price dispersion (price volatility)
from their mean (Kotze 2005). This study uses the standard deviation of return to
find out the price volatility of time series data. If the price volatility is bigger, it
can be concluded that the price series have a tendency to fluctuating with the
mean. The equation to estimate the standard deviation of return is:
u1 = ln (Pt) – ln (Pt-1) = ln (Pt/Pt-1) ... (2)
Note:
u1 = the standard deviation of return; Pt = current price; Pt-1 = past price
This study analyze the price volatilities of four market institutions in the
market chain, they are producer price, rice miller price, wholesaler price, and
volatilities show the impact of market interventions. In addition we will compare
the volatilities of rice price between before crisis period in 2000-2006 and during
crisis period in 2007-2011. We use F-test to test the significance of difference
between before and after crisis. The hypotheses are:
H0: σ12 ≤ σ22 (the variances before crisis and during crisis are similar)
H1: σ12 > σ22 (the variance before crisis is higher than during crisis)
We compare the F-value to the F-table; we reject Hypothesis null if F- value
is bigger than F-table. We get the F-value from the simple formula, F-value =
s12/s22. The results of this comparison will show us whether there is any
differences of price volatility between before crisis period and during crisis
period. The critical value for F-table (95%, 85,64) is 1,4824. Note: df 85 is the number
of series before crisis (N1 = 85) and df 64 is the number of series after crisis (N2 =
64).
4.2.2 Price Transmission Analysis
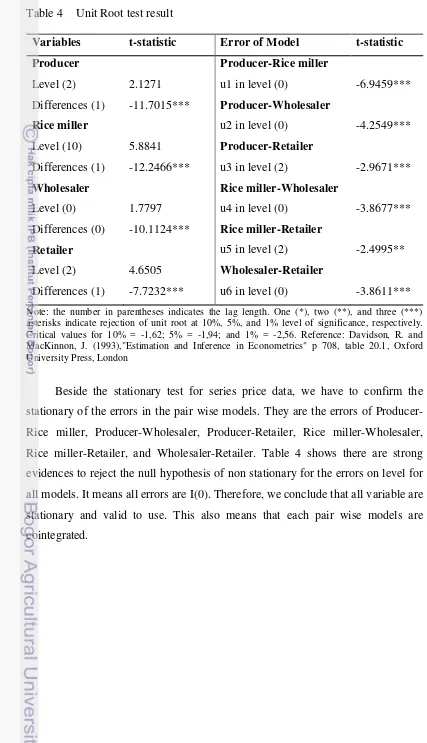
The analysis of price transmission starts by investigating the stationary of
series data by unit root test, then continue to the cointegration test and the Error
Correction Model (ECM) analysis.
a. Testing for Unit Roots
First step to process price transmission analysis is that we have to examine
the stationary of the data series through unit roots test. The stationary of each
series data is needed to prevent the spurious regression in the model. We want to
confirm whether the series data are stationary in the same order or not. The data
will be valid to use if the variables in the model are in the same order.
Xt = Xt-1 + ɛt ... (3)
Dickey Fuller. The unit root test can be analyzed by using Augmented Dickey
Fuller test (ADF). The specification of Augmented Dickey Fuller model is:
Xt– Xt-1 = Xt-1 – Xt-1 + ɛt ... (4)
Δ Xt= ( -1) Xt-1 + ɛt ... (5)
Δ Xt= ( -1) Xt-1 + ∑ ΔXt-j + ɛt ... (6)
The hypotheses of this test are:
H0: = 1 (data has a unit root or data is not stationary)
H1: ≠ 1 (data does not have a unit root or data is stationary)
The test criterion is: we reject Ho if t-value is bigger than t-table. The
critical values for 10% = -1,62; 5% = -1,94; and 1% = -2,56. In this study we
assess the stationary of producer price, rice miller price, wholesaler price, and
retailer price in the level I(0) and in the differenced form I(1) . We also assess the
stationary of the errors from the models of producer price-rice miller price,
producer wholesaler price, producer retailer price, rice miller
price-wholesaler price, rice miller price-retailer price, and price-wholesaler price-retailer
price. We also want to confirm that the relationships among them are valid and
cointegrated.
b. Determination of the Optimum Lag
Determination of the optimal lag for the regressed variable in the equation is
purposed to avoid the possibility of residual autocorrelation in the series of rice
price. We use Schwarz Bayes Criterion to choose the appropriate lag length.
Schwarz Bayesian Criterion has shorter lag length than Akaike Information
Criterion, which frequently used. We supposed Schwarz Bayesian Criterion is
more appropriate for this study; due to the rice production cycle in Indonesia is
three times a year. So we supposed the dynamics short-run of price transmission
are happened within no more than 4 months.
c. Cointegration test
Cointegration test between two series data analyzed the tendency toward
one common behavior in the long run, even in the short-run they behave in the
different way. The aim of cointegration test is to analyze the existence of
cointegrating vector in the model. We can test the cointegration through verify the
order of variables and its error and the Johansen Trace test. In the first test we
have to verify whether Px and Py are stationary in the same order and the error
stationary in the level from Py= α + Px + ɛt. If these are confirmed, it means that
Px and Py are cointegrated. This study also uses Johansen Trace Test to determine
the existence of cointegrating vector in the model. There are two hypothesis tested
here:
1) Rank test 0
H0: There is no cointegrating vector
H1: There is one cointegrating vector
2) Rank test 1
H0: There is one cointegrating vector
H1: There are two cointegrating vectors
We reject H0 if eigenvalue (LR) is bigger than the level of significant or
P-value less than critical P-value (α). We test the existence of cointegrating vector in the models of: producer price-rice miller price, producer price-wholesaler price,
producer retailer price, rice miller wholesaler price, rice miller
price-retailer price, and wholesaler price-price-retailer price.
.
d. Error Correction Models
The characteristics of the dynamic relationship can be explained by Error
Correction Model (ECM). This study uses the Johansen Maximum Likelihood
Error Correction Model to estimate the dynamics in the short-run, the dynamics in
the long-run equilibrium, and koefficient of the ECM simultaneously by one step.
The specification of Error Correction Model is:
ΔPXt= a + ∑ iΔPX t-i + ∑ iΔPYt-i+ α1 [PX t-1 - θ1PY t-i + c] ... (7)