Lampiran 1
A. Data Responden
Berilah tanda centang (√) pada jawaban anda
1. JENIS KELAMIN : LAKI-LAKI PEREMPUAN
2. USIA : < 20 tahun
20-30 tahun 31-40 tahun > 40 tahun
3. PENDIDIKAN : SMP
SMA
LAINNYA
4. PEKERJAAN : BURUH TETAP
PEDAGANG KAKI LIMA
TUKANG BANGUNAN
WIRASWASTA
LAINNYA
5. PENDAPATAN : Rp. 400.000,- s/d Rp. 650.000,-
Rp. 650.000,- s/d Rp 900.000,- > Rp. 900.000
B. Daftar Pertanyaan
Berilah tanda centang (√) pada jawaban anda
1. Locos of Conrol
NO. URAIAN SS S R TS STS
1. Apa yang terjadi pada hidup saya adalah akibat dari perbuatan saya sendiri.
2. Seringkali saya kurang mampu mengendalikan
tujuan hidup yang saya ambil.
3. Ketika saya membuat suatu rencana saya bias memastikan keberhasilan dari rencana tersebut. 4. Kondisi keuangan keluarga bergantung pada diri
saya.
Lampiran 3
FACTOR ANALYSIS
KMO and Bartlett's Test
Kaiser-Meyer-Olkin Measure of Sampling Adequacy. .875
Bartlett's Test of Sphericity Approx. Chi-Square 2155.762
df 105.000
Sig. .000
HASIL CFA
Rotated Component Matrixa
Component
1 2 3
LC1 .901 .181 .240
LC2 .869 .218 .271
LC3 .902 .166 .238
LC4 .788 .255 .297
LC5 .825 .267 .238
IA1 .247 .800 .289
IA2 .243 .823 .339
IA3 .205 .858 .280
IA4 .241 .819 .327
IA5 .174 .697 .397
KP1 .295 .422 .794
KP2 .359 .383 .791
KP3 .282 .371 .843
KP4 .306 .392 .831
KP5 .374 .350 .778
Extraction Method: Principal Component Analysis.
Rotation Method: Varimax with Kaiser Normalization.
Lampiran 4
VARIABEL PERCEIVED LOCUS OF CONTROL
Case Processing Summary
N %
Cases Valid 100 100.0
Excludeda 0 .0
Total 100 100.0
a. Listwise deletion based on all variables in the procedure.
Reliability Statistics
Cronbach's
Alpha N of Items
.955 5
VARIABEL PERCEIVED INCOME ADEQUACY
Case Processing Summary
N %
Cases Valid 100 100.0
Excludeda 0 .0
Total 100 100.0
a. Listwise deletion based on all variables in the procedure.
Reliability Statistics
Cronbach's
Alpha N of Items
VARIABEL PERCEIVED KEPUASAN PENGHASILAN
Case Processing Summary
N %
Cases Valid 100 100.0
Excludeda 0 .0
Total 100 100.0
a. Listwise deletion based on all variables in the procedure.
Reliability Statistics
Cronbach's
Alpha N of Items
Lampiran 5
b. Multikolinieritas
Heteroskedatisitas
Autokorelasi
Model Summaryb
Model R R Square
Adjusted R Square
Std. Error of the
Estimate Durbin-Watson
1 .805a .649 .641 2.867 1.838
a. Predictors: (Constant), income adequacy, locus of control
b. Dependent Variable: kepuasan penghasilan
Coefficientsa
Model
Unstandardized Coefficients
Standardized Coefficients
t Sig.
Collinearity Statistics
B Std. Error Beta Tolerance VIF
1 (Constant) -2.095 1.580 -1.326 .188
locus of control .379 .081 .337 4.689 .000 .703 1.422
income adequacy .725 .091 .571 7.951 .000 .703 1.422
Lampiran 6
Regression
Variables Entered/Removedb
Model
Variables Entered
Variables
Removed Method
1 income
adequacy, locus of controla
. Enter
a. All requested variables entered.
b. Dependent Variable: kepuasan penghasilan
ANOVAb
Model Sum of Squares df Mean Square F Sig.
1 Regression 1470.699 2 735.350 89.490 .000a
Residual 797.061 97 8.217
Total 2267.760 99
a. Predictors: (Constant), income adequacy, locus of control
b. Dependent Variable: kepuasan penghasilan
Coefficientsa
Model
Unstandardized Coefficients
Standardized Coefficients
t Sig.
Collinearity Statistics
B Std. Error Beta Tolerance VIF
1 (Constant) -2.095 1.580 -1.326 .188
locus of control .379 .081 .337 4.689 .000 .703 1.422
income adequacy .725 .091 .571 7.951 .000 .703 1.422
Lampiran 7
TABLE VALUES OF rproduct moment
N The Level of Significant N The Level of Significant
5% 1% 5% 1%
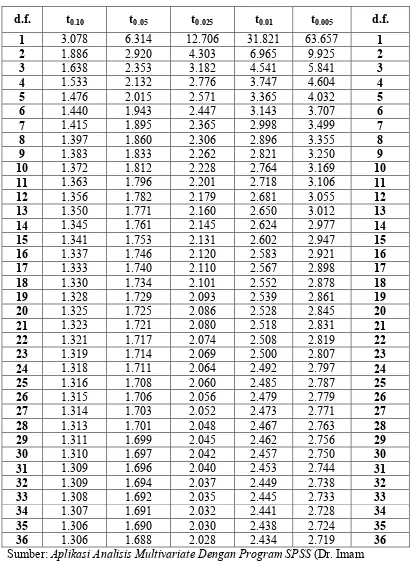
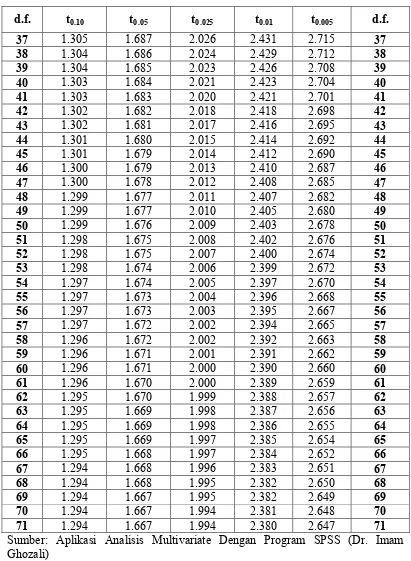
Tabel Nilai t
Tabel Nilai t
Tabel Nilai t
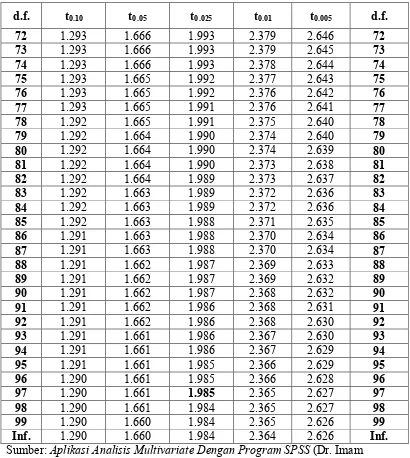
d.f. t0.10 t0.05 t0.025 t0.01 t0.005 d.f.
72 1.293 1.666 1.993 2.379 2.646 72
73 1.293 1.666 1.993 2.379 2.645 73
74 1.293 1.666 1.993 2.378 2.644 74
75 1.293 1.665 1.992 2.377 2.643 75
76 1.293 1.665 1.992 2.376 2.642 76
77 1.293 1.665 1.991 2.376 2.641 77
78 1.292 1.665 1.991 2.375 2.640 78
79 1.292 1.664 1.990 2.374 2.640 79
80 1.292 1.664 1.990 2.374 2.639 80
81 1.292 1.664 1.990 2.373 2.638 81
82 1.292 1.664 1.989 2.373 2.637 82
83 1.292 1.663 1.989 2.372 2.636 83
84 1.292 1.663 1.989 2.372 2.636 84
85 1.292 1.663 1.988 2.371 2.635 85
86 1.291 1.663 1.988 2.370 2.634 86
87 1.291 1.663 1.988 2.370 2.634 87
88 1.291 1.662 1.987 2.369 2.633 88
89 1.291 1.662 1.987 2.369 2.632 89
90 1.291 1.662 1.987 2.368 2.632 90
91 1.291 1.662 1.986 2.368 2.631 91
92 1.291 1.662 1.986 2.368 2.630 92
93 1.291 1.661 1.986 2.367 2.630 93
94 1.291 1.661 1.986 2.367 2.629 94
95 1.291 1.661 1.985 2.366 2.629 95
96 1.290 1.661 1.985 2.366 2.628 96
97 1.290 1.661 1.985 2.365 2.627 97
98 1.290 1.661 1.984 2.365 2.627 98
99 1.290 1.660 1.984 2.365 2.626 99
Inf. 1.290 1.660 1.984 2.364 2.626 Inf.