Procedia Engineering 125 ( 2015 ) 467 – 473
1877-7058 © 2015 The Authors. Published by Elsevier Ltd. This is an open access article under the CC BY-NC-ND license (http://creativecommons.org/licenses/by-nc-nd/4.0/).
Peer-review under responsibility of organizing committee of The 5th International Conference of Euro Asia Civil Engineering Forum (EACEF-5) doi: 10.1016/j.proeng.2015.11.125
ScienceDirect
The 5th International Conference of Euro Asia Civil Engineering Forum (EACEF-5)
Modelling road traffic noise for collector road
(case study of Denpasar City)
Putu Alit Suthanaya
a,*
a Civil Engineering Department, Udayana University, Jl. Kampus Bukit Jimbaran, Bali-Indonesia
Abstract
Population growth and development of activities in Denpasar City have a great influence on the development of transportation sector. The increase of population has been followed by high growth rate of private vehicles. This condition has increased environmental degradation, not only in terms of fuel consumption but also in terms of air pollution and traffic noise produced by motor vehicles. Traffic noise has caused negative effects such as communication difficulty, increase of stress, sleep disturbance, and also hearing problem. In order to overcome these problems, in the first instance, it is required to be able estimate the level of traffic noise produced by certain traffic volume. Therefore, it is important to understand factors that influence traffic noise. The objective of this study is to develop model estimation of traffic noise, in particular for collector roads. Traffic data collected included traffic volume (classified by vehicle types), speed, and road geometric. Data were analysed by using multiple linear regression method. This study found that as the proportion of motor cycle dominates the road traffic (about 75%), motor cycle volume was found to be the most significant traffic noise predictor. Holding other factors constant, the increase of 100 motor cycle will increase traffic noise LAeq for about 0.3 dB. The increase in LA10, LA50 and LA90 are 0.4, 0.4 and 06, respectively. The average error of the predicted value from the measured value for Leq is -2.33%. Average error for L10, L50 and L90 is +0.39%, -1.04% and +0.002%, respectively. This model of traffic noise level can be used to predict vehicle noise level for collector road with an average speed of vehicles between 23-49 km/hour.
© 2015 The Authors. Published by Elsevier Ltd.
Peer-review under responsibility of organizing committee of The 5th International Conference of Euro Asia Civil Engineering Forum (EACEF-5).
Keywords: Traffic noise; motor vehicle; collector road; regression model
* Corresponding author. Tel.: +08123660397; fax: +62-361-224124.
E-mail address: [email protected]
© 2015 The Authors. Published by Elsevier Ltd. This is an open access article under the CC BY-NC-ND license (http://creativecommons.org/licenses/by-nc-nd/4.0/).
468 Putu Alit Suthanaya / Procedia Engineering 125 ( 2015 ) 467 – 473
1.Introduction
Many cities have faced problems of increasing use of motor vehicles. High use of motor vehicles has increased environmental problems such as air pollution and traffic noise. Continuous exposure to unacceptable noise levels may lead to the environmental problems which might affect quality of life of the residents such as depression, sleep disturbance, annoyance, poor working efficiency and adverse health effects [1]. The environment noise costs societies 0.2%-2.0% of the gross domestic product (GDP) [2]. The annoyance produced by noise pollution has been studied and documented in scientific literature (see for instance [3, 4]). Therefore, the need for monitoring and predicting road traffic noise is evident. Road traffic noise may depend by several parameters, such as the traffic volume, the traffic flow typology, the vehicles typology, the road and pavement features, the speed, etc. [5].
Road traffic noise comes from several sources such as from engines, exhaust systems and interaction of tyre and road surface pavement and also the aerodynamic noise. The combination of several factors results in a quite complex source that cannot be easily modelled in all its features. Traffic noise model can be used to estimate the impact of traffic on the environment as a basis to design better road performances in terms of the geometric and pavement surface texture. The traffic noise model might be used to predict sound pressure levels, for example in terms of Leq, and L10 [6]. Many researches have conducted studies in order to improve noise measurement and prediction methods that help transportation agencies address the road traffic noise problem. Traffic noise has been recognised as one source of environmental pollution in many cities. Traffic noise models that have been developed so far, incorporated several variables such as the traffic flow, vehicle speed and noise level using regression analysis.
Road traffic noise is one of the main environmental problem that has been experienced by residents in many cities in the world including Denpasar City. Denpasar City is the capital of Bali Province with the population of 846.200 persons [7]. The number of motor vehicles increase at the rate of about 10 percent per year. This high increase in motor vehicles ownership has increased environmental problems such as air pollution and noise level.
Many researches about characteristics, impact and prediction method of traffic noise have been conducted in developed countries. However, only limited study has been done in developing countries, although the problem of traffic noise becomes more complex recently. There is lack of proper city planning and the very high noncompliance with traffic regulations. The objective of this study is to develop traffic noise model for collector roads in Denpasar City.
2.Literature Review
2.1.Previous Studies
Road traffic noise has been identified as a serious environmental problem worldwide. Development of traffic noise models are needed in order to evaluate traffic noise level and to investigate the reduction measures. Many countries have developed traffic noise prediction models. A noise prediction model for L10 was developed in Britain and published in 1975 as the first official prediction model called ‘‘Calculation of Road Traffic Noise’’[8]. In the United States, the Federal Highway Administration (FHWA) published ‘‘Highway Traffic Noise Prediction Model’’ in 1978, which is used to calculate LAeq in the vicinity of highways. A procedure for converting LAeq into Ldn and L10 was provided in this model for the purpose of noise assessment by national or local governments. In 2002, the European Noise Directive (Directive 2002/49/EC) was officially announced for the purpose of strengthening the noise policy of the European Union (EU). The feature of the traffic noise models is that they were developed with different conditions, such as noise index, mathematical model, and types of roads, vehicles, terrain, houses, etc. [9]. In US, the Federal Highway Administration [10] has developed further the FHWA Traffic Noise Model (FHWA TNM). The FHWA TNM predicts traffic noise levels based on acoustical algorithms and considering five type of vehicles: cars, medium trucks, heavy trucks, buses, and motorcycles.
In Japan, the Acoustical Society of Japan (ASJ) published the first version of a road traffic noise prediction method in 1975 (ASJ Model 1975). It was widely applied in the evaluation of traffic noise in the vicinity of roads. In April 2009, a new version, ASJ RTN-Model 2008, was published. The model is expected to be used in environmental impact assessment, and regular noise monitoring of existing roads [9].
model has been developed for the case study of roads in Sri Lanka [11]. Variable considered include traffic noise, vehicle class, speed and distance from the traffic flow line. Microsoft.Net platform was used to develop the simulator and the GUI. The accuracy of the model was within 11 dBA. Another study has developed a traffic noise model for Iranian cities [12]. The traffic noise prediction model for Iranian condition was developed based on regression method. It was found that the average LAeq value was 69.04± 4.25 dB(A), the average speed of vehicles was 44.57±11.46 km/h and average traffic load was 1231.9 ± 910.2 V/h. It was stated further that the model is only
applicable for traffic conditionwith speeds less than 90 km/h and traffic flow less than 5000 veh/h.
In Indonesia, a study on the contribution of the drainage pavement on road traffic noise was conducted in Makassar [13]. An artificial simulation has been conducted in order to grasp the effectiveness of the porous pavement in reducing the road traffic noise. The simulation is based on the ASJ RTN-2008 Model approach. It was found that the effectiveness of the porous pavement in reducing the noise level until 4 dB during the first year of its service life.
2.2.Traffic Noise Index
Scales and indices of traffic noise are developed in order to obtain a physical measure of sound level that correlates well with the perceived noisiness of the sound. The common measure used in the environmental acoustic is the 'A' weighted level and expressed as L dB(A) or LA dB. Noise scalescombine noise level with time which might be the level exceeded for a given proportion of time, as in LA10 dB, or an integration of level with respect to time, as in LAeq dB. Noise indices are developed in order to provide an assessment of noise in certain circumstances. In general, indices are developed from the noise scales by defining the time period over which the scale applies. In the UK the noise index LA10,18h dB is used to evaluate the traffic noise. This index was claimed to have a reasonably good correlation with average community responds to annoyance [14]. Other nations used LAeq index to evaluate road traffic noise [15].
The traffic noise index LA10,18h is based on the LA10 scale. This LA10 scale gives a measure of the level of noise exceeded for 10% of a given time period. The noise level is calculated based on the average of the values of LA10,1h for every one hour between 06:00 and 24:00 hours and is expressed as follow [15]:
(1)
where t signifies the start time of the individual hourly LA10,1h values in the period 06:00 – 24:00 hours.
A fundamental concept common to LAeq traffic noise models is to assume that road traffic consists of the movement of a collection of discrete vehicles and that traffic noise is the sum of their individual noise emission. Thus if the acoustic energy of an average single vehicle passby is known then the overall traffic noise level, LAeq, can be calculated by the summation of the energy from all the vehicle passbys in the traffic stream. LAeq is the equivalent sound level that if maintained would cause the same sound energy to be received as the actual sound over the same period. The equivalent sound level, determined from the actual sound levels during a period T is mathematically expressed as follows [15]:
(2)
where L(t) is the A-weighted sound level at time t and T is the duration of the exposed period (seconds). Noise index in the LA10 scale is influenced by the time distribution of noise events. Noise index in the LAeq scale sum the energies of all noise events independently.
3.Method
The study location is in Denpasar City as shown in Fig.1. Denpasar City is the capital of Bali Province (Indonesia) with the population of 846.200 persons. Total length of the road is 665.78 km. The number of motor vehicles registered are 1.654.313 units with the average increase rate of about 10 percent per year. This high increase in motor vehicles
ǡ ܮܣͳͲǡͳͺ݄ ൌͳͺ ܮܣͳͲǡ ݐሺሻͳ
௧ୀଶଷ
௧ୀ
470 Putu Alit Suthanaya / Procedia Engineering 125 ( 2015 ) 467 – 473
ownership has increased environmental problems such as air pollution and noise level. The number of traffic accident has also increased from year to year with the average number of accidents are about 565 accidents per year [7]. The quality of environment has decreased and the number of people exposed to high level of traffic noise have increased. Road traffic noises were measured at distance of 1.5 m from the edge of the carriageway of Teuku Umar Road with the height of 130 cm above the road surface. Traffic noise was measured by using Sound Level Meter Extech Model SDL600. Traffic volume and speed were measured by using video camera. Traffic volume was classified into motor cycle (MC), light vehicle (LV) and heavy vehicle (HV). In total there were 48 sets of data collected. Traffic noises
were measured in terms of LAeq, LA10, LA50 and LA90. All of the data were analysed by using Excel and SPSS
software. Multiple regression models were used to develop a traffic noise model for Denpasar City. Traffic noise in terms of LAeq, LA10, LA50 and LA90 were entered as dependent variables. Traffic volume of motor cycle (X1) light
vehicle (X2) and heavy vehicle (X3) were entered as independent variables.
Fig. 1. Study location
4.Results and Discussion
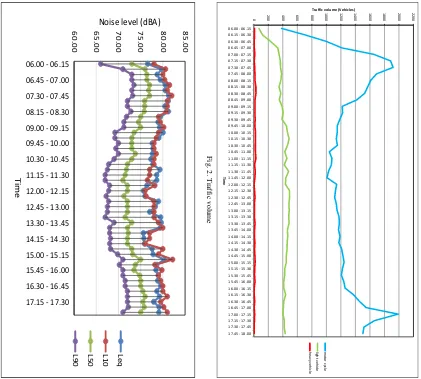
Fig. 2 shows variation of traffic volume during 12 hours measurement from 06.00 – 18.00 on Teuku Umar Road.
It can be seen that motor cycles dominate traffic volume (75.06%), while percentage of passenger car 24.11% and heavy vehicle 0.83%. Peak hour occurred in the morning and afternoon as this road function as a collector road serving commuter traffic movement. The average speed was measured at the same time as traffic volume measurement. The average speed varies from 23.08 km/h to 49.09 km/h with the average of 32.53 km/h.
Traffic noise levels were measured in terms of LA10, LA50, LA90 and LAeq. Fig. 3 shows variation of the traffic
noise level during 12 hours investigation. Traffic noise levels tend to be high during morning and afternoon peak hour and become lower during off-peak hour. The average traffic noise level measured by Sound Level Meter during the peak hour is 82.2 dBA.
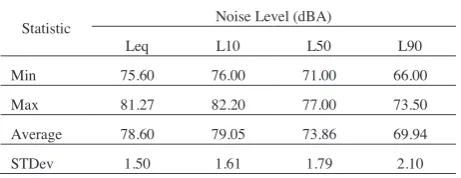
Based on the comparison of traffic noise level as shown in Table 1, it can be seen that the average LAeq value is
78.60 dBA while for L10, L50 and L90 are 79.05, 73.86 and 69.94 dBA, respectively. The difference of traffic noise
levels are: LAeq = LA10– 0.44, LAeq = LA50 + 4.74 and LAeq = LA90 + 8.66.
Table 1 Comparison of traffic noise level
Statistic Noise Level (dBA)
Leq L10 L50 L90
Min 75.60 76.00 71.00 66.00
Max 81.27 82.20 77.00 73.50
Average 78.60 79.05 73.86 69.94
472 Putu Alit Suthanaya / Procedia Engineering 125 ( 2015 ) 467 – 473
that, holding other factors constant, an increase of 100 motor cycle volume increases LA10 by about 0.4 dBA. However, heavy vehicle (X3) is not a significant predictor as the proportion of the heavy vehicles on the road is only 0.83%. The model explains about 57.1 percent in the variation of L10.
Table 4 shows the multiple regression model for L50. Controlling for the other factors, an increase of 100 motor cycle increases L50 by about 0.4 dBA. As traffic volume of motor cycle predominate traffic composition on the road, variable of X2 and X3 has a negative association. Variable X3 is not a significant predictor. The model explains about 77.9% of variation in L50 value.
Table 5 presents the multiple regression model for L90. Controlling for the other factors, an increase of 100 motor cycle increases L90 by about 0.6 dBA. As traffic volume of motor cycle predominate traffic composition on the road, variable of X2 and X3 has a negative association. The model explains about 70.3% of variation in L90 value.
Table 2. Traffic noise model (LAeq)
Model
Unstandardized Coefficients Standardized
Coefficients t Sig. Collinearity Statistics
B Std. Error Beta Tolerance VIF
(Constant) 76.019 1.181 64.393 .000
X1 .003 .001 .594 4.988 .000 .949 1.054
X2 -.007 .002 -.365 -3.037 .004 .932 1.073
X3 .054 .028 .225 1.911 .063 .971 1.030
R =0.638; R2=0.408; Adj. R2=0.367 F=10.92; Sig=0.000
Table 3. Traffic noise model (L10)
Model
Unstandardized Coefficients Standardized
Coefficients t Sig. Collinearity Statistics
B Std. Error Beta Tolerance VIF
(Constant) 78.049 .980 79.645 .000
X1 .004 .001 .681 6.719 .000 .949 1.054
X2 -.009 .002 -.483 -4.725 .000 .932 1.073
X3 -.009 .024 -.039 -.387 .700 .971 1.030
R =0.756; R2=0.571; Adj. R2=0.542 F=19.504; Sig=0.000
Table 4. Traffic noise model (L50)
Model
Unstandardized Coefficients Standardized
Coefficients t Sig. Collinearity Statistics
B Std. Error Beta Tolerance VIF
(Constant) 73.952 .769 96.209 .000
X1 .004 .000 .721 9.927 .000 .949 1.054
X2 -.014 .002 -.659 -8.985 .000 .932 1.073
X3 -.017 .018 -.067 -.928 .359 .971 1.030
Table 5. Traffic noise model (L90)
Model
Unstandardized Coefficients Standardized
Coefficients t Sig. Collinearity Statistics
B Std. Error Beta Tolerance VIF
The average error of the predicted value from the measured value for Leq is -2.33%. Average error for L10, L50 and L90 is +0.39%, -1.04% and +0.002%, respectively.
5.Conclusions
Road traffic noise is one of the main environmental problem that has been experienced by residents in many cities in the world including Denpasar City. Development of traffic noise models are needed in order to evaluate traffic noise level and to investigate the reduction measures. This study applied multiple regression method to develop traffic noise model for collector road in Denpasar City by considering three types of vehicles as independent variables (motor cycle, light vehicle and heavy vehicle). It was found that the traffic noise tend to increase by the increase of traffic volume. As the proportion of motor cycle dominates the road traffic (about 75%), motor cycle volume was found to be the most significant traffic noise predictor. Holding other factors constant, the increase of 100 motor cycle will increase traffic noise LAeq for about 0.3 dB. The increase in LA10, LA50 and LA90 are 0.4, 0.4 and 06, respectively. The average error of the predicted value from the measured value for Leq is -2.33%. Average error for L10, L50 and L90 is +0.39%, -1.04% and +0.002%, respectively. The model is limited to predict traffic noise level for collector road with the average speed between 23.08 km/h and 49.09 km/h.
References
[1] WHO, Guidelines for Community Noise, Edited by Birgitta Berglund, World Health Organization, Thomas Lindvall, and Dietrich Schwela, Geneva, April 1999. 39-54
[2] WHO, Prevention of Noise-Induced Hearing Loss, WHO-PDH Informal Consultation Report, 5, 7, 20, 1997
[3] F.J. Langdon, Noise nuisance caused by road traffic in residential areas: Part I and II, Journal of Sound and Vibration, 47 (2), (1976), 243– 282.
[4] T. Bodin, M. Albin, J. Ardö, E. Stroh, P. Östergren, J. Björk, Road traffic noise and hypertension: results from a cross-sectional public health survey in Southern Sweden, Environmental Health, 38 (8),(2009), 28-38.
[5] C. Guarnaccia, Advanced tools for traffic noise modelling and prediction, WSEAS Transaction on Systems, 12 (2), (2013), 121-130. [6] C.M. Steele, A critical review of some traffic noise prediction models, Applied acoustics, 62 (2001) 271-287.
[7] Denpasar City Bureau of Statistic, Denpasar city in figures, 2014.
[8] Department of Transport and the Welsh Office, Calculation of Road Traffic Noise.HMSO, London, 1988. [9] K. Yamamoto, Special issue on road traffic noise prediction methods, Acoustic Sci and Tech, 31 (1), 2010.
[10] FHWA, Office of Natural & Human Environment US Department of Transportation Federal Highway Administration, FHWA Traffic Noise Model (FHWA TNM), 2003.
[11] R.T. Sooriyaarachchi, D.U.J. Sonnadara, Development of a Road Traffic Noise Prediction Model, Proceedings of the Technical Sessions Institute of Physics – Sri Lanka, 22 (2006) 17-24
[12] R. Golmohammadi, M. Abbaspor, P. Nassiri, H. Mahjub, A compact model for predicting road traffic noise, Iran. J. Environ. Health. Sci. Eng., 6 (3), (2009), 181-186
[13] N. Ali, M. Hustim, A. Zubair, R. Zakaria, The road traffic noise reduction on the drainage pavement, Proceedings of the Eastern Asia Society
for Transportation Studies, 9, 2013
[14] J.B. Morton-Williams, B. Hedges, E. Fernando, Road traffic and the environment,Social and Community Planning Research, 1978. [15] P.G. Abbott, and P.M. Nelson, Converting the UK traffic noise index LA10,18h to EU noise indices for noise mapping, Project Report