Visualization of Vehicular Traffic in Augmented Reality for Improved
Planning and Analysis of Road Construction Projects
Amir H. Behzadan
City University of New York
Vineet R. Kamat
University of Michigan
Abstract: This paper describes research that investigated the application of 3D Augmented Reality (AR) for animating traffic simulation models in real time to support the planning and design of road construction projects. Traditional 3D visualization applications use Virtual Reality (VR) environments to visualize traffic simulations. The significant amount of time and human resources required to collect and incorporate statistical data about existing traffic volume and pattern can be a major drawback to the application of VR in studying the possible effect of traffic on planned construction. At the same time, the final visual output is often unconvincing as phenomenon such as unpredictable motion of pedestrians and incoming vehicles cannot be effectively represented in a VR animation. In this research, a new AR-based approach to create real time interactive traffic animations is introduced. This approach takes advantage of wireless communication techniques to facilitate continuous positional and orientation data transfer between moving vehicles and an AR animation.
1. Introduction: The transportation network is of critical importance for supporting the mobility and accessibility needs of the nation as well as ensuring its economic vitality. The importance of reliable and effective transportation systems as essential means to quick response in case of emergencies to ensure safe, continuous movement of people and goods as well as support response and recovery operations can not be overemphasized (Sisiopiku 2007). In order to maximize road network efficiency, improve traffic conditions for the traveling public, and overcome problems such as increasing levels of traffic volumes in both normal and emergency situations, transportation authorities continuously make changes to the existing traffic patterns of streets and roads by performing line closures, adding provision of bus lanes and High Occupancy Vehicle (HOV) lanes, lane reversals, and implementing several vehicle turn rules.
During a typical road construction project, intersection designs and traffic signalizations may be
temporarily or permanently changed by city planning officials in order to optimize the flow of traffic and minimize time lost in traffic discharge (Ceylan and Bell 2004). In complex and dense urban areas with relatively higher traffic flow, the negative effects from an inefficient traffic pattern design change are more pronounced which makes the optimization and design process even more critical and complicated (Mirchandani and Head 2001). The large scale impacts of such changes on traffic pattern, if not studied well beforehand, can add up to the existing problems and even make the situation worse.
Traditionally, traffic strategies have been evaluated using field studies after the proposed changes were implemented. The significant level of human resources committed to such experiments and the huge amount of time wasted as a direct result of spending hours in traffic congestions due to a change in traffic pattern directly translates into inevitable losses of lives, energy, and economic resources. As a result, simulation and 3D animation have been adopted to facilitate the process of transportation network design and analysis (Bayarri et al. 1996, Yang and Koutsopoulos 1996).
These technologies provide the capability of displaying the simulations in a 3D environment, allowing the designer to visualize the flow of traffic exactly as it would be at the real world. However, most of these applications rely on the computer generated animations and are mostly subjective to unexpected and/or unpredicted events that might happen during a real life driving experience. For example, in their application of performing driving simulation tests for driving with vision impairments and visual aids, Peli et al. (2005) used a driving simulator for evaluating the behavior of drivers in detection of and reaction to factors such as pedestrian presence, incoming traffic, and sharp curves. Their method uses the paradigm of Virtual Reality (VR) in which the user drives a vehicle simulator while virtual scenes are projected into the front view as well as rear and side mirrors.
NSF GRANT # 0448762
This system runs on the implicit assumption that the position of every object (e.g. pedestrians, other vehicles) inside the animation is completely under control and they are expected to act as they are designed to. While this approach is suitable for small scale and training applications, it does not effectively take into account the fact that in a real traffic pattern, a driver’s reaction is a function of several factors most of them are not included in VR visualization applications mainly to simplify the processes of data collection, CAD modeling and animation rendering. Some of these factors are including but not limited to varying road and pavement quality, weather condition, lighting condition, and motion unpredictability of vehicles and pedestrians.
A real life driving experience takes place in a dynamic environment where people and traffic are constantly moving. Such an environment does not always provide drivers with ideal and controlled conditions which are main assumptions for many VR-based visualization tools.
2. Augmented Reality Animation of Simulated Traffic: Integrating real world data into the animated scenes of a road network has a great potential in creating more realistic representations of the simulated driving environment and at the same time, reduces the time and effort otherwise required to collect local traffic statistical data. In other words, real world entities (e.g. cars, pedestrians) that are existing in a typical traffic pattern can be shown in the background of an AR animation while the traffic simulation is superimposed on the foreground. Having done so, potential effects of a new traffic pattern (which has been simulated and animated in the computer) can be studied in more details and with higher degrees of reliability.
The result of such animations is an Augmented Reality (AR) world consisting of real (existing) objects and virtual (simulation) objects displayed in a single scene. Adopting AR-based visualization methods to model and animate driving scenarios is a promising approach to address the problems identified in Section 1. Since contents of the real world are constantly sensed in an interactive augmented environment, any changes occurring to real objects (e.g. incoming vehicles, moving pedestrians, road quality and weather condition) can be potentially included and accounted for in an AR animation.
Several advanced information and communication technologies such as Global Positioning System (GPS), Geographical Information System (GIS), and Driver Information System (DIS) can be used in an AR animation system in order to provide real time information to the system and potentially reduce delay, increase safety and comfort while driving, and make better use of the available
road capacity. Such technologies can operate best if provided with an accurate and updated underlying database containing crucial data about road network plan, current traffic congestion scheme, traffic signal timings, and roads under construction. Concurrent use of simulation and AR visualization tools can be of great help to generate and validate such databases.
Figure 1 is a conceptual illustration of an AR-based traffic animation. In this Figure, a virtual car is superimposed on top of a live view of a real intersection. If designed properly, the AR animation will be capable of suspending the motion of the virtual car at the stop sign until the real car (on the left) crosses the intersection and the road is clear. It is worth mentioning that if this scene was to animate in VR, data about every single real object (e.g. size, speed, position, color, texture) had to be collected beforehand which certainly would require a noticeable amount of time and effort.
Figure 1: Sample traffic scene animated in AR
The application of AR, however, introduces a number of unique challenges. For example, certain methods have to be developed in order to track the position and moving direction of objects (e.g. vehicles, pedestrians) in real time. This helps in detecting and possibly avoiding interference or collision between virtual (simulation) and real (existing) objects since the position and orientation of virtual contents in the AR animation is already known to the application from the simulation results.
better means to study the behavior of the driver. If a real car is driven by the user, the virtual contents of the augmented scene can be displayed to the driver through a wearable Head Mounted Display (HMD), or a laptop computer secured on top of the dashboard. In both cases, the driving experience is improved by introducing features from both virtual and real worlds into a totally interactive augmented scene.
Different sets of graphical information from different viewpoints can be displayed to a city planner observing and analyzing a traffic pattern in a local control office using an AR-based traffic animation system. As shown in Figure 2, an example of such information could be real time scenes of the surrounding environment of a future road maintenance work shown on an AR projection screen in which graphical CAD objects representing traffic cones are superimposed over aerial views of a street.
Figure 2: Aerial view of a road maintenance project in Augmented Reality
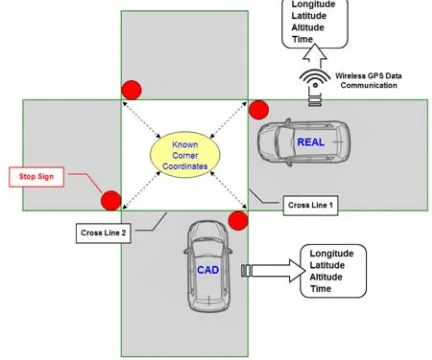
3. Data Communication in Real Time: Real time data communication is one of the most important aspects of an AR-based traffic animation system. The required information about the position and moving direction of all real and virtual objects has to be communicated bi-directionally between drivers who drive the real cars and those who drive the virtual vehicles. At the same time, all such information packets have to be continuously sent to the traffic control office. In addition to position and orientation data about virtual and real objects, two other important sets of information have to be also obtained and retrieved during the course of the animation. These information include the scene global coordinate data and driving rules. Figure 3 shows different datasets that have to be acquired and maintained by the AR animation. As shown in this Figure, global position of real cars can be obtained using wireless GPS communications while the same set of information for virtual vehicles can be obtained from the traffic simulation model. For the intersection shown in Figure 3, there are four major
points the coordinates of which have to be obtained. These points are the corner points of the intersection which define a rectangle inside which only one car (either real or virtual) can be present at any given instant of time. Also, the driving rules for the intersection shown in this Figure are determined by the four stop signs.
Figure 3: Important pieces of information in an AR intersection animation
As shown in Figure 3, the position and moving direction for both real and virtual vehicles have to be known to the AR application. This requires each real vehicle (such as that shown in this Figure) to be equipped with a remote wireless positioning device (e.g. wireless GPS). The setup does not allow for wired data transfer as the objects in the scene are in constant motion. In order to achieve this objective, a GPS unit and an orientation tracker can be installed and secured on top of each real vehicle. Positional and orientation data for the CAD objects (i.e. virtual cars) can be internally computed inside the AR application using their motion data extracted from the simulation model.
time tag will be deleted from the array and the entire process starts over.
4.Development of the Required Augmented Reality System: The authors have successfully designed and implemented the required hardware and software components of a similar AR-based visualization application. The developed AR system takes advantage of GPS and orientation tracking devices in order to obtain real time global position and head orientation of a mobile user (identical to a car driver) (Kamat and Behzadan 2006). An AR animation authoring language called ARVISCOPE has been also designed by the authors which enables automated generation of the graphical contents of an AR animation from the results of its underlying Discrete Event Simulation (DES) model (Behzadan and Kamat 2008). ARVISCOPE runs on a mobile platform called UM-AR-GPS-ROVER (Behzadan et al. 2008) and is capable of generating AR animations of simulated processes with arbitrary length and complexity while it gives full maneuvering control to the user who is observing the scene in real time.
The user can walk inside the animation and look at it from different points of view. As soon as a new set of positional and head orientation data is received, the contents of the AR viewing frustum is automatically updated. Several proof-of-concept experiments were conducted to verify the functionality of this design and its capability to create real time augmented animations of simulation models (Behzadan 2008). Figure 4 shows the profile of a user wearing the UM-AR-GPS-ROVER mobile apparatus and observing an AR animation through the provided HMD.
Figure 4: Profile of a user equipped with UM-AR-GPS-ROVER mobile AR apparatus
5. Implementation and Results: In order to analyze the degree to which reliable results can be achieved from an AR animation of a traffic simulation, a typical intersection was modeled and the corresponding AR animation was created. The intersection this study was conducted at was located on the University of Michigan (Ann Arbor, MI) north campus. In this experiment, a real car and a virtual car were used and two arrival scenarios at a stop sign were considered. The motions of the virtual car were controlled by an animation trace file created automatically by ARVISCOPE from the results of a DES simulation model of an intersection while the motions of the real car were manually controlled by the driver based on the position and moving direction of the virtual car to avoid any hypothetical collision between the two vehicles.
Two possible scenarios were taken into account in this experiment:
• Scenario 1: The virtual car yields to the real car. As a result, the real car has the right of way and can cross the intersection while the virtual car is waiting at the stop sign.
• Scenario 2: The real car yields to the virtual car. As a result, the virtual car has the right of way and can cross the intersection while the real car is waiting at the stop sign.
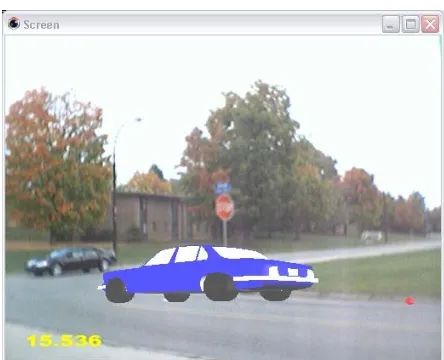
Figures 5 through 7 show snapshots from the animation results for scenario 1 in which the virtual car yields to the real car and waits until the intersection is clear. In Figure 5, the virtual car arrives at the intersection and waits while the real car is approaching the intersection.
Figure 5: Virtual car is waiting at while the real car is approaching the intersection
Figure 6: Virtual car is waiting at while the real car is crossing the intersection
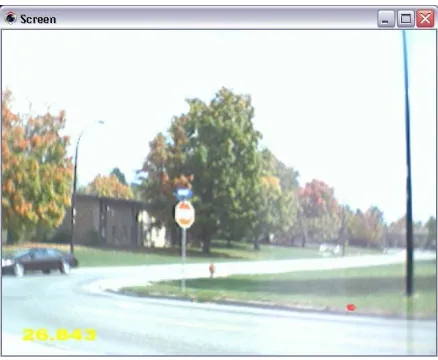
In Figure 7, the road has become clear and the virtual car starts to cross the intersection.
Figure 7: Virtual car is crossing the intersection
Figures 8 through 11 show snapshots from the animation results for scenario 2 in which the real car yields to the virtual car and waits until the intersection is clear. In Figure 8, both cars are approaching the intersection. Figure 9 shows the instant at which both cars are at the intersection. In Figure 10, the virtual car gets the right of way and starts crossing the intersection. Figure 11 shows the real car crossing the intersection as soon as the road is clear.
Although these experiments were conducted under a simple driving scenario (i.e. single stop sign), the described methodology can be generalized to an infinite number of virtual and real vehicles as long as their positional and orientation data is continuously communicated to the AR application in real time and
the intersection geometry in terms of the coordinates of the corner points are known. Also, the snapshots shown in Figures 5 through 11 were taken from a fixed viewpoint to facilitate the comparison between the two scenarios. In practice, the observer of the AR animation (e.g. traffic controller, driver, pedestrian) can maneuver freely inside the animation and watch the ongoing traffic simulation from different perspectives providing that the observer’s positional and head orientation data is constantly obtained and transferred to the AR application (Behzadan 2008).
Figure 8: Real and virtual cars are approaching the intersection
Figure 9: Real and virtual cars arrive at the intersection
in which the drivers’ behavior and the interaction between vehicles as well as pedestrians are modeled and animated under controlled laboratory conditions.
Figure 10: Virtual car is crossing the intersection while the real car is waiting
Figure 11: Real car is crossing the intersection
However, there are several factors that can be overlooked in a VR animation of a traffic simulation. Such factors include but are not limited to varying road and pavement quality, weather conditions, lighting conditions, and arbitrary motion of vehicles and pedestrians. A real life driving experience takes place in a dynamic environment where people and traffic are constantly moving. Such an environment does not always provide drivers with ideal and controlled conditions, which are the main assumptions in many VR visualization tools.
Integrating real world data into the animated scene of a road network has great potential in creating more realistic representations of the simulated driving
environment and at the same time, can reduce the time and effort otherwise required to collect local traffic statistical data. In AR, real world entities (e.g. cars, pedestrians) existing at a particular location can be displayed in the background of the AR animation, while the traffic simulation is superimposed on the foreground. The result of such animations is an augmented world consisting of real (existing) objects and virtual (simulation) objects displayed in a single scene. The application of AR, however, introduces a number of unique challenges.
For example, methods have to be developed to track the position and moving direction of objects (e.g. vehicles, pedestrians) in real time. This helps detect and possibly avoid interference or collision between virtual (simulation) and real objects since the position and orientation of virtual contents in the AR animation is already known to the application from the simulation results.
In this paper, an AR-based visualization application called ARVISCOPE developed by the authors was introduced. ARVISCOPE, when integrated with a mobile AR apparatus such as UM-AR-GPS-ROVER (also developed by the authors) enables the creation of smooth animations of DES models. The implemented mobile AR platform can be used to create real time AR animations of simulated traffic models by installing the provided positioning and orientation tracking devices in real vehicles and establishing bi-directional data communication between them and the AR application. At the same time, the virtual graphical contents of the animation can be produced and displayed on the foreground to create a single mixed view of real and virtual traffic entities (e.g. cars, people, signals). A number of outdoor tests proved the applicability of the designed AR platform.
7. Acknowledgements: The presented work has been supported by the National Science Foundation (NSF) through grant CMS-0448762. The authors gratefully acknowledge NSF’s support. The authors would also like to thank Ph.D. student Ms. Sara Jabbarizadeh for her invaluable help in conducting the experiments presented in this paper. Any opinions, findings, conclusions, and recommendations expressed by the authors in this paper do not necessarily reflect the views of the NSF, or the individual named above.
8. References:
[1] Bayarri, S., Fernandez, M., and M. Perez. 1996. Virtual Reality for Driving Simulation,
Communications of the ACM 39(5): 72-76, ACM, New
York, NY.
Reality. Ph.D. dissertation, Department of Civil and Environmental Engineering, University of Michigan, Ann Arbor, MI.
[3] Behzadan, A. H., and V. R. Kamat. 2008. Automated Generation of Operations Level Construction Animations in Outdoor Augmented Reality, ASCE Journal of Computing in Civil
Engineering, Special Issue on Graphical 3D
Visualization In Architecture, Engineering, and Construction, Reston, VA. (In Press)
[4] Behzadan, A. H., Timm, B. W., and V. R. Kamat. 2008. General Purpose Modular Hardware and Software Framework for Mobile Outdoor Augmented Reality Applications in Engineering, Advanced
Engineering Informatics 17(6):737-748, Elsevier
Science, New York, NY.
[5] Ceylan, H., and M. G. H. Bell. 2004. Traffic Signal Timing Optimization Based on Genetic Algorithm Approach, Including Driver’s Routing, Transportation
Research Part B: Methodological 38(4): 329-342,
Elsevier Science, New York, NY.
[6] Kamat, V. R., and A. H. Behzadan. 2006. GPS and 3DOF Tracking for Georeferenced Registration of Construction Graphics in Outdoor Augmented Reality,
In Proceedings of the 13th EG-ICE Workshop of
Intelligent Computing in Engineering and Architecture, Ascona, Switzerland.
[7] Mirchandani, P., and L. Head. 2001. A Real Time Traffic Signal control System: Architecture, Algorithms, and Analysis, Transportation Research
Part C: Emerging Technologies 9(6): 415-432, Elsevier
Science, New York, NY.
[8] Peli, E., Bowers, A. R., Mandel, A. J., Higgins, K., Goldstein, R. B., and L. Bobrow. 2005. Design for Simulator Performance Evaluations of Driving with Vision Impairments and Visual Aids, Transportation
Research Record 1937: 128-135, Transportation
Research Board of the National Academics, Washington, DC.
[9] Sisiopiku, V. P. 2007. Application of Traffic Simulation Modeling for Improved Emergency Preparedness Planning, Journal of Urban Planning and
Development 133(1): 51-60, ASCE, Reston, VA.
[10] Yang, Q., and H. Koutsopoulos. 1996. A Microsoft Traffic Simulator for Evaluation of Dynamic Traffic Management Systems, Transportation Research Part
C: Emerging Technologies 4(3): 113-129, Elsevier