Relationship between Rice Spectral and Rice Yield Using Modis Data
I Wayan Nuarsa (Corresponding author)
Faculty of Agriculture, Udayana University
Kampus Bukit Jimbaran 80361, Bali-Indonesia
Tel: 62-361-703-602 E-mail: [email protected]
Fumihiko Nishio
Center for Environmental Remote Sensing, Chiba University
1-33 Yayoi-cho, Inage-ku, Chiba-shi 263-8522, Japan
Tel: 81-043-290-3836 E-mail: [email protected]
Chiharu Hongo
Center for Environmental Remote Sensing, Chiba University
1-33 Yayoi-cho, Inage-ku, Chiba-shi 263-8522, Japan
Tel: 81-043-290-3859 E-mail: [email protected]
Received: September 30, 2010 Accepted: October 15, 2010 doi:10.5539/jas.v3n2p80
The research is financed by Japan Society for the Promotion of Science (JSPS) Ronpaku, Japan
Abstract
Information on the distribution of paddy rice fields is essential for food security and water resource management. Remote sensing is a technique that can be used to obtain rice production information from space. In the present study, Moderate Resolution Imaging Spectroradiometer (MODIS) images were used to evaluate the relationship between the rice spectral (normalized difference vegetation index (NDVI)) of Landsat images and rice yield. The results indicated that the relationship between the NDVI and rice age was best described by a quadratic equation, and R2 values ranging from 0.916 to 0.973 were obtained. Three growth variables were evaluated in the present study, and the total NDVI (∑NDVI) showed the strongest exponential relationship to rice yield (R2 = 0.9203) and the lowest standard error of estimation (SE = 0.076). Alternatively, NDVImax and AgeNDVImax presented lower R2 values (0.8919 and 0.5776, respectively) and higher SEs of estimation (0.089 and 0.175, respectively). Thus, the results indicate that rice yield can be estimated from the following equation: y = 0.4745e0.0504x, where y is the rice yield and x is the ∑NDVI.
Keyword: Rice spectral, Rice yield, NDVI, Modis, Remote sensing
1. Introduction
Rice is one of the important agricultural crops in Indonesia and Asia. Rice is the primary food source for more than three billion people and is one of the world’s most important primary staple foods. Paddy rice fields account for approximately 15% of the world’s arable land (IRRI 1993, Khush 2005). Information on the area and distribution of paddy rice fields is essential for food security management and water resource management (Xiao
et al. 2005).
by the availability of data for temporal analysis because the temporal resolution of Landsat is equal to 16 days (Quarmby et al. 1993). Alternatively, the utilisation of NOAA images is limited by the spatial resolution. In NOAA images, one pixel may correspond to 1000 m; thus, the probability is high that several types of land cover will be observed in one pixel, especially in small study areas. Moreover, the presence of multiple land uses in one pixel decreases the accuracy of the assessment (Strahler et al. 2006).
In the present study, MODIS images at a spatial resolution of 250 m were used to estimate the yield of rice. The MODIS images provide better temporal resolution than Landsat imagery and offer better spatial resolution than NOAA images. Thus, the objective of the present study was to assess the potential of MODIS images for the estimation of rice yield and to evaluate the relationship between MODIS rice spectral data and rice yield. The MODIS spectral data evaluated in this study were NDVI.
2. Study Area, Data and Method
2.1 Background and Study Area
The study area was located in Tabanan Regency, Bali Province, Indonesia, at 8°31’50” S latitude and 115°02’30” E longitude (Figure 1). The Tabanan Regency was selected as the study area because Tabanan is the central area for rice production in Bali. In the study area, rice plantings are organised by a subak, which is a social organisation centred around farming. The subak manages the irrigation water for approximately 150 – 300 ha of rice fields (Food Crops Agriculture Department 2006). Moreover, rice fields managed by the subak are often planted at the same time. Due to the wide rice area, this type of farming system can be easily monitored by remote sensing.
2.2 Rice grain sample collection
The following considerations were used to select rice grain sampling sites: (1) the planted area should be wide and easily identifiable in MODIS images; and (2) the planted area should have the same rice variety. Therefore, based on the aforementioned considerations, a total of 12 samples were collected in the present study (Table 1). At each sampling site, rice grain was collected from a 2.5 m x 25 m area. The weight of the rice grain was measured in units of kg, and the yield was obtained in ton/ha.
2.3 MODIS Images
Among a suite of standard MODIS products available to users, we used the 8-day composite MODIS Surface Reflectance Band 1-2 Product (MYD09Q1). The spatial resolution of this MODIS product is 250 m, and two bands are provided, including the red band (620–670 nm) and the infrared band (841–876 nm). In the production of MOD09A1, atmospheric corrections for gases, thin cirrus clouds and aerosols are implemented (Vermote & Vermeulen, 1999). For each sample point, we collected 12 images from different MODIS composite dates. In total, 23 scene images were used in the present study. The MODIS images were obtained from the MODIS website (http://mrtweb.cr.usgs.gov/) as a free download using USGS MODIS Reprojection Tool Web Interface (MRTWeb).
2.4 Data Analysis
During the data analysis, the images were pre-processed, rice spectral information was collected from the MODIS images, and statistical analyses were conducted. To pre-process the data, MODIS images were obtained from the website, cloud-free images were selected and cropped, and the geographic coordinates were transformed. Last, the rice spectral information obtained from the MODIS images was transformed into the NDVI, according to the following expression:
(1)
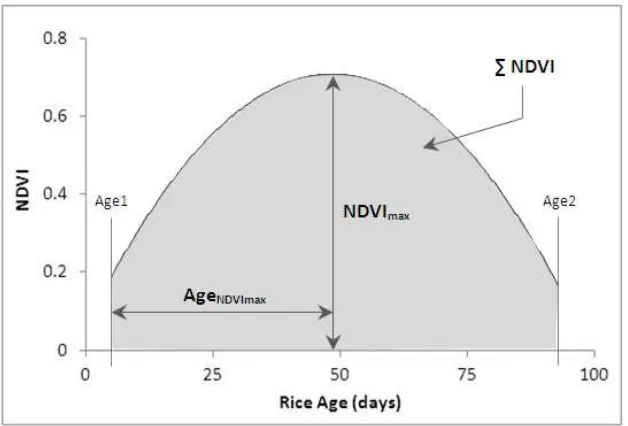
The red and infrared band of the NDVI equation were obtained from the MODIS images, which were collected from 12 different locations, and the relationship between rice age and the NDVI was determined. According to the results of our previous research (Nuarsa and Nishio, 2007), the quadratic equation best describes the relationship between rice age and the NDVI. From the quadratic equation, the maximum NDVI (NDVImax), the age of the rice plant at the NDVImax (AgeNDVImax), and the total NDVI (∑ NDVI) was calculated, as shown in Figure 2.
; (2) value of y at the NDVImax can be obtained. Alternatively, ∑NDVI can be computed from the following equation:
(3)
where Age1 and Age 2 are the beginning and end of rice plant observation, respectively. The next step of the data analysis process was to determine the relationship between AgeNDVImax, NDVImax, ∑NDVI and the yield of rice. In addition, the equation that provided the best fit to the experimental data was used to estimate the rice yield. To this end, the determination coefficient (R2) and the standard error of the estimation (SE) were calculated to determine the optimal equation (Lane et al. 2008). High values of R2 and low values of SE indicate that the equation provides a superior fit to the experimental data.
(4)
(5)
where R2, SE, y, y’, ’, and n are determination coefficient, standard error of estimation, actual value, predicted, value, average predicted value, and number of samples respectively.
3. Result and Discussion
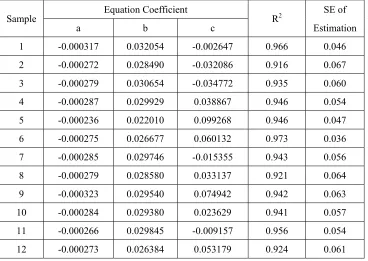
For all 12 samples in the study area, the quadratic relationship between rice age and the NDVI is shown in Table 2. The R2 values of the equations were high and varied from 0.916 to 0.973. The highest R2 and the lowest standard error (SE) of estimation were observed in sample 6, which was obtained from Riang Gede Village (Figure 3). Alternatively, the lowest R2 and highest SE were observed in sample 2, which was obtained from Pupuan Sawah village. The R2 and SE of sample 2 were 0.916 and 0.067, respectively.
The value of R2 was high, indicating that the relationship between rice age and the NDVI was consistent. Moreover, the value of SE was low, which suggests that the difference between the estimated result and the actual value was small. An important factor that affects the R2 and the SE of the NDVI is the appearance of clouds in the MODIS images. Thin cloud coverage can lead to inconsistencies in the reflectance values, which will affect the NDVI of the rice field. Therefore, the selection of cloud-free images is one of the most important steps in the data analysis. Moreover, the presence of mixed pixels reduces the rice spectral information and can affect the R2 and the SE of the NDVI. In a mixed pixel, the rice plant and another object are present in the same pixel and can reduce the accuracy of the analysis (Strahler et al. 2006).
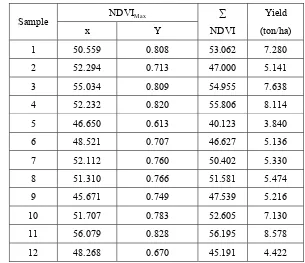
By applying Equation 2 and Equation 3, the AgeNDVImax, NDVImax, and ∑NDVI can be calculated. The AgeNDVImax values varied from 45.671 to 56.079; thus, from the beginning of the transplanting period, the NDVI of rice increased until the plant reached 1.5 months to 2 months of age, and then decreased until the end of the plant’s life. The NDVImax values ranged from 0.631 to 0.828, and the value of the ∑NDVI fluctuated between 40.123 and 56.195 (Table 3).
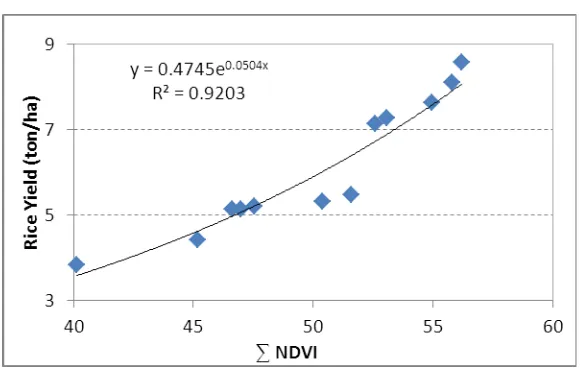
5, and Ta 6). The strongest relationship was observed between the ∑NDVI and the rice yield. The highest value of R2 (0.9230) and the lowest value of the SE (0.076) was obtained from the ∑NDVI and the rice yield (Table 4). Alternatively, AgeNDVImax and NDVImax presented an R2 and SE of 0.5776 and 0.175 and 0.8919 and 0.089, respectively. Similarly, a positive correlation between leaf area index (LAI), ∫NDVI and the rice yield was observed by Harrison et al. (1984), who used Landsat MSS data, and Rasmussen (1992), who utilised NOAA AVHRR data.
A strong positive correlation between the ∑NDVI and the yield of rice indicates that an increase in the total NDVI during the lifetime of the plant will improve the rice yield. Furthermore, high NDVI values indicated that the infrared (NIR) band of the rice plant was high (Equation 1). NIR reflectance of rice is directly related to green biomass (Niel and McVicar 2001), and NIR light is highly scattered by water in spongy mesophyll cells (Harrison and Jupp 1989). Thus, high NDVI values are indicative of high chlorophyll content. Chlorophyll is the most important part of the rice plant for photosynthetic activity, which produces carbohydrates to form rice plant tissue and rice grain, and has a significant effect on the yield at harvest.
4. Conclusions
A quadratic equation best described the relationship between the NDVI and rice age, and R2 values ranging from 0.916 to 0.973 were observed. Among the three growth variables evaluated in this study, the total NDVI during the lifetime of the rice plant (∑NDVI) displayed the strongest exponential relationship to the rice yield (R2 = 0.9203) and the lowest standard error of estimation (SE = 0.076). Compared to the ∑NDVI, the NDVImax and AgeNDVImax presented lower R2 (0.8919 and 0.5776, respectively) and higher SE values (0.089 and 0.175, respectively). Moreover, the results indicated that rice yield can be estimated from the following equation: y = 0.4745e0.0504x, where y is the rice yield and x is the ∑NDVI. Based on the results of the present research, MODIS images can be used to estimate the yield of rice.
Abbreviations
AVHRR = Advanced Very High Resolution Radiometer.
IRRI = International Rice Research Institute.
LAI = Leaf Area Index
Landsat = Land Satellite.
MODIS = Moderate Resolution Imaging Spectroradiometer.
MRTWeb = MODIS Reprojection Tool Web Interface.
NDVI = Normalized Difference Vegetation Index.
NOAA = National Oceanic and Atmospheric Administration.
SE = Standard Error of Estimation.
Acknowledgments
I would like to express my profound gratitude to my advisor for his invaluable support, encouragement, supervision, and useful suggestions throughout this research. I am also thankful to JSPS Ronpaku for supporting this PhD work.
References
David, D., Frolking, S., Li, C. (2003). Trends in Rice-Wheat Area in China. Field Crops Research, 87, 89-95.
Food Crops Agriculture Department. (2006). Annual report of food crops, Department Agriculture of Local Government, Bali Province Indonesia, 3, 125-130.
Harris, P. M. and Ventura, S. J. (1995). The integration of geographic data with remotely sensed imagery to improve classification in an urban area. Photogrammetric Engineering and Remote Sensing, 61, 993–998.
Harrison, B. A. and Jupp, D. L. B. (1989). Introduction to remotely sensed data, CSIRO Publications, 141.
Harrison, B. A., Jupp, D. L. B., Ibrahim, A. A. and Angus, J. F. (1984). The use of Landsat data for monitoring growth of irrigated crops. Third Australasian Remote Sensing Conference, Queensland, 36-43.
Honghui, L., Xiaohuan, Y. and Naibin, W. (1999). Remote sensing based estimation system for winter wheat yield in North China Plain. Chinese Geographical Journal, 9, 40-48.
Khush, G.S. (2005). What it will take to feed 5 billion rice consumers in 2030. Plant Molecular Biology, 59, 1-6.
Lane, D., Lu J., Peres C., and Zitek E. (2008). Online Statistics: An Interactive Multimedia Course of Study. [Online] Available: http://onlinestatbook.com/index.html (June 23, 2010).
Niel, T.G.V. and McVicar, T.R. (2001). Remote Sensing of Rice-Based Irrigated Agriculture: A Review; [Online] Available: http://www.clw.csiro.au/publications/consultancy/2001/CRC-Rice-TRP11050101.pdf, 18-19 (December 15, 2009).
Nuarsa, I.W. and Nishio, F. (2007). Relationships between rice growth parameters and remote sensing data.
Journal of Remote Sensing and Earth Sciences, 4, 102-112.
Oette, D. R., Warren B. C., Mercedes B., Maiersperger, T.K., and Kennedy, R.E. (2000). Land Cover Mapping in Agricultural Setting Using Multiseasonal Thematic Mapper Data. Remote Sensing of Environment, 76, 139-155.
Panigrahy, S. and Sharma., S.A. (1997). Mapping of Crop Rotation Using Multidate Indian Remote Sensing Satellite Digital Data. ISPRS Journal of Photogrammetry & Remote Sensing, 52, 85-91.
Quarmby, N. A., Milnes, M., Hindle, T. L. and Silleos, N. (1993). The use of multi-temporal NDVI measurements from AVHRR data for crop yield estimation and prediction. International Journal of Remote Sensing, 14, 199-210.
Rasmussen, M. S. (1992). Assessment of millet yields and production in northern Burkina Faso using integrated NDVI from AVHRR. International Journal of Remote Sensing, 13, 3431-3442.
Rasmussen, M. S. (1997). Operational yield forecast using AVHRR NDVI data: reduction of environmental and inter-annual variability. International Journal of Remote Sensing, 18, 1059-1077.
Shao, Y., Fan, X., Liu, H., Xiao, J., Ross, S., Brisco, B., Brown, R. and Staples, G. (2001). Rice monitoring and production estimation using multitemporal RADARSAT. Remote Sensing of Environment, 76, 310–325.
Shao, Y., Wang, C., Fan, X., and Liu, H. (1997). Evaluation of SAR image for Rice Monitoring and Land Cover Mapping. In Presented at Geomatics in Era of RADARSAT, Ottawa, Canada.
Strahler, A. H., Boschetti, L., Foody, G.M., Friedl, M.A., Hansen, M.C., Herold, M., Mayaux, P., Morisette, J.T., Stehman, S.V. and Woodcock, C.E. (2006). Global Land Cover Validation: Recommendations for Evaluation and Accuracy Assessment of Global Land Cover Maps. Office for Official Publications of the European Communities. [Online] Available: http://wgcv.ceos.org/docs/plenary/wgcv26/ GlobalLandCover Validation_JeffMorisette.pdf (July 25, 2009).
Treitz, P. M., Howard, P. J. and Gong, P. (1992). Application of satellite and GIS technologies for land-cover and land-use mapping at the rural-urban fringe: a case study. Photogrammetric Engineering and Remote Sensing, 58, 439–448.
Vermote, E. F., Vermeulen, A. (1999). Atmospheric correction algorithm: Spectral reflectance (MOD09), MODIS algorithm technical background document, version 4.0. University of Maryland, Department of Geography.
Westmoreland, S. and Stow, D. A. (1992). Category identification of changed land-use polygons in an integrated image processing/geographic information system. Photogrammetric Engineering and Remote Sensing, 58, 1593–1599.
Table 1. Sample location of harvested rice grain
Sample Village Name Geographic Coordinate Rice age observation (day)
X Y Start Finish
1 Beraban 290750.33 9048134.60 6 94
2 Pupuansawah 284957.98 9064585.63 5 93
3 Kukuh 289591.81 9055780.85 7 95
4 Gubug 290750.33 9053695.51 6 94
5 Kuwum 297701.47 9061805.17 7 95
6 RiangGede 292835.67 9060414.95 5 93
7 Abian Tuwung 296311.24 9053927.22 5 93
8 Tua 300018.52 9070841.65 6 94
9 Belimbing 284030.90 9072000.18 3 91
10 Sudimara 289591.81 9052073.85 5 93
11 Pangkungkarung 290055.22 9054390.63 4 92
12 Sembunggede 290055.22 9059488.13 4 92
Rice age is the age of the rice plant at the time the spectral data were obtained from the MODIS images.
Table 2. Quadratic equation coefficients, correlation coefficient (R2) and standard error of estimation (SE) of the relationship between rice age and the NDVI
Sample Equation Coefficient R2 SE of
a b c Estimation
1 -0.000317 0.032054 -0.002647 0.966 0.046
2 -0.000272 0.028490 -0.032086 0.916 0.067
3 -0.000279 0.030654 -0.034772 0.935 0.060
4 -0.000287 0.029929 0.038867 0.946 0.054
5 -0.000236 0.022010 0.099268 0.946 0.047
6 -0.000275 0.026677 0.060132 0.973 0.036
7 -0.000285 0.029746 -0.015355 0.943 0.056
8 -0.000279 0.028580 0.033137 0.921 0.064
9 -0.000323 0.029540 0.074942 0.942 0.063
10 -0.000284 0.029380 0.023629 0.941 0.057
11 -0.000266 0.029845 -0.009157 0.956 0.054
Table 3. AgeNDVImax, NDVImax, ∑NDVI, and the rice yield in all 12 sampling points
Sample NDVIMax ∑ Yield
x Y NDVI (ton/ha)
1 50.559 0.808 53.062 7.280
2 52.294 0.713 47.000 5.141
3 55.034 0.809 54.955 7.638
4 52.232 0.820 55.806 8.114
5 46.650 0.613 40.123 3.840
6 48.521 0.707 46.627 5.136
7 52.112 0.760 50.402 5.330
8 51.310 0.766 51.581 5.474
9 45.671 0.749 47.539 5.216
10 51.707 0.783 52.605 7.130
11 56.079 0.828 56.195 8.578
12 48.268 0.670 45.191 4.422
Table 4. The R2 and SE of AgeNDVImax, NDVImax, and ∑NDVI
Variable R2 SE
AgeNDVImax 0.5776 0.175
NDVImax 0.8919 0.089
∑NDVI 0.9203 0.076
Figure 2. An illustration of the method used to calculate AgeNDVImax, NDVImax, and ∑NDVI
Figure 3. Relationship between rice age and the NDVI. Compared to other samples in the study area, this sample
(sample 6) presented a quadratic equation with the highest R2
Figure 5. Relationship between the NDVImax and rice yield