Proceedings of
International Conference on
Rural Information and Communication Technology 2009
ISBN : 978-979-15509-4-9
Additional copies of this publication are available from: ITB Research Center on ICT (PPTIK ITB)
4th floor, Inter University Center (PAU Building), Institut Teknologi Bandung
Jl. Ganesha no. 10, Bandung, Indonesia Phone : +62 - 22 - 425 4034
Proceedings of
International Conference on
Rural Information and Communication
Technology 2009
General Chair's Message
T
his conference addresses rural information and communication technology (R-ICT) issues with digital culture objectives. We believe that everybody must have a chance to benefit from digital technology. The gap between the haves and the have nots to benefit from digital technology has been known as digital divide. There are approximately 3.6 billion people without benefits from ICT. We need to find solutions to allow digital inclusions for everybody.
On key issue is broadband infrastructure for rural areas. This requires innovations at many levels, from technology, products, applications, operations, and investments. In particular, we are looking at rural next generation network (R-NGN), next generation computing (NCG), next generation application platforms, as well as cultural contents. This conference gathers researchers to report their results pertaining those issues. But more importantly, this conference should consolidate research community to actively dedicate research efforts toward solving digital divide issues.
This conference is inspired by the idea that ICT empowers its users to be productive in creating values despite of their shortcomings. Without clear concept of how the users benefit from ICT, rural ICT will not be sustainable. We strongly believe, in additions to the usual education, health, trade, farming, and information applications, it is the cultural potentials that will eventually make rural ICT sustainable. It is the unleashing of the creative excitement embedded in each culture that will drive the value creation by rural communities. That is the creative entrepreneurial knowledge society that we are visioning.
This year's conference in particular is held within The Golden Anniversary of the Institute Technology Bandung. In conjunction to this conference, ITB holds 4 more international conferences with a common theme “Energy and The Environment: Reinvention for Developing Countries”. All these conferences focuses on the issues related to the developing countries. In addition to the technical sessions within these conferences we also hold Millennium Research Agenda (MRA) meeting.
We hope that through these conferences and MRA meeting, we could be able to join our focus in issues of helping the bottom pyramid of the society.
Bandung, 15 June 2009
r-ICT 2009 Committee
General Chair
Armein Z.R. Langi
Conference Chair Mervin T. Hutabarat
Scientific Committee
Leo P. Ligthart (TU Delft) Adang S. Ahmad (ITB) Andriyan B. Suksmono (ITB)
Witold Kinsner (Univ. Manitoba, Canada) Chun Tung Chou (UNSW, Australia) Yo-Sung Ho (KIST, Korea)
Dharmendra Sharma (Canberra Univ., Australia) Isao Nakajima (Tokai University/ITU)
Dwi H. Widyantoro (ITB) Adi Indrayanto (ITB) Soegijardjo Soegijoko (ITB) Tati L. R. Mengko (ITB) Ary Setijadi P., (ITB)
Bobby Nazif (Univ. Indonesia) Suhono H. Supangkat (ITB)
Dadang Gunawan (Univ. Indonesia) Budi Rahardjo (ITB)
Hendrawan (ITB) Onno W. Purbo Bambang Riyanto (ITB) Joko Siswanto (ITB) Suhardi (ITB)
Ken Ferens (Univ. Manitoba, Canada) Santika Wachyudin P. (ITB)
Sarwono Sutikno (ITB) Hira Laksmiwati Zoro (ITB) Iyas Munawar (ITB) Kuspriyano (ITB)
Table of Contents
INVITED TALKS
Intelligent Computation in Multi-Robotic Systems 1
Andrzej Maslowski
INFRASTRUCTURE FOR RURAL-NGN
Random Search Codes and Implementation Model for Optical-CDMA-Based Local Area Networks
9 Nasaruddin, Tetsuo Tsujioka
Propagation Model Verification using Elementary Environment Specific Method for Analyzing 802.16e System Coverage in Bandung City
15 Andito Dwi Pratomo, Legijono, Denny Sukarman, Hadi Hariyanto
Implementation of Array Antenna for Footprint Adjusment on SFCW GPR Application 20 A.Kurniawan, A.A. Pramudita, A.E. Saputra, and Iskandar
A Comparative Study of Interpolation Methods on Channel Estimation for Downlink OFDMA IEEE 802.16e Standard
25 Savitri Galih, Riafeni Karlina, Fifin Nugroho, Ade Irawan, Trio Adiono, Adit Kurniawan
High Mobility Data Pilot Based Channel Estimation for Downlink OFDMA System Based on IEEE 802.16e Standard
31 Savitri Galih, Riafeni Karlina, Fifin Nugroho, Ade Irawan, Trio Adiono, Adit Kurniawan
Predictive Power Control of CDMA Systems in Rayleigh Fading Channels 36 A. Kurniawan, Iskandar, Sayid Machdar
High Performance Time-and-Frequency Synchronization Design for DVB-T/H System 41 Nico Surantha, Sugihartono, Amy Hamidah Salman, Trio Adiono
Performance of RoF in P2P network using PSK and DPSK modulation format 46 M. Othman, S.F. Mardan, H.A. Kadir, R. Talib, N.A. Cholan, M.F.L. Abdullah, N.H. Ismail, A. Bahari
SEARCH TECHNOLOGIES AND DATA MINING
Located Bloom Filter 49
Agung Sediyono, Ku Ruhana Ku‐Mahamud
Cross-Selling’s Product Determination in the Context of Analytical CRM Based on Association Rules
53 Eko K. Budiardjo, Bayu Adhi Tama
Optimized Sampling with Clustering Approach for Large Intrusion Detection Data 56 Nani Yasmin, Anto Satriyo Nugroho, Harya Widiputra
Knowledge Extraction from the Semantic Web 61
Bernard Renaldy Suteja, Suryo Guritno, Retantyo Wardoyo, Ahmad Ashari
Frequent Episode Rules Using Compressed Frequent Pattern Data Tree Structure 65 Rana Loda Tama, Souza Nurafrianto W.P, Alva Erwin, Harya Damar Widiputra
cAnt-WUM : Ant Colony Classification Algorithms Coping Continuous Attributes For Web Usage Mining
77 Abdurrahman, Bambang Riyanto T., Rila Mandala, Rajesri Govindaraju
APPLICATIONS
The Antecedents and Outcomes of E-Learning Effectiveness in the Manufacturing Industry 85 Noornina Dahlan, Loh Boon Hiang, Jaslin Md Dahlan
Evaluation of e-Commerce Web Site Stickiness and its Impact on Firm Performance: Web Hosting Industry
91 Jaslin Md Dahlan, Yu Shew Ling, Noornina Dahlan
Rural Communities’ Information Needs and ‘Portal Desa’ Template 100 Huda Ibrahim, Nor Iadah Yusop, Zahurin Mat Aji, Zulkhairi Md Dahalin, Osman Ghazali, Shafiz Affendi Mohd
Yusof, Mohd Nizam Saad, Mohamad Amir Abu Seman, Azman Yasin, Mohd Khairudin Kasiran, Rafidah Abd Razak
PORDES: A Vertical Search Engine for Rural Society 106
Dwi H. Widyantoro, Ayu Purwarianti, Masayu L. Khodra, Yudi Wibisono
Data Authentication Protocol Modeling on Multilayer Data hiding for Multilayer Protocol 112 Christian Gustav
Flood Alert Notification System (FANoS) 117
Herdawatie Abdul Kadir, Mohd Helmy Abd Wahab, Mohamad Farhan Mohamad Mohsin, Hairulazwan bin Hashim, Ahmad Nurfaqih bin Ahmad Tajuddin
Design and Implementation of a Software and Trainer to Simplify AT89S52 Microcontroller Programming
121 Enjang A.Juanda, Yoyo Somantri, Dendy Mardiansyah
SMS-Based Electrical Energy Meter: A Hardware Design 127
Mohd Helmy Abd Wahab, Herdawatie Abdul Kadir, Azhar Ismail, Ayob Johari, Mohamad Farhan Mohamad Mohsin
Zachman Framework Approach In Designing Corporate Information Factory 131 Kusuma Ayu Laksitowening, Bambang Riyanto
Modularity Framework as a New Software Framework in Enhancing Modularity in Open Source Projects
136 Andi Wahju Rahardjo Emanuel, Khabib Mustofa
Exchange Rate Prediction between Indonesian Rupiah and U.S. Dollar Using Transductive Learning
141 Tanto Winarko, Anto Satriyo Nugroho, Harya Damar Widiputra
Analysis of Gen Expression and Microarray Data on Pattern Recognition Techniques: Review 143 Ermatita, Sri Hartati
E-GOVERNMENT
E-Government Implementation Strategy Toward Information Technology (IT) Governance Environment
Building Public Trust Through Public Participation Using E-Governance 155 Jazi Eko Istiyanto, Purwo Santoso, Vitri Tundjungsari
Overview E-Government User profile and Digital Divide in Developing Country 163 Dinar Mutiara Kusumo Nugraheni
E-HEALTH
Statistical Analysis in Digital Mammogram Images 169
Oky Dwi Nurhayati, Adhi Susanto, Thomas Sri Widodo
Chest X-ray Image Registration Using Mutual Information Criterion for Supporting Lung Diseases Analysis
173 Lucas Bonifasio Nugraha Perdana Hardjosoekanta
A Preliminary Evaluation of Vector Quantization Coding Performance on Color Retinal Image 180 Agung W. Setiawan, Andriyan B. Suksmono, Tati R. Mengko
Design of an Automated Acid Fast Bacilli (AFB) Identification Module to Support Sputum Smear Microscopic Examination in Tuberculosis Preliminary Casefinding
185 A. Handayani, L.I. Octovia, A.B. Suksmono, T.L.R. Mengko
Text Classification Using Support Vector Machine for Webmining Based Spatio Temporal Analysis of the Spread of Tropical Diseases
189 Fatimah Wulandini, Anto Satriyo Nugroho
GQM paradigm at meaure of system application reporting online of number patients for endemy disease in town semarang bases on GIS
193 Ajie Prasetyo, Eko Handoyo
Design and Preliminary Result on Content-Based Image Retrieval (CBIR) System for Osteoporosis X-Ray Image Database
199 Ratnasari Nur. R, Lukito Edi. N, Thomas Sri W., Adhi Susanto, Nurokhim
Teleassessment System for Geriatric Patient 203
Kusrini, Sri Hartati, Agus Harjoko, Retantyo Wardoyo
E-LEARNING
How Interactive Multimedia (IMM) Affect Students’ Cognition in Learning Biology at The Midle and Higher Education Level?
209 Fransisca Sudargo Tapilouw, Enjang Akhmad Juanda
Interactive Multimedia Learning Model to Improve Concept Comprehension of Special Relativity on Senior High School Students
215 Ketang Wiyono, Agus Setiawan
Inquiry Based interactive Multimedia in Rate of Reaction to Enhance High School Students' Creative Thinking Skills
219 Iriany, Liliasari
ICT Based Instruction of Chemical Equilibrium Phase: Improvement of Students’ Critical Thinking and Generic Science Skills
Onlineboard Learning Support System 227 Rosye Arosdiani Apip, Ana Hadiana
Competencies Based Knowledge Management Model with Learning Style Approach for Empowering Rural Society
232 Joko Siswanto, Dicky Prima Satya
A Conceptual Model of Indonesian Virtual Herbarium (IVH) 239
Fazat Nur Azizah, Adi Mulyanto, Inggriani Liem
Pinteraktif – Learning 2.0 Platform 245
Ferry Chrisnandika, Deasy A. Putri Pane
Assessing Web 2.0 Applications for Indonesia Distance Learning in Rural Areas 249 Yenni M. Djajalaksana, Tiur Gantini, Frederic Constantianus
e-Learning Ecosystem Model for Rural Area in Pekanbaru 258
Dadang Syarif Sihabudin Sahid, Ab. Razak Bin Che Hussin
ICT-based Approaches for Improving the Quality of Primary Education in Rural Areas 264 Armein Z.R. Langi, Dwi H. Widyantoro, Yoanes Bandung, G.A. Putri Saptawati, Liliasari
The Use of Interactive Multimedia to Enhance Students' Generic Science Skills 269 Liliasari
POLICY STUDY ON RURAL COMMUNICATION
Current LAPAN Program on Satellite Technology and Application Development 274 Abdul Rahman, Mohammad Mukhayadi
Indonesian ICT Infrastructure for Poverty Alleviation 279
Ary Syahriar, Rizky Qinthara Syahriar
Acting As a State: Open Source Development in Indonesia 283
Yuti Ariani
e-Health Implementation for Rural Areas in Indonesia - Review on Data and Technology Readiness
290 Wikan Danar Sunindyo, Soleh Udin Al Ayubi, Saiful Akbar, Fazat Nur Azizah, Putri Saptawati, Hira Laksmiwati
Zoro
A Case Study of E-Procurement System Implementation in the Procurement Branch of Logistic Department Royal Malaysia Police
296 Shukri Abdullah, Mohd Nizam Saad
Development of a logistics brokering system for South Africa’s displaced rural residents 300 Johan Maritz
Low-cost Highly-interoperable Multiplatform Campus Network: Experience of YARSI University
311 Surya Agustian, Sandra Permana, Salman Teguh Pratista, Syarifu Adam, Iswandi
The Influence of Community Characteristics towards Telecentres Success 317 Nor Iadah Yusop, Shafiz Affendi Mohd Yusof, Zahurin Mat Aji, Huda Hj. Ibrahim, Mohd. Khairudin Kasiran,
Strategy for Telecentres’ Sustenance 321 Zulkhairi, M.D., Rafidah, A.R., Huda I., Nor‐Iadah, Y., Zahurin, M.A, Shafiz‐Affendi M.Y., Mohd‐Khairudin, K.,
Nor‐Farzana, A.G
The People Factor in Supporting Sustainability of Telecentres: A Malaysian Perspective 326 Nor Farzana Abd Ghani, Nor Iadah Yusop, Zahurin Mat Aji, Mohd. Khairudin Kasiran, Zulkhairi Md. Dahalin,
Huda Hj. Ibrahim, Shafiz Affendi Mohd Yusof, Syahida Hassan, Rafidah Abd. Razak
SOSIOECONOMIC ASPECTS OF R-ICT
On Techno entropy: Considering Socio-Cultural Dimension of the ICT Implementation in Rural Area
330 Ruly Darmawan
Factors That Influence Ethical Behavior of Cyber Cafe User Based on The Theory of Planned Behavior
334 Zuriani Ahmad Zukarnain, Huda Ibrahim, Zulkhairi Md Dahalin, Nor Iadah Yusop, Rafidah Abd Razak, Wan
Rozaini Sheik Osman
Operability and Reliability Success Factors of Rural Telecommunication Sets 340 Suhardi, Ayu Wulandari
INFORMATION & SYSTEM SECURITY
Image Quality Assessment of Fast Fourier Transform Domain Watermarked Images 345 R.F. Olanrewaju, A.A. Aburas, O.O. Khalifah, A. Abdulla
Software Cryptography Issues 350
Budi Rahardjo, Marisa W. Paryasto
Randomness Analysis of Block Cipher Using Chaos Game Method 354 Budi Sulistyo, Budi Rahardjo, Dimitri Mahayana, Carmadi Machbub
Derivation of An Existing Symmetric Watermarking Technique into Its Asymmetric Version, Case Study: Wang Algorithm
360 Rinaldi Munir, Bambang Riyanto T., Sarwono Sutikno, Wiseto P. Agung
LANGUAGE PROCESSING
Proper Noun Adaptation for Improving a Spoken Query-based Indonesian Information Retrieval System
366 Dessi Puji Lestari, Sadaoki Furui
Text Document Split Pattern Browsing Based on Linguistic Knowledge of Writing Javanesse Script using Natural Language Processing
372 Ema Utami, Jazi Eko Istiyanto, Sri Hartati, Marsono, Ahmad Ashari
SIDoBI: Indonesian Language Document Summarization System 378
Bowo Prasetyo, Teduh Uliniansyah, Oskar Riandi
SIGNAL & IMAGE PROCESSING
Compressive Sampling with Known Spectral Density 388
Andriyan Bayu Suksmono
Adaptive Regularized Newton Algorithm for Image Reconstruction in Electrical Impedance Tomography
393 Deddy Kurniadi
Precisely Iris Location Based on Point Hough Transform 398
Xiang Wan, Hyun J. Park, Eui Y. Cha
A New Curvature Based Detection of Cerebral Aneurysm from 3D Medical Images 402 Hasballah Zakaria, Tati L. R. Mengko, Oerip S. Santoso
Face Tracking System with Haar Method and Pre-Study Face Recognition with Histogram Comparison
408 Endah Sudarmilah, Adhi Susanto
Dual Tree Complex Wavelet Transform for Identification of Face Image 413 Gunawan Sugiarta,YB., Riyanto, B., Hendrawan, Suhardi
An Application of Handwriting Recognition System for Recognizing Student’s ID and Score on the Examination Paper Using WebCam
418 Aryuanto, Yusuf Ismail Nakhoda
Adaptive Fingerprint Image Defect Detection and Classification Based on Fingerprint Image Quality Analysis
Intelligent Computation in Multi-Robotic Systems
Andrzej Maslowski
Warsaw University of Technology, Institute of Mathematical Machines,
Research Institute for Automation and Measurements, Warsaw, Poland
Abstract—Following paper is focused on the computational intelligence applied in cognitive supervision of the web connected multi-robotic system. The cognitive model of the human operator is described. The concept of the implementation of the cognitive model of human – operator is shown. The computational intelligence algorithms’ usage in cognitive supervision is described, therefore the implementation of the classification and regression methods are presented. The development of the system components using Compute Unified Device Architecture (CUDA) is shown, therefore the increased performance is proven.
I. INTRODUCTION
This paper describes the Cognitive Theory – Based Approach of multi mobile robot control with focus on artificial intelligence application. The main goal of the approach lays on the implementation of the self reasoning which is provided by the model of human supervisor. The interfaces are implemented in server – client scheme, because the mobile platforms are prepared to cooperate in distributed control system. All the cooperation shown above requires a kind of complex architecture which can be derived from CORBA. This paper as well, has shown how the architecture is applied and in general inducing an idea of multi-robot supervision.
In managing the complexity of the attributes of the system as been described above, then the behavioral conceptual adoption should be applied. This application succeed it’s intelligence system by perpetuating the decision selection system which grounding its operation by the fuzzyARTMAP algorithm system. This skill is a prominent achievement which leads into the perceptual associative memory, as another essential attribute of the systematic cognitive system that this research borrowed it’s concept.
The perceptual associative memory in this system particularly rendered by an ability to interpret the incoming stimuli by recognizing individuals or objects, categorizing them and noting the relationships between the objects and categories. These attributes mentioned above are showing the pertinent robot action which are always consistent with the categories and their relations. So far, the study has able to provide the new approach of the robot’s cooperation system
In the application, the autonomous mobile robot is
accompanying the teleoperated one. Meanwhile, the main goal for the mobile robot itself is to acquire data from the environment and delivers into Command Operation Center through the wireless communication system. The concept of building geometrical map using MK-SVM Multi Kernel Support Vector Machine is presented. COC is functioned by the existing system of the cognitive modeled of human supervision which perceptually and behaviorally are able to recognize and execute the procedures needed in the case of some risky events, particularly the collision problems given by supervision of autonomous navigation module. In contrary the PSO (Particle Swarm Optimization) algorithm as an improvement of Support Vector machine is shown. Therefore the two substantial components from the perception and association actions by mapping and localizing tasks are achieved by the system.
II. WEB CONNECTED ROBOTICS SYSTEM
The industry standard CORBA has been chosen for the implementation of the distributed robotic control system. CORBA is language and platform independent. Using such a standard simplifies the development and improves the interoperability with existing software. CORBA is actually a specification of the Object Management Group and the TAO (The ACE ORB) implementation has been chosen among others because it is an open source, efficient and standards-compliant real-time implementation of CORBA. Each system component provides CORBA server with its functionality, therefore each sensor can be read by CORBA clients.
III. COGNITIVE SUPERVISION
Behavior Layer solves the autonomous navigation task. We consider using VFH+ algorithm or alternatively fuzzyARTMAP neural network for obstacle avoidance. System of the mobile agents is built from mobile platforms connected by Ethernet operating in CORBA distributed control system. Mission planning module stores mission plans, therefore cognitive model can supervise the mission execution using graph similarity methods.
Cognitive model of human – operator is able to learn by developing geometrical map, set of mission plans, and learning fuzzyARTMAP.
IV. HUMAN MACHINE INTERFACE / COGNITIVE MODEL – MACHINE INTERFACE
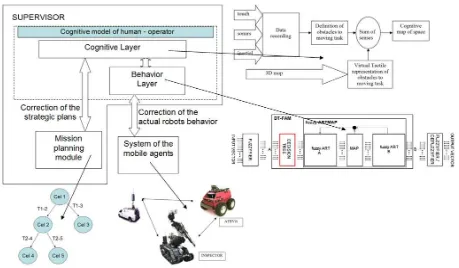
We introduce the new concept of Cognitive Model – Machine Interface (CMMI). Following Figure 2 shows the visualization of the Cognitive map of space. We assume that our approach provides useful mechanism for Cognitive map of space understanding, in the same time the visualization of the mentioned cognitive map can be used as the Human Machine Interface. Presented idea is showing cognitive nature of the cognitive model human – operator. We can assure that, model has imagination Figure 1. Cognitive model of the human – operator
Mission
Robot position Geometrical map
Supervision of the autonomous navigation
about robots position, it is visualized by robot models rendered on the global map. Model has imagination about mission and its execution, therefore the mission is represented by set of flags correspond to local goals. The model has knowledge about geometrical representation of the environment, therefore it can execute supervision if the autonomous navigation task. The geometrical map is given by rendered triangles, supervision of the autonomous navigation corresponds to the color of the rectangular prism surrounding mobile robot. If red color occurs, it denotes a problem.
V. GEOMETRICAL MAP
We assume that at least one mobile robot is equipped with sensor available to build geometrical 3D map. For the experimental purpose we equipped mobile platform with 3D Laser Range Finder. Therefore the 3D range data can be acquired during the robot executing task. Following figure shows a scheme for 3D map representation on the flat area as the set of nodes stores local 3D maps.
Figure 3. The robot path with nodes stored 3d local MAP
The geometrical map is a basic input for the supervision of the autonomous navigation. 3D local map is built from triangles. To compute the set of triangle we are using Hough transform for line extraction and for rest points the SVM – Support Vector Machine for convex figure approximation. The support vector machine approximation is based on introducing the ε-insensitive loss-function:
where SL represents the data of the 2D RLF measurement,
f(x) is the smooth approximation function of SL and the
vector x represents the index of the measured point. The function f(x) can be obtained with precision ε by solving the constraint optimization problem [4]
⎥ maximum value of Lagrange multipliers for points lying outside of the tube and k(xi, xj) is the kernel function satisfying Mercer’s theorem.
The support vector approximation is equal:
∑
The support vector machine approximation can be solved by using decomposition methods. We applied the Sequential Minimal Optimization (SMO) - extreme decomposition of the QP problem that involves two Lagrange multipliers at one step, the smallest possible optimization problem, because they must obey a linear equality constraint. The basic operations at every step of the SMO procedure are: heuristic choice two Lagrange multipliers to jointly optimize, analytical method to optimize values for these multipliers, a method for computing b, updates the SVM to reflect the new optimal values.
The SMO procedure is computationally efficient. It solves two Lagrange multipliers which can be done analytically with no requirement for large matrix storage.
The support vector approximation has some advantageous properties. The points inside the insensitive tube have Lagrange multipliers α, α*=0, hence they have no influence on the function approximation. The support vectors are points lying on the border of the tube (their Lagrange multipliers α, α* > 0) and the points lying out of the tube (their Lagrange multipliers α, α* = C).
The quality of SVM approximation strongly depends on the proper choice of the parameters ε and C and on the kernel function and its parameters. The best selection gives the sparse function approximation of high accuracy represented by the least number of support vectors giving rise to the simplest function representation. In our approach, the number of support vectors varies from 12% to 55% of the total number of points of the dataset.
We introduce an imprudent of the SVM algorithm [1] – MK-SVM. The multi kernel support vector (MK-SVM) approximation is given:
∑∑
∑
The algorithm of the multi kernel support vector machine training is given:
begin
node with 3D local MAP
for j = 1:m
set k(j) //set different kernel for each SVM
setSVMparams(j) //set proper input //parameters for each SVM end
trainingset = inputdata //input data are //given by
//laser system
//measurement
oldresult = trainSVM(j=1) newresult = inputdata;
for j = 2:m
tempresult = resultSVM(j-1)
trainingset = newresult – tempresult newresult = trainSVM(j)
end
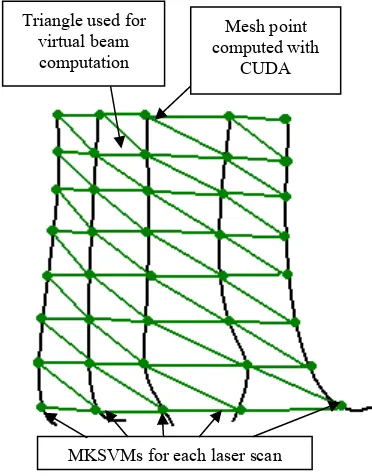
The crucial point for our cognitive decision computation is the 3d map reconstruction. To obtain the virtual laser beam measurement the reconstruction of the local 3d map of the node (Figure 3) has to be done in real time mode to keep the safety of the mobile platform movement. It is important to realize, that presented idea allows to operate the platform without sensors in 3d space. The 3d map and localization problem have to be solved to achieve the manipulation safety of the “blind” robot. We applied the Common Unified Device Architecture (CUDA) to solve the highly computational complexity of the problem.
The following Figure 4 shows the idea of the 3d map reconstruction for convex figures.
Figure 4. Algorithm for 3D map reconstruction
The Find node block represents the algorithm of robot
path searching ( the robot paths is shown on Figure 3) to obtain the node which stores the 3d local MAP. The
Compute MKSVM result for mesh of points block
represents the algorithm of the 3d local map points computation using equation 5 (MKSVM approximation). The input is defined as matrix of points I[i, j] (x, y, αi ,βj), where x, y are the node positions in global map, αi and βj are the vertical and horizontal angles of the laser beam.
The Combine points into triangles block represents the
algorithm of the obtaining the set of rendered triangles from mesh of computed 3d points.
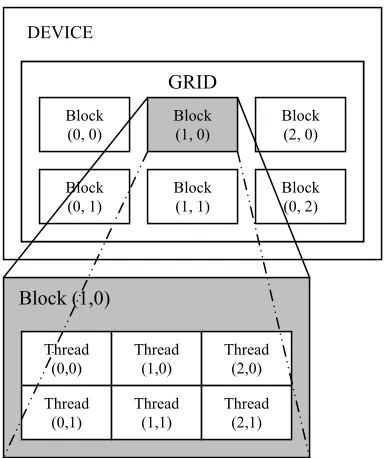
To compute mesh of points of the 3D map we are using Compute Unified Architecture (NVIDIA CUDA). Therefore the computation is executed in highly parallel way. The result of the map 3D reconstruction algorithm is
the set of the vertexes of the 3D robot environment. The reconstruction algorithm is based on the kernel execution in the Grid of Thread Blocks. There is a limited maximum number of threads that a block can contain. The implementation uses 256 threads (16 x 16). Blocks of the same dimensionality and size that execute the same kernel are batched together into a grid of blocks, therefore the number of threads that can be launched in a single kernel invocation is much larger:
NTh = Dx_Th * Dy_Th * Dx_B * Dy_B where:
NTh – number of threads, Dx_Th – number of rows in thread table, Dy_Th – number of columns in thread table, Dx_B – number of rows in grid table, Dy_B – number of columns in grid table.
Figure 5. The idea of 3D map reconstruction.
Each thread is identified by its thread ID, which is the thread number within the block ID_Th(x, y) = x+y*Dx_Th. Each block is identified by it’s block ID, which is the block number within the grid ID_B(x, y) = x+y*Dx_B [9]. Each thread executes the kernel function for one triangle of the scene, therefore the maximum number of triangles are limited by number of threads - NTh. The following picture shows the thread organization as a grid of thread blocks.
Find node
Compute MKSVM result for mesh of points
Combine points into triangles
Mesh point computed with
CUDA Triangle used for
virtual beam computation
Figure 6. The thread organization as a grid of thread blocks
The thread realizes the kernel function for the input data assign by its block id. For the 3D reconstruction kernel’s function realizes the equation (5). Further, the reconstructed map is used for virtual laser beam computation for cognitive supervision. Therefore the collision detection between robot chassis and the complex environment is obtained. The virtual laser beam measurement is coded into the tactile representation of the 3D scene as an input of the classifier.
VI. PARTICLE SWARM OPTIMIZATION FOR SVM
The goal for particles [5] is to find locations of the local maximum of the regression function and cover the area round this locations. The result is decomposed training set, that represents points potentially giving the highest impact into SVM SMO regression computation. We are proposing the method for the omitting flat region regression computation, that can potentially decrease the computational complexity.
The particle is defined as a data structure contains
Central point
Cp
(
x
1,
x
2,...,
x
n)
status – KINEMATIC (particle can change position) or STATIC (particle is located in local maximum of the regression function local SVM)
Range of broadcast Rb
Potential barrier Pb
Particles have social abilities to share information. We defined two types of behavior, kinematic and static. Ones, particle finds local maximum of the local regression function (local SVM), it changes behavior from kinematic into static and starts broadcasting this information in the neighborhood defined by Rb. This broadcast has high impact into the velocities of the particles in the range of Rb. We assume that static particle attracts all kinematic particles from neighborhood if the distance satisfies the potential barrier Pb condition, otherwise kinematic particles are pushed away form the local maximum. The following figure shows an idea of the potential field used for broadcasting the information by static particles.
Figure 7. The visualization of the potential field used for broadcasting the information from static particles.
The algorithm PSO-SVM is given:
1. Initialize a population array of kinematic particles with random positions and velocities on D
dimensions in the search space. 2. loop
3. For each particle par
(
Cp,R,Pi,SVM,status,Rb,Pb)
, evaluate the SVM local regression function in Dvariables.
4. If current location is the local maximum of the local SVM regression function than fitness evaluation parameter equals local maximum. Compare particle’s fitness evaluation with its pbesti (> local maximum). If current value is better than pbesti, then set pbesti equal to the current value, and
i p →
equal to the current location → i
x in D-dimensional space.
5. If local maximum found, change particle status to
static and start broadcasting this information to
kinematic particles from neighborhood.
6. For all kinematic particles change the velocity vector assuming static particle broadcast using physical conditions of the simulated potential field. 7. If a criterion is met (usually a sufficiently good
fitness or a maximum number of iterations), exit loop.
8. end loop
9. Compute SVM SMO using training set composed by points that satisfie the range of particles.
Static particles Potential barrier
VII. SUPERVISION OF AUTONOMOUS NAVIGATION
Robot navigation means its ability to determine its own position in its frame of reference and then to plan a path towards some goal location. In order to navigate, the mobile robot requires representation of its environment i.e. a map of the environment and the ability to interpret that representation. The art of navigation consists of smaller robot competences like:
ability to self-localizing in the environment, which requires
map-Building and Map-Interpretation
ability to path plan
local obstacle avoidance
Localization denotes the robot's ability to establish its own position and orientation within the frame of reference. Path planning is effectively an extension of localization, in that it requires the determination of the robot's current position and a position of a goal location, both within the same frame of reference or coordinates. Map building can be in the shape of a metric map or any notation describing locations in the robot frame of reference. In this study we will present the most popular approaches to global path planning using A* and Dijkstra’s algorithms and two approaches to local obstacle avoidance using VFH (Vector Field Histogram) and Fuzzy ARTMAP. It is worth to mention main advantages of two algorithms to global path planning. A* algorithm is preferred when searching the shortest path from the position point of the robot to the target point. It is experimentally proved to get the shortest path in reasonably short time using this algorithm. On the other hand Dijkstra’s algorithm is preferred when the robot needs to search shortest paths to many targets and choose one on this basis.
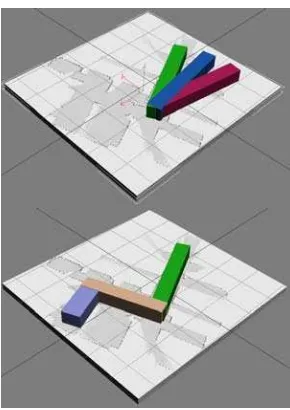
Figure 8. Supervision of the autonomous navigation.
The idea of robot navigation in 3D virtual world built from 3D LRF data is based on the verification of the hypothesis of the motion without collision. Multi hypothesis verification is high computational task, therefore CUDA capabilities are used for solving real time navigation. The basic object of the algorithm is the rectangular prism. Scene is represented as set of triangles and cloud of points. The fundamental procedure of 3D navigation is based on verification if there is an intersection of the triangle from the scene with current rectangular prism. If intersection appears the probability of safety navigation in current direction is low and decreases when another intersection is detected.
VIII. EXPERIMENTS
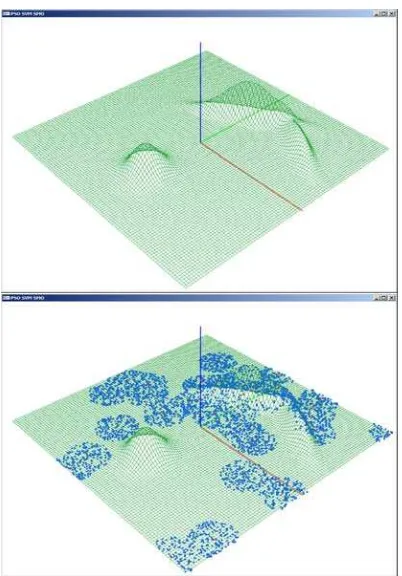
The PSO-SVM regression decomposition algorithm was tested during 2-dimentional experimental surface approximation. The approximated function is composed by five Gaussian functions located in different separated areas. The SVM SMO algorithm was taken into the consideration with following parameters: Gaussian Kernel (sigma = 0.05), Tol = 1e-3, C = 1, Epsilon = 0.05. The 30 particles:
( )
was generated to solve the decomposition problem of the following set of points.
Figure 10: 2-dimentional experimental function (top), particles (bottom).
Figure 11: Result of PSO-SVM after 6th (top) and 12th (bottom) iteration
Figure 12: Result of PSO-SVM after 32th (top) and 100th (bottom) iteration
Figure13: Result of PSO-SVM approximation.
IX. CONCLUSION
understanding, in the same time the visualization of the mentioned cognitive map can be used as the Human Machine Interface. The idea of robot navigation in 3D virtual world built from 3D LRF data based on the verification of the hypothesis of the motion without collision is shown. The advantage of Compute Unified Device Architecture usage in cognitive supervision is shown.
REFERENCES
[1] J. Bedkowski, P. Kowalski, A. Masłowski: Computational intelligence In cognitive supervision of the robotic system for crisis and disaster management, The 4th International Conference on Information & Communication Technology and Systems p. 556-561 August 5 2008, Surabaya - Indonesia
[2] J. Będkowski, A. Masłowski: Cognitive model of the human supervisor for insection/intervention robotic system, III Conference Young scientists towards the challenges of contemporary technology 22-24.09.2008
[3] A. Maslowski, J. Bedkowski, G. Kowalski: Mobile Multi-robot Inspection Systems – Experience in Poland, Proceedings IARP- Workshop on Environmental Maintenance & Protection July 22 – 23 2008 Baden-Baden
[4] J. C. Platt, Fast training of support vector machines using sequential minimal optimization, Advances in Kernel Methods: Support Vector Machines, ed. B. Scholkopf, C. Burges and A. Smola, MIT Press, Cambridge MA, 1998.
Random Search Codes and Implementation Model
for Optical-CDMA-Based Local Area Networks
Nasaruddin1, Tetsuo Tsujioka2 1
Electrical Engineering Department, Syiah Kuala University
Jl. Syech Abdurrauf No. 7, Darussalam, Banda Aceh 23111, Indonesia, [email protected] 2
Graduate School of Engineering, Osaka City University
3-3-138, Sugimoto, Sumiyoshi-ku, Osaka 558-8585, Japan, [email protected]
Abstract—Optical code division multiple access (OCDMA) has the potential to provide flexibility and scalability for future local area networks (LANs) due to its simplicity in network control and management. OCDMA also provides low access delay that is suited well for bursty LAN traffic. Furthermore, optical coding allows users to share the same optical bandwidth and to operate asynchronously. In this paper, we present new random strict optical orthogonal codes (RS-OOCs), where a code set of RS-OOC is randomly generated and tested by a computer. The RS-OOC can achieve the minimum correlation value of one for the least multiple access interference in incoherent OCDMA computer networks. Moreover, implementation model is a crucial factor for OCDMA network architectures, without requiring synchronization among individual users. To realization of the RS-OOC, an implementation model of OCDMA-based LAN by using MATLAB simulink is investigated for four-pair users in the network. Then, we discuss the simulation results that are obtained from representative OCDMA-based LAN. The results show that the implementation model is straightforward and easy to implement LAN by using the OCDMA technique as the MATLAB simulink model.
I. INTRODUCTION
Rapid growth of network and Internet traffic has placed high demand on the existing infrastructure. Recently, the demand for high speed and high capacity communication networks has received much attention to local area. In the future, local area network (LAN) should provide the requirements and a complete random asynchronous access. Since traffic in LAN is characterized by its burst in nature, conventional multi-access schemes; time division multiplexing (TDM) and wavelength division multiplexing (WDM), do not fulfil the above requirements, because the TDM or WDM is synchronous access system. Therefore, asynchronous multiplexing schemes are important to maximize the utilization of network resources.
Optical CDMA (OCDMA) system has been shown as a promising technology for future high speed LANs [1], [2]. It allows a large number of users to share the entire channel bandwidth of an optical fiber and offers asynchronous access, re-configurability of multi-user, on-demand capacity, and potential inherent security [3]. It has also the potential to provide flexibility and scalability
for future LANs due to its simplicity in network control and management. In OCDMA systems, each user (node) is assigned to a specific codeword as his code address. Therefore, coding scheme is a prerequisite for designing the OCDMA system. The number of users that can be supported depends on length, weight, and efficiency of the coding scheme with which signals are coded for transmission. In most incoherent OCDMA systems, only unipolar (0, 1) codes can be used. A class of unipolar codes called optical orthogonal code (OOC) has been applied for OCDMA [4]–[7]. However, most of OOCs were constructed based on algebraic structures, where the codes that can be designed will be limited to specific code parameters. Therefore, flexible code designs are important. Furthermore, implementation models of OOCs are also crucial towards practical LAN based on OCDMA.
This paper proposes new random strict optical orthogonal codes (OOCs), where a code set of RS-OOC is randomly generated and tested by a computer. The proposed RS-OOCs can find the codes for any code parameter with the minimum correlation value of one for the least multiple access interference (MAI) in OCDMA-based LANs. Moreover, bit error probability of the proposed RS-OOCs is evaluated numerically. To realization of the proposed codes, this paper will also investigate an implementation model of OCDMA-based LAN by using MATLAB simulink for four-pair users in the network. Simulation results of the implementation model are demonstrated that include spectrum outputs of transmitted signals, combined signals, received signals, and eye-diagram. From the results, the implementation model is straightforward and easy to implement LAN by using the OCDMA technique as the MATLAB simulink model. Therefore, an OCDMA-based LAN is practically evaluated in this paper.
II. OCDMA-BASED LAN ARCHITECTURE LANs need to connect a large number of users within a local area with high speed transmission. A LAN offers the advantage of a random access of the user to the network. The use of OCDMA technology in a LAN, it makes efficient use of channel by providing asynchronous access to each user. Figure 1 shows a typical OCDMA-based LAN architecture that consists of several nodes (i.e., eight users) connected by optical fibers to a passive star coupler. Each user will assign a codeword of a RS-OOC. The star coupler combines the optical signals from all nodes. Each node is connected to one input and one output port by an optical fiber. Then, the nodes and the star coupler form a shared medium network. The input and output ports are called transmitter and receiver, respectively. A node that is transmitting data to the other nodes on the LAN encodes the individual “1” bits into “chips” according to the RS-OOC. Every node in the network is assigned to a specific codeword. Transmitted signals on the inputs enter the coupler on several transmitters, where the optical power from all transmitters is merged. The power is then split equally among receivers. The same signal emerges on all the receivers of the coupler and is transmitted to all nodes. Furthermore, OCDMA technology enables an access platform, which provides interconnections between end-nodes and the wide area Internet through routers.
Router
Fig. 1. OCDMA-Based LAN architecture.
III. RANDOM STRICT OPTICAL ORTHOGONAL CODES
A new approach for the design of OOCs is presented here, based on a random method, where the code set is randomly generated by computer search and their correlation value is strictly bounded by one. Then we call them random strict OOCs (RS-OOCs). A RS-OOC, C, is a family of (0, 1) sequences with the maximum auto-correlation (λa) and cross-correlation (λc) values of one,
λa= λc=1, respectively. It is represented by a set of parameters (n, w, 1) RS-OOC, where n is code length and
w denotes the code weight which determines the total
number of “1s” in each codeword. The number of codewords or cardinality of a RS-OOC is denoted by |C|
To obtain the correlation value of a RS-OOC, the relative delay elements between two “1s” in a codeword, and among codewords, must be distinct. Let
x
∈
C
be a codeword and its relative delay elements are D∈{1,L,n−1}. Suppose xl0 =xl1=L=xlw−1=1 of x, then the set of delay elements between “1s” positions associated with x is denoted by}
Using Eqs. (2) and (3), if there is no repeated delay element between two “1s” positions within a codeword, and among codewords, in C, it gives the best correlation property of λa= λc= λ=1. A novel RS-OOC algorithm can be described as follows:
1. Select positive integers of w and |C|.
3. Set “0” for the first chip position in each codeword. Then assign a random integer of
}
positions for t-th codeword can be represented byn
Sort all possible w-set codewords and store them in look-up tables.
4. Check the used intervals in the codewords as t codeword are computed, they are compared with their own used intervals and intervals among the others. If they cannot satisfy the correlation properties of a RS-OOC, return to the previous step and continue.
5. If all constraint parameters are found, stop searching. Otherwise go back to step 3.
TABLEI
CODEWORDS OF A (125,4,1)RS-OOC
No “1s” Positions No “1s” Positions
1 (0, 3, 30, 61) 6 (0,10, 22, 48)
2 (0, 8, 17, 33) 7 (0, 4, 15, 60)
3 (0, 1, 7, 47) 8 (0, 13, 37, 72)
4 (0, 5, 34, 75) 9 (0, 14, 32, 68)
5 (0, 2, 23, 51) 10 (0, 19, 39, 81)
We have also simulated the used relative delay intervals in the code set and the result is shown in Figure 2. As we can see, there is no repeated use of delay intervals in the code. Hence, the correlation value of the RS-OOC can be guarantee at the minimum value of one in an incoherent OCDMA system.
Fig. 2. Relative delay elements used in a (125, 4, 1) RS-OOC in Table I.
In General, bit error probability (Pe) of an OCDMA system is primarily affected by MAI from the other users. Using the proposed RS-OOC, each interfering user may contribute only to one chip overlap (hit) with the intended receiver. Then, the probability that one of “1s” positions of a user codeword with weight w will overlap with one of “1s” positions of the desired codeword, is given by
.
2
2
n
w
p
=
(7)Without any other noise, Pe of an OCDMA–based system using the proposed RS-OOC can be modified from [8]
(
1
)
,
1
2
1
11
e
∑
−
=
− −
−
⎟⎟
⎠
⎞
⎜⎜
⎝
⎛
−
=
MTH g
g M g
p
p
g
M
P
(8)where M is the number of users in the network, g is the number of interferers with codewords of weight w and
TH is threshold.
Figure 3 shows bit error probability versus number of simultaneous (active) users. Employing code length = 10000, 100 active users can be accommodated in a network with Pe=10-7 and 10-9 for the weight 5 and 7, respectively. The performance worsens as the number of active users increase. Moreover, when large code weight is employed in the network, the performance is improved.
Fig. 3. Bit error probability versus number of simultaneous (active) users with code length = 10000.
IV. IMPLEMENTATION MODEL AND SIMULATION PARAMETERS
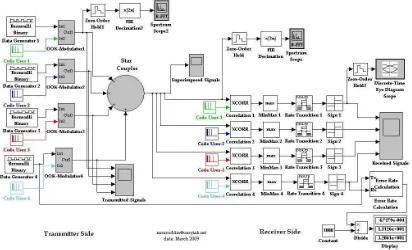
In this Section, we present an OCDMA-based LAN model which is similar to but simpler than the system it represents. One of purpose of a MATLAB/simulink model for OCDMA-based LAN is to enable the engineer to implement the optical coding and the visualization of the physical principal working of the network. A simulink implementation model for an OCDMA-based LAN is implemented as shown in Fig. 4. Simulation parameters for the model are listed in Table II. Using the simulation parameters, practical working of OCDMA-based LAN is evaluated.
TABLE III SIMULATION PARAMETERS
Parameter Constraint
Coding Scheme
(87, 5, 1) RS-OOC: Codeword 1: (0,1,9,31,55) Codeword 2: (0,2,5,19,44) Codeword 3: (0,6,16,27,53) Codeword 4: (0,7,20,35,58)
Number pairs of users 4
Discrete step 100 ps
Chip duration 1 ns
Bit duration 87 ns
Data rate 11.5 Mbps
V. RESULTS AND DISCUSSIONS
We have investigated the OCDMA-based LAN using the implementation model and simulation parameters as described in the previous Section. The simulated results of the OCDMA-based LAN model for four-user are as follows.
Let user 1 is assigned “1s” positions of (0,1,9,31,55) codeword. Every information bit is encoded into n = 87 optical chips. Assume information bit is 1. Optical pulses are sent exactly at the 0th, 1st, 9th, 31st and 55th chips. On the other hand, no pulse is sent if information bit is 0. Signal spectrum of user 1 after encoding process is shown in Fig. 5 that is monitored after modulation process of user 1’s codeword with generated data output of OOK-Modulator1. It can be used to evaluate system performance by observing its optical spectrum.
Fig. 5. Signal spectrum of user 1 after encoding process. Figure 6 shows signal spectrum of user 1 that is monitored before decoding process or after transmission through star coupler input of correlation 1. The spectrum is quite increased and different from the encoded spectrum due to the effect of interference from the other users.
Figure 7 shows the transmitted signals of the four-user in the network in time domain. These output signals are passed through star coupler. Then, active users superimpose their information signals through the star coupler. The superimposed signals of the four-user are shown in Fig. 8. They are then distributed to each receiver. To properly decoding the data, decoder is matched to the desired codeword.
Fig. 7. Transmitted signals of four users in the network.
Fig. 8. Superimposed signals of four users in the network. The decoded signals finally arrive at optical receivers. The received signals for the four-user are shown in Fig. 9. In the figure, the received signals are different from the transmitted signal because of different frame of the signals.
Fig. 9. Received signals of four users in the network.
Figure 10 shows binary eye diagrams of the received signal for user 1 and corresponding binary detected signals. Eye diagram is a very successful way of assessing the quality of a digital signal [9]. Therefore, as shown in the eye diagram, it is successfully transmitted the data with OOK modulation in the condition of four-pair users and the (87,5,1) RS-OOC.
Fig. 10. Received eye-diagram for user 1.
VI. CONCLUSIONS
The random search codes and the implementation model for OCDMA-based LAN have been proposed in this paper. Random algorithm for generating the proposed RS-OOCs has been presented. Some examples and bit error probability of the proposed RS-OOCs are evaluated. A simulation model for OCDMA-based LAN by using Matlab/Simulink tools has been discussed by addressing the use of the proposed RS-OOCs. We have demonstrated various output of spectrum signals and eye diagrams of the proposed implementation model for OCDMA-based LANs. The results show that the implementation model is straightforward and easy to implement LAN by using the OCDMA technique as the MATLAB simulink model. Furthermore, an OCDMA-based LAN is practically investigated as a future candidate technology to faster communication and more efficient use of channel.
REFERENCES
[1] P. R. Prucnal, Optical code division multiple access: Fundamental and applications, Boca Raton: Taylor & Francis, 2006.
[2] P. R. Prucnal, M. A. Santoro, and T. R. Fan, “Spread spectrum fiber-optic local area network using optical processing,” J. Lightwave Technol., vol. LT-4, no. 5, pp. 547-554, May 1986. [3] Nasaruddin and T. Tsujioka, “A novel design of reconfigurable
wavelength-time optical codes to enhance security in optical CDMA networks,” IEICE Trans. Commun., vol. E91-B, no. 8, pp. 2516-2524, Aug. 2008.
[4] J. A. Salehi, “Code division multiple-access techniques in optical fiber networks—Part I : Fundamental principles, IEEE Trans. Commun., vol.. 37, no. 8, pp.824-833, Aug. 1989.
[5] F. R. K. Chung, J. A. Salehi, and V. K. Wei, “Optical orthogonal codes: Design, analysis, and application,” IEEE Trans. Inf. Theory, vol. 35, no. 3, pp. 595-604, May 1989.
[7] J. G. Zhang, “Design of a special family of optical CDMA address codes for fully asynchronous data communications,” IEEE Trans. Commun., vol. 47, no. 7, pp. 967-972, Jul. 1999.
[8] Nasaruddin and T. Tsujioka, “ Multiple-length variable-weight optical orthogonal codes for supporting multirate multimedia services in optical CDMA networks,” IEICE Trans. Commun., vol. E90-B, no. 8, pp. 1968-1978, Aug. 2007.
Propagation Model Verification using Elementary
Environment Specific Method for Analyzing 802.16e
System Coverage in Bandung City
Andito Dwi Pratomo1, Ir. Legijono, Denny Sukarman, MSc. Hadi Hariyanto2, MSc
Catholic University of Atma Jaya, Jakarta and TELKOM R&D Centre, Bandung
1
[email protected], [email protected]
Abstract—Mobile WiMAX or 802.16e is one of wireless
access technologies that can provide users with high-speed data connection, mobility and relatively wide coverage. The interoperability effort under WiMAX Forum initiative makes this technology can be interoperable across multi-vendor infrastructures. By considering its very wide coverage range, in a relatively open area or less obstacles, Mobile WiMAX can be used in rural area. In order to predict the coverage more accurately, propagation model is the key issue to be verified first. The use of empirical propagation model, despite its superiority of fast execution and limited reliance for detail knowledge of the terrain, still needs a validation. Therefore we present analysis of Mobile WiMAX coverage using empirical propagation model namely SUI and COST-231 HATA. For both models, cell range estimation is made by a theoretical calculation. The result is then compared with the measurement data. Elementary Environment Specific (EES) is used as a method for gathering the measurement data. The result shows that SUI model appears to be more suitable for Bandung typical terrain than COST 231-HATA despite both model seems to over-predict the path loss.
Index Terms—Coverage Measurement, Mobile WiMAX, Propagation Model.
I. INTRODUCTION
Mobile WiMAX is a variance of Wireless Interoperability Microwave Access (WiMAX) which bears the standard name of IEEE 802.16e. In Mobile WiMAX, improvements were made to increase the capacity and coverage through several means. The use of Scalable OFDMA, MIMO system and smart antenna are introduced to achieve wider coverage while reducing interference to gain more capacity [3]. Propagation verification employs MIMO and smart antenna introduces more complex measurement methodology and analysis. The initial verification of the SISO antenna system and its propagation characteristics are required as the basis of more complex MIMO propagation verification. The study presented in this paper will be based on SISO antenna system.
Coverage of wireless system mainly depends on the path loss that is defined by propagation model and other
system parameters including the transmit power, operating frequency, antenna gain and antenna tilting [4]. Among the existence of the empirical models, SUI and COST-231 HATA were selected to model radio wave propagation in Bandung City. Either SUI or COST-231 HATA is appropriate for Mobile WiMAX system, since they comply with mobility aspect and operating frequency.
The purpose of this study is to find the appropriate propagation model for Mobile WiMAX in Bandung City and introduce some correction factor if needed. We use EES [5] approach to do measurement in order to validate the Mobile WiMAX coverage and compare the result with ones based on the empirical models.
II. MOBILE WiMAX COVERAGE
This section describes Mobile WiMAX system capabilities related to the coverage issues.
A. Link Budget Designing
The main purpose of link budget is to estimate the cell range [3]. An example of link budget is provided in [3] which becomes a basic model. In link budget, there are some important parameters need to be carefully analyzed including receiver sensitivity and system margin.
The main issue that makes receiver sensitivity becomes important aspect in link budget calculation is because Mobile WiMAX employs adaptive modulation and coding (AMC) schemes. One common means to discover the differences in each AMC performance is to conduct
link level simulation as in [6].
every AMC in different channel condition. The simulation value that will be used as basic assumption for designing link budget is SUI channel with medium delay profile or known as SUI-3.
The formula to characterize receiver sensitivity in dB is given below [2]:
Where BW_NOISE is the white noise perceived by the
receiver. SNR is the SNR threshold value for each
modulation and coding. Noise_Figure is the equipment
noise figure.
The second issue of link budget calculation is how to assume the system margin that is used to estimate the obstacle penetration losses. The common method for assuming the margin values is to appraise the typical propagation scenario in the measurement places. Since the research uses empirical propagation model, the system margin for each terrain models will likely be different.
B. The Empirical Propagation Models
There are several widely-accepted empirical path loss models for Mobile WiMAX namely SUI, COST-231 HATA and ECC [1]. The study use of the first-two models due to their simplicity and applicability within WiMAX Forum System Evaluation Methodology [6]. Both of them specifically characterized the types of terrain that have been designed for.
Propagation models formula is used in determining the cell range. Here is SUI path loss model formula as written in [1]:
is respectively the range and reference range which is 100
m; s is the shadowing factor which has typical values
between 8.2 dB and 10.6 dB. A is the free-space path loss
component, Xf and Xh is the frequency and height
correction factor respectively. γ is the path loss exponent
which value is obtained by using equation [1]:
b
Where a, b and c are the propagation constants which
values are defined in Table 1 and hbis the base station
(BS) antenna height in meter. Notice that SUI specifies its model into three different terrains namely SUI A, B and C and each one representing dense-obstacles, light-obstacle and open-area environment respectively.
Table 1. SUI Model’s propagation constants [1]
Parameter Terrain A Terrain B Terrain C
a 4,6 4,0 3,6
b (m-1) 0,0075 0,0065 0,0050
c (m) 12,6 17,1 20,0
Unlike SUI model, COST-231 HATA model only specifies two different propagations scenario namely urban and suburban or rural. The COST-231 HATA path loss formula is shown in equation below [1]:
...
correction factor which is 3 dB for urban type
environment and 0 dB for suburban or rural. a(hm) is the
correction factor for user antenna height.
C. Theoretical Cell Range Estimation
As explained earlier, the theoretical cell range estimation for each AMC scheme is used as reference for measuring the system coverage. The cell range generated by link budget calculation will be considered as theoretical bounds. However, the actual cell range may be different from the theoretical value due to certain factor such as; cluttering environment, heterogeneous terrain morphology and unpredictable reflection points that affect signal condition. Therefore to minimize the difference between actual system coverage and estimation, some necessary adjustment in link budget should be done by referring to the measurement activities result.
The measurement activities are conducted in effect to verify that the model is applicable within the area of measurement. Thus, by using the configured system profile and the path loss formula, the radius for each modulation can be obtained. The example cell range estimation for both models is shown in Table 2.
Table 2. Urban cell range estimation
Modulation
from each category will be taken as reference in measurement campaign.
III. MEASUREMENT METHODOLOGY
As stated in [5] that in essence, the empirical models are mainly suitable only for specific scenario in which the measurement campaigns were conducted. The simplicity of empirical propagation model takes its toll by inaccurately estimate the path loss if it is applied in different propagation scenario.
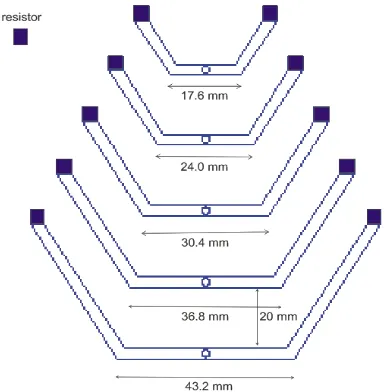
The objective of measurement campaign based on EES method is to explore the nature of shadowing in each terrain model. As explained in [5], the first step to use EES method is slicing the area within the estimated-coverage into smaller region which is called as a 50 x 50 meter cluster. See the fig. below.
Fig. 1. The EES clustering processes.
As shown in Fig. 1, each cluster will be categorized into certain category such as; dense-obstacles, light-obstacles and open-area. In determining the cluster category there are two considerations; the cluster environment condition and arriving direction of radio
wave relative to the base station position. The
measurement will be conducted in several clusters according to the theoretical range of each modulation schemes.
In order to find the actual cell range, while the connection between the terminal and BS is maintained, the terminal is moved gradually toward the cell edge. Therefore the system range can be obtained.
IV. MEASUREMENT RESULT
The measurement is taken to obtain the Received Signal Level (RSL) and Carrier to Interference-Noise Ratio (CINR) values as well as throughput against its modulation-coding scheme. The system parameters used for measurement are listed in Table 3.
Table 3. 802.16e system parameter configuration
Parameters BS CPE
Transmit Power 40 dBm 26 dBm
Antenna Gain 18 dB 13 dB
Antenna System SISO SISO
Antenna Type Dual
Polarization 65o Omni directional
Adaptive Modulation and Coding Schemes
QPSK ½, QPSK ¾ , 16QAM ½,
16QAM ¾, 64QAM ½, 64QAM ¾
QPSK ½, QPSK ¾, 16QAM ½,
16QAM ¾
Fig. 2 shows the measurement result.
Fig. 2. RSSI vs. measurement ranges.
Fig. 2 shows that the measured-RSL values are situated among the other theoretical curves. It means that the model more or less fit the measurement result. The measurement data can be classified according to the terrain category. Fig. 3 until Fig. 5 show the comparison between the theoretical RSL bounds obtained from link budget and the measurement result for each cluster category.
Fig. 4. RSSI vs. measurement ranges in light-obstacles environment.
Fig. 5. RSSI vs. measurement ranges in open-area environment.
From the observation, it is known that SUI A and COST urban tend to overestimate the path loss in the measurement points where the relative distance is greater than 1200 m. The theoretical RSL and measured-RSL beyond that point is incomparable. In Fig. 4, the theoretical result agrees with measurement data. The measurement curve is situated mostly between SUI B and COST suburban curves.
In Fig. 5, the measured-RSL in measurement points where the relative distance is around 500 m is comparable to theoretical COST rural. However, in relative distance between 1000 m and 1300 m, the RSL value is incomparable to COST rural but SUI C. In the relative distance around 1400 m and 2000 m, the measured RSL are situated between SUI C and COST. These results give information that theoretical curve from SUI C is tend to overestimate the path loss while COST rural is too optimistic.
From this point, it is cleared that the propagation conditions in the measurement places are mostly fall in suburban-like environment category. According to the observation, the empirical path loss specifically modeled for suburban environment should appropriate to model the propagation in the measurement places. Thus the
proposed empirical model namely SUI C and COST rural will be further analyzed.
However, in elaborating the measured data presented in Fig. 2, statistical approach, namely curve-fitting analysis, is used in order to obtain the data trend. Regression analysis is employed using cubic polynomial equation. Then, interpolation is calculated to predict the RSL value in unexplored data points. The cubic polynomial is selected because of its fitting property has the lowest Sum Square due to Error (SSE) value and R-square value close to ‘1’ in comparison with the other polynomial equation.. See fig. 6 below
Fig. 6. The regressions curve of measurement data.
In Fig. 6, prediction bounds or confidence bounds which are drawn with dashed-line, define the lower and upper bounds of the associated regression curve. The width of the interval between regression curve and prediction bounds define the variation interval of
predicted data.
In order to predict the actual cell range, the lowest achievable modulation receiver sensitivity value, that is QPSK ½, should be mapped onto the regression graphic. From the measurement campaign, the minimum RSL for QPSK ½ is -84 dBm. Thus, based on the regression, the actual QPSK ½ range predictions is 2250 meter away from base station antenna.
The EES model which is obtained from measurement campaign will be compared with the theoretical bounds. Fig. 7 shows the comparison among those curves.
Fig. 7. Throughput vs. measurement range.
For the sake of simplification, the throughput fluctuation is omitted. The system throughput shown in Fig. 7 is assumed as ideal maximum throughput in 5 MHz system. The highest throughput is achieved using
64-QAM 5/6 while the lowest is achieved using QPSK ½.
From here on, it is cleared that SUI B curve which is situated between regression and lower bound curve is the most suitable model in determining the coverage range for each modulation. The existences of the other curves are too optimistic or too pessimistic. Some corrections factor might be added in some interval of the coverage range so that empirical model can fit to the EES model.
V. CONCLUSION
Bandung is a typical urban city but based on the measurement results, it is understandable that most of the area within the coverage is fall in light-obstacles or suburban-like environment category. According to the measurement result, the scenario to be applied in link budget calculation should be based on light-obstacles environment and SUI path loss model, especially SUI B.
The EES concept enables the radio engineers to convincingly adjust the basic assumption such as system margin in link budget designing. The measurement campaign based on EES method is powerful and effective enough to verify the appropriate propagation model in a relatively clutter area such as Bandung.
REFERENCES
[1] Abhayawardhana, V. S., et al., “Comparison of Empirical Propagation Path Loss Models for Fixed Wireless Access System”, IEEE Conference Express, 2005.
[2] Andrews, J.G., Gosh, A. and Muhamed, R. 2007. Fundamental of WiMAX: understanding broadband wireless networking. Westford, Massachusetts: Pearson Education, Inc.
[3] WiMAX Forum, “Mobile WiMAX Part I : A Technical Overview and Performance Evaluation”, 2006.
[4] Upase, B., Mythri, H., Vadgama, S. “RadioNetwork Dimensioning and Planning for WiMAX Networks”, FUJITSU Sci. Tech. Jurnal, 4(43): 435-449, 2007.
[5] Widiawan, A. K. “Characteristics and Performance of Airplane-based UMTS” A PhD Dissertation, University of Surrey, 2005. [6] WiMAX Forum, “WiMAX System Evaluation Methodology”,