THERMAL AND VISIBLE SATELLITE IMAGE FUSION USING WAVELET IN
REMOTE SENSING AND SATELLITE IMAGE PROCESSING
a A.H.Ahrari, b M.Kiavarz, cM.Hasanlou, d M.Marofi
a University of Tehran, Faculty of Geography, Department of Remote Sensing and GIS, Tehran [email protected] b University of Tehran, Faculty of Geography, Department of Remote Sensing and GIS, Tehran, [email protected]
c University of Tehran, Faculty of Survey, Department of Remote Sensing, Tehran, [email protected] d University of Tehran, Faculty of Geography, Department of Remote Sensing and GIS, Tehran, [email protected]
KEYWORDS: Multimodal Remote Sensing, Thermal and Visible Image Fusion, Wavelets Algorithms.
ABSTRACT:
Multimodal remote sensing approach is based on merging different data in different portions of electromagnetic radiation that improves the accuracy in satellite image processing and interpretations. Remote Sensing Visible and thermal infrared bands independently contain valuable spatial and spectral information. Visible bands make enough information spatially and thermal makes more different radiometric and spectral information than visible. However low spatial resolution is the most important limitation in thermal infrared bands. Using satellite image fusion, it is possible to merge them as a single thermal image that contains high spectral and spatial information at the same time. The aim of this study is a performance assessment of thermal and visible image fusion quantitatively and qualitatively with wavelet transform and different filters. In this research, wavelet algorithm (Haar) and different decomposition filters (mean.linear,ma,min and rand) for thermal and panchromatic bands of Landast8 Satellite were applied as shortwave and longwave fusion method . Finally, quality assessment has been done with quantitative and qualitative approaches. Quantitative parameters such as Entropy, Standard Deviation, Cross Correlation, Q Factor and Mutual Information were used. For thermal and visible image fusion accuracy assessment, all parameters (quantitative and qualitative) must be analysed with respect to each other. Among all relevant statistical factors, correlation has the most meaningful result and similarity to the qualitative assessment. Results showed that mean and linear filters make better fused images against the other filters in Haar algorithm. Linear and mean filters have same performance and there is not any difference between their qualitative and quantitative results.
INTRODUCTION
Remote Sensing (RS) is a science that using electromagnetic radiation (EMR) and signals records data and extract information (chemical and physical) from different objects and phenomenon and visualizes them. For more information about the nature of satellite images see (Schowengerdt Robert A., 2009).
Different portions of EM spectrum (EMS) enable users to see different phenomenon with different states (Pajares & de la Cruz, 2004). Each portion of EMS has unique characteristics and shows special properties of phenomenon more different than other portions. Multimodal Remote Sensing Approach (MRSA) has focused on merging different data which obtained by different sensors in different portions of EMS (Luis, Member, Tuia, & Member, 2015). For example, visible (VIS) portion of EMS has higher frequency and according to this it has high spatial information against thermal infrared (TIR) bands. On the other hand, TIR band has lower frequency and lower spatial information but it has more valuable radiometric and spectral information. So, based on fusion theory, a framework is needed for merging data which have different characteristics and properties, as merged image has higher quality than original ones. Data fusion is a formal framework in which are expressed means and tools for the alliance of data originating from different sources. It aims at obtaining information of greater quality; the exact definition of ‘greater quality’ will depend upon the application (Wald, 2009). In recent years many algorithms presented for satellite image fusion (SIF). Generally, they can be subdivided to two groups: 1) Component Substitution (CS) Methods and 2)
Multiresolution (MR) Image Fusion Methods. Some of the CS methods such as: PCA, IHS Transforms, Gram-Shmidth and Brovey Transform. On the other hand, MR methods commonly are wavelet based image fusion and frequency transforms. The key point in CS methods is spectral overlapping between input bands, otherwise it makes spectral distortions in fused image. However, MR methods can be used for merging some data that are related to different portions of EMR without spectral overlapping. In MR methods users can control the amount of spatial and spectral information that must be injected to the fused image(Vivone, Alparone, et al., 2014).
Figure 1. General structure of this paper
METHODOLY
WAVELET THEORY
Wavelet theory is a frequency based method of image processing which have many applications in signal and image processing such as image compression, noise reduction and image and signal fusion. The main assumption in this method is that each image contains high and low frequencies. Lower frequencies cover spectral information (approximation factor) and higher frequencies cover spatial details (details factor). (Misiti & Poggi, n.d.).
The wavelet based transformation is a forward and inverse process. First of all, it decomposes an image to many sub images using high pass and low pass filtering and it has continued hierarchically. Then sub images merged together using reconstruction process(Misiti & Poggi, n.d.).
3.1 Wavelet Application in Image Fusion
Wavelet based approach is an appropriate method for image fusion because of following reasons:
1) It’s a multiresolution approach which can be useful for performing image fusion with different resolutions. Many scientists believes this method as a suitable algorithm for image fusion(Adelson & Anderson, 1984, Florack, ter Haar Romeny, Koenderink, & Viergever, 1994, Burt P. & Adelson, 1983, Azriel & Mark, 1971)
2) Discrete wavelet transform decomposes image to many sub images and produces coefficients that keep information for each sub images.
3) Coefficient that obtained from sub images can be combined together and make new ones that are more effective.
4) Merged coefficients using inverse wavelet transformation make a final fused image(Pajares & de la Cruz, 2004).
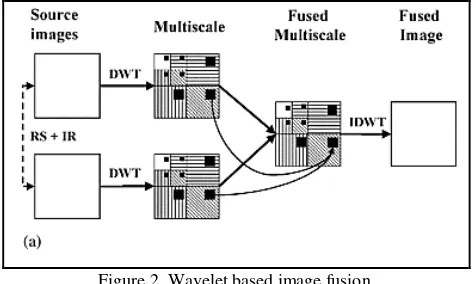
The inputs for image fusion using wavelet transforms have same or different spatial resolution. If they have different spatial resolution they must be co-registered together. Figure 2 shows decomposition of different information with horizontal, vertical and diagonal lines for each sub images. Also, dark rectangles in sub images shows the determined coefficients for each decomposed sub images(Pajares & de la Cruz, 2004).
Figure 2. Wavelet based image fusion
The complete procedure of image decomposition explained at (Transactions, Pattern, & Vol, 1989). According to (Stollnitz, DeRose, & Salesin, 1995) one dimensional wavelet transform can be extended to two dimensional space easily:
(1)
}LH=}(x)} (y)
zLL=z(x)z(y)
}HH=}(x)}(y)
}HL=}(x)}(y)
Where separation of spatial and spectral information performed by high and low pass filters on images (x,y) and finally IL(x,y) and IH(x,y) produced. Decomposition process in first level produces four sub images like IHH(x,y) that contains spectral information of original images. Another sub images like IHH(x,y),IHL(x,y) and ILH(x,y) contain spatial details(Pajares &
de la Cruz, 2004).
Wavelet based image fusion based on Haar algorithm is the reference method for MR approach. L and H are low and high pass filters which can be computed by equation 2 and 3.
(2) L/ (1/ 2)[1, - 1]
(3) H/ (1/ 2)[1, - 1]
I(x,y) is an original image with M#N dimension. li is the
low pass filter coefficient that i = 0,1,2,...,Ni- 1 and Ni is the
length of filter L. h(j) is the high pass filter coefficient that j = 0,1,2,...,Nh- 1 determines filter length H(Pajares & de la
Cruz, 2004).
(4) Il(x,y) =
Ni
1 l(i).I((2x + i)modM ,y),I
H(x,y) i = 0
Ni- 1
/
= Nh
1 h(j).I((2x + i)modM ,y)
j = 0 Nh- 1
/
for x = 0,1,2,..., 2
M -1and y = 0,1,2,...,N - 1
(5) ILL(x,y) =
Nl
1 l(i).I
L(x,(2y + i)modN),ILH(x,y) i = 0
Ni- 1
/
= Nl
1 l(j).I
L(x,(2y + j)modN) j = 0
(6)
Coefficients must be selected which are related together. Coefficients that are not related remove by thresholds because these values are close to zero. The method for threshold determination used based on(Morales & Shih, 2000):
(7) T =v 2logn / n
Where v is standard deviation and n is the size of samples. After image decomposition and coefficient determination that shows the amount of information in sub images. Inverse wavelet transform reconstructs fused image using high and low pass
Qualitative and quantitative approach used for accuracy assessment. Qualitative assessment is related to visual properties of image when compared with the original inputs. However in quantitative approach mathematical and statistical relations were used for validation(Christine Pohl, 2017). Fused image must have more information comparing with input ones(Vivone, Simões, et al., 2014).
There are many algorithms for validation of fused images, for more information see (Shi, Zhu, Tian, & Nichol, 2005). Generally, some common quantitative parameters used for thermal and visible image fusion are Entropy, Mutual Information compare with panchromatic (MI_p) and thermal band (MI_t), Spatial Frequency, Correlation, Cross Correlation with panchromatic (CC_p) and thermal band (CC_t), Q parameters and standard deviation (Kun, Lei, Huihui, & Jingsong, 2009,Zhao, Feng, Xu, Li, & Liu, 2013,Cui, Feng, Xu, Li, & Chen, 2015,Zhang, Lu, & Jia, 2013,Chen, Xiong, Liu, & Fan, 2014,Cui et al., 2015), (table 1-3 and figure 4-11 ).
DATA
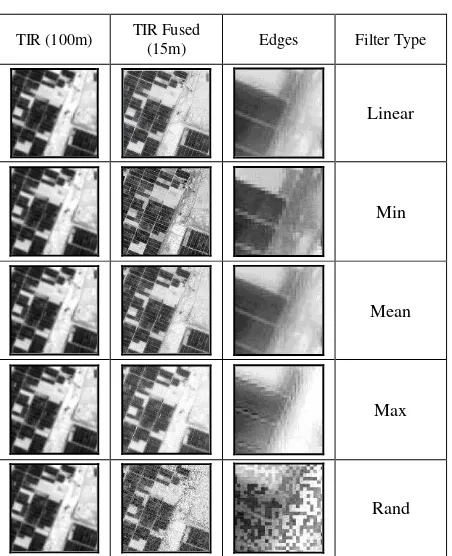
In this paper thermal (TIR-100m) and panchromatic (Pan-15m) image fusion (Landsat8) performed by wavelet transform. Input images must be co-registered but for some data that are originated from same sensor it is not very important. However, input images must be resampled to same columns and rows and pixel numbers(Wang, Ziou, Armenakis, Li, & Li, 2005). Figure 3 depicts the results of TIR and Pan image fusion with different filters of wavelet. Wavelet image fusion procedure completely has depicted in previous equations (1-9).
Filter Type
Figure 3. Visual results of different filters
RESULTS AND DISSCUSSION
In this paper thermal and panchromatic image fusion for landsat8 data performed by wavelet based (Haar) image fusion with different filters. In qualitative validation phase there is a clear difference for Haar algorithm with different filters. Five different filters (min, max, rand, linear and mean) used, however linear and mean creates better result.
Quantitative results are inconsistent with qualitative approach. For example linear and mean filters produced best qualitative results but in many quantitative parameters, they have lower value (table 1 and 2 and figure 3-11). However, these filters (mean and linear) have higher correlation values rather than the others. It shows that quantitative approach can’t be enough for accuracy assessment. For example, min filter produced most information with low visual quality or rand filter has most visual noise but it contains high spatial frequency.
From Entropy perspective, min and rand filters have highest information not true information.
max filter injected the most spectral and radiometrical information and after that mean and linear filters.
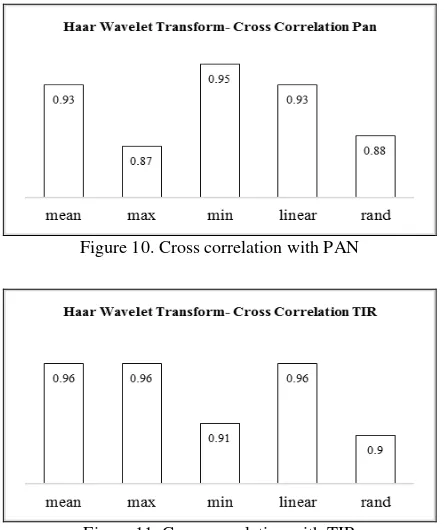
Cross Correlation shows the amount of correlation and linear relationship between input and outputs. So based on correlation between panchromatic and fused image (CC_p) min, mean and linear filters have better performance. It means that min filter saved the most spatial information because it has highest values at CC_p and MI_p.
In Cross Correlation with thermal band mean, linear and max filters have higher values than others. It means they added more spectral and radiometrical information to the fused image compare to other filters.
With respect to Q factor, min, mean and linear filters have the best relative result.
--- E SD MI_p MI_t
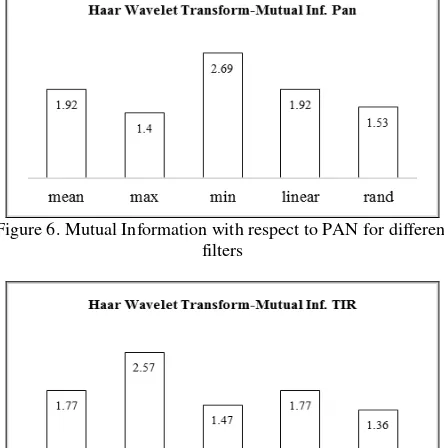
mean 7.28 63.44 1.92 1.77
max 7.01 62.36 1.4 2.57
min 7.62 68.35 2.69 1.47
linear 7.28 63.44 1.92 1.77
rand 7.55 67.59 1.53 1.36
Table 1.Quantitave parameters
--- CC_p CC_t Q
mean 0.93 0.96 0.54
max 0.87 0.96 0.45
min 0.95 0.91 0.65
linear 0.93 0.96 0.54
rand 0.88 0.9 0.49
Table 2. Quantitate parameters
Figure 4. Entropy of different filters
Figure 5.Standard deviation of different filters
Figure 6. Mutual Information with respect to PAN for different filters
Figure 7. Mutual Information with respect to TIR for different filters
Figure 8. Spatial frequency of different filters
Figure 10. Cross correlation with PAN
Figure 11. Cross correlation with TIR
CONCLUSION
In this paper we evaluated performance of wavelet based image fusion with different filters (mean.linear, max,min and rand) for satellite images(Landsat8 data ). Two different approaches used for accuracy assessment of fused images: 1) qualitative approach, 2) quantitative approach.
We showed the performance of different filters in wavelet based image fusion for satellite images. For this purpose, quantitative and qualitative results were considered. it is concluded that linear and mean filters have makes better fused image with respect to visual quality and quantitative values. And also these filters have more stable variation values in different quantitative measures so that they are in first three ranks at all.
Statistical parameters cannot be used for accuracy assessment in fusion process alone. For thermal and visible image fusion accuracy assessment, all parameters (quantitative and qualitative) must be analysed with respect to each other. Qualitative validation is better than quantitate ones. Among all relevant statistical factors, correlation has most meaningful result and similarity to the qualitative assessment. Linear and mean filters have same performance and there is not any difference between their qualitative and quantitative results.
REFERNCES
Adelson, E., & Anderson, C. (1984). Pyramid methods in image processing. RCA Engineer, 29(6), 33–41. http://doi.org/10.1.1.59.9419
Azriel, R., & Mark, T. (1971). Edge and Curve Detection for Visual Scene AnaIysis. IEEE Transactions on Computers, C-20(5), 562–569. http://doi.org/10.1109/T-C.1971.223290 Burt P., & Adelson, E. (1983). The Laplacian pyramid as a compact image code. IEEE Trans. Commun., 31(4)(4), 532– 540.
Chen, Y., Xiong, J., Liu, H., & Fan, Q. (2014). Optik Fusion
characteristic and regionalization in NSCT domain. Optik - International Journal for Light and Electron Optics, 125(17), 4980–4984. http://doi.org/10.1016/j.ijleo.2014.04.006
Christine Pohl, J. van G. (2017). Remote Sensing Image Fusion A Practical Guide. CRC Press.
Cui, G., Feng, H., Xu, Z., Li, Q., & Chen, Y. (2015). Detail preserved fusion of visible and infrared images using regional saliency extraction and multi-scale image decomposition, 341, 199–209. http://doi.org/10.1016/j.optcom.2014.12.032
Florack, L. M. J., ter Haar Romeny, B. M., Koenderink, J. J., & Viergever, M. A. (1994). Linear scale-space. Journal of
Mathematical Imaging and Vision, 4(4), 325–351.
http://doi.org/10.1007/BF01262401
Kun, L., Lei, G., Huihui, L., & Jingsong, C. (2009). Fusion of Infrared and Visible Light Images Based on Region Segmentation. Chinese Journal of Aeronautics, 22(1), 75–80. http://doi.org/10.1016/S1000-9361(08)60071-0
Luis, G., Member, S., Tuia, D., & Member, S. (2015). Multimodal Classification of Remote Sensing Images : A Review and Future Directions, 1–52. http://doi.org/10.1109/JPROC.2015.2449668
Misiti, M., & Poggi, J. (n.d.). Wavelet Toolbox For Use with MATLAB.
Morales, E., & Shih, F. Y. (2000). Wavelet coeficients clustering using morphological operations and pruned quadtrees, 33, 1611–1620. http://doi.org/10.1016/S0031-3203(99)00147-8
Pajares, G., & de la Cruz, J. M. (2004). A wavelet-based image fusion tutorial. Pattern Recognition, 37(9), 1855–1872. http://doi.org/10.1016/j.patcog.2004.03.010
Schowengerdt Robert A. (2009). Remote Sensing: Models And Methods For Image Processing, 3Rd Edition. Elsevier Science & Technology (2009).
Shi, W., Zhu, C., Tian, Y., & Nichol, J. (2005). Wavelet-based image fusion and quality assessment. International Journal of Applied Earth Observation and Geoinformation, 6(3–4), 241– 251. http://doi.org/10.1016/j.jag.2004.10.010
Stollnitz, E. J., DeRose, a. D., & Salesin, D. H. (1995). Wavelets for computer graphics: a primer.1. IEEE Computer
Graphics and Applications, 15(May), 1–8.
http://doi.org/10.1109/38.376616
Transactions, I., Pattern, O. N., & Vol, M. I. (1989). A Theory for Multiresolution Signal Decomposition : The Wavelet Representation, I(7), 674–693.
Vivone, G., Alparone, L., Chanussot, J., Mura, M. D., Garzelli, A., Member, S., … Wald, L. (2014). Pansharpening Algorithms. IEEE Transactions on Geoscience and Remote Sensing, 53(5), 2565–2586.
Vivone, G., Simões, M., Mura, M. D., Restaino, R., Bioucas-dias, J. M., Licciardi, G. A., & Chanussot, J. (2014). Pansharpening Based on Semiblind Deconvolution, 1–14. Wald, L. (2009). Some terms of reference in data fusion SOME TERMS OF REFERENCE IN DATA, 37(3), 1190–1193. Wang, Z., Ziou, D., Armenakis, C., Li, D., & Li, Q. (2005). A Comparative Analysis of Image Fusion Methods, 43(6), 1391– 1402.
Zhang, B., Lu, X., & Jia, W. (2013). Optik A multi-focus image fusion algorithm based on an improved dual-channel PCNN in NSCT domain. Optik - International Journal for Light and
Electron Optics, 124(20), 4104–4109.
http://doi.org/10.1016/j.ijleo.2012.12.032